This regulatory network was inferred from the input dataset. The miRNAs and mRNAs are
presented as round and rectangle nodes respectively. The numerical value popped up upon mouse over the gene node is the log2 transformed fold-change of the gene expression between the two groups. All of the nodes are clickable, and the detailed information of the miRNAs/mRNAs and related cancer pathway will be displayed in another window. The edges between nodes are supported by both interactions (predicted or experimentally verified) and correlations learnt from cancer dataset. The numerical value popped up upon mouse over the edge is the correlation beat value (effect size) between the two nodes. The experimental evidences of the edges reported in previous cancer studies are highlighted by red/orange color. All of these information can be accessed by the "mouse-over" action. This network shows a full map of the miRNA-mRNA regulation of the input gene list(s), and the hub miRNAs (with the high network degree/betweenness centrality) would be the potential cancer drivers or tumor suppressors. The full result table can be accessed in the "Regulations" tab.
"miRNACancerMAP" is also a network visualization tool for users to draw their regulatory network by personal customization. Users can set the complexity of the network by limiting the number of nodes or edges. And the color of the nodes can be defined by different categories of the mRNAs and miRNAs, such as Gene-Ontology, pathway, and expression status. Users can also select to use network degree or network betweenness centrality to define the node size. And edges can be black or colored by the correlation. Purple edge means negative correlation (mostly found between miRNA and mRNA), and blue edge means positive correlation (found in PPI or miRNA-miRNA sponge effect). We can also add the protein-protein interactions (PPI) into the network. This result will show the cluster of genes regulated by some specific miRNAs. Additionally, miRNA-miRNA edges can be added by the "miRNA sponge" button, presenting some clusters of miRNAs that have the interactions via sponge effect.
miRNA-gene regulations
| Num | microRNA | Gene | miRNA log2FC | miRNA pvalue | Gene log2FC | Gene pvalue | Interaction | Correlation beta | Correlation P-value | PMID | Reported in cancer studies |
|---|---|---|---|---|---|---|---|---|---|---|---|
| 1 | hsa-miR-125a-5p | ABHD3 | 0.6 | 0.01023 | 0.98 | 0 | PITA; miRanda | -0.1 | 0.01012 | NA | |
| 2 | hsa-miR-125a-5p | ABL2 | 0.6 | 0.01023 | -0.32 | 0.04554 | MirTarget; PITA | -0.22 | 0 | 26766902 | MicroRNA 125a 5p modulates human cervical carcinoma proliferation and migration by targeting ABL2; The direct regulation of miR-125a-5p on its target gene ABL proto-oncogene 2 ABL2 in cervical carcinoma was evaluated by quantitative real-time reverse transcription polymerase chain reaction Western blotting and luciferase reporter assays respectively; ABL2 was shown to be directly targeted by miR-125a-5p; In cervical carcinoma ABL2 gene and protein levels were both downregulated by miR-125a-5p |
| 3 | hsa-miR-125a-5p | ACAT1 | 0.6 | 0.01023 | -1.05 | 0 | miRanda | -0.26 | 0 | NA | |
| 4 | hsa-miR-125a-5p | ACTBL2 | 0.6 | 0.01023 | 1.68 | 0.00368 | miRanda | -0.67 | 0 | NA | |
| 5 | hsa-miR-125a-5p | ACTG2 | 0.6 | 0.01023 | -5.39 | 0 | miRanda | -0.51 | 0.00044 | NA | |
| 6 | hsa-miR-125a-5p | ADAM19 | 0.6 | 0.01023 | -1.06 | 0.01895 | mirMAP | -0.65 | 0 | NA | |
| 7 | hsa-miR-125a-5p | ADAMTS14 | 0.6 | 0.01023 | 0.61 | 0.12479 | miRanda; mirMAP | -0.23 | 0.00478 | NA | |
| 8 | hsa-miR-125a-5p | ADAMTS15 | 0.6 | 0.01023 | -2.81 | 0 | mirMAP | -0.81 | 0 | NA | |
| 9 | hsa-miR-125a-5p | ADARB1 | 0.6 | 0.01023 | -1.93 | 0 | mirMAP | -0.26 | 7.0E-5 | NA | |
| 10 | hsa-miR-125a-5p | ADCY9 | 0.6 | 0.01023 | -1.5 | 0 | mirMAP | -0.32 | 0 | NA | |
| 11 | hsa-miR-125a-5p | ADD2 | 0.6 | 0.01023 | -0.72 | 0.25015 | MirTarget; miRanda | -0.88 | 0 | NA | |
| 12 | hsa-miR-125a-5p | ADM2 | 0.6 | 0.01023 | 2.23 | 0 | mirMAP | -0.21 | 0.0146 | NA | |
| 13 | hsa-miR-125a-5p | ADPRH | 0.6 | 0.01023 | -0.71 | 0.00334 | miRanda | -0.21 | 3.0E-5 | NA | |
| 14 | hsa-miR-125a-5p | ADRB3 | 0.6 | 0.01023 | -5.02 | 0 | miRanda | -0.38 | 0.00257 | NA | |
| 15 | hsa-miR-125a-5p | AEN | 0.6 | 0.01023 | -0.36 | 0.01541 | miRanda | -0.12 | 0.00013 | NA | |
| 16 | hsa-miR-125a-5p | AFAP1L2 | 0.6 | 0.01023 | 0.06 | 0.85809 | miRanda | -0.14 | 0.03234 | NA | |
| 17 | hsa-miR-125a-5p | AGPAT4 | 0.6 | 0.01023 | -0.79 | 0.01174 | miRanda | -0.26 | 9.0E-5 | NA | |
| 18 | hsa-miR-125a-5p | AGTRAP | 0.6 | 0.01023 | 0.96 | 0 | miRNAWalker2 validate; miRanda | -0.1 | 0.01113 | NA | |
| 19 | hsa-miR-125a-5p | AKAP11 | 0.6 | 0.01023 | -0.8 | 0 | miRanda | -0.1 | 0.00318 | NA | |
| 20 | hsa-miR-125a-5p | AKAP13 | 0.6 | 0.01023 | -1.15 | 0 | miRanda | -0.18 | 0 | NA | |
| 21 | hsa-miR-125a-5p | ALDH1A3 | 0.6 | 0.01023 | -1.34 | 0.0022 | miRanda | -0.29 | 0.0018 | NA | |
| 22 | hsa-miR-125a-5p | ALDH6A1 | 0.6 | 0.01023 | -0.99 | 1.0E-5 | miRanda | -0.13 | 0.00722 | NA | |
| 23 | hsa-miR-125a-5p | ANKH | 0.6 | 0.01023 | -0.38 | 0.21654 | mirMAP | -0.21 | 0.00143 | NA | |
| 24 | hsa-miR-125a-5p | ANKRD29 | 0.6 | 0.01023 | -3.47 | 0 | MirTarget; miRanda | -0.86 | 0 | NA | |
| 25 | hsa-miR-125a-5p | ANKRD44 | 0.6 | 0.01023 | -1.93 | 0 | miRanda | -0.48 | 0 | NA | |
| 26 | hsa-miR-125a-5p | ANKS6 | 0.6 | 0.01023 | 0.1 | 0.68568 | MirTarget | -0.23 | 1.0E-5 | NA | |
| 27 | hsa-miR-125a-5p | ANPEP | 0.6 | 0.01023 | -0.91 | 0.0551 | PITA; miRanda; miRNATAP | -0.29 | 0.00316 | NA | |
| 28 | hsa-miR-125a-5p | ANTXR2 | 0.6 | 0.01023 | -2.31 | 0 | PITA | -0.27 | 5.0E-5 | NA | |
| 29 | hsa-miR-125a-5p | APC | 0.6 | 0.01023 | -0.6 | 0.00012 | miRanda | -0.21 | 0 | NA | |
| 30 | hsa-miR-125a-5p | API5 | 0.6 | 0.01023 | -0.2 | 0.06111 | miRanda | -0.15 | 0 | NA | |
| 31 | hsa-miR-125a-5p | ARHGAP11B | 0.6 | 0.01023 | 2.25 | 0 | miRanda | -0.25 | 0.00065 | NA | |
| 32 | hsa-miR-125a-5p | ARHGAP25 | 0.6 | 0.01023 | -0.72 | 0.00654 | miRanda | -0.19 | 0.00049 | NA | |
| 33 | hsa-miR-125a-5p | ARL10 | 0.6 | 0.01023 | -1.12 | 0.00198 | mirMAP | -0.46 | 0 | NA | |
| 34 | hsa-miR-125a-5p | ARNTL | 0.6 | 0.01023 | -0.36 | 0.08956 | miRanda | -0.21 | 0 | NA | |
| 35 | hsa-miR-125a-5p | ARSI | 0.6 | 0.01023 | -1.42 | 0.02177 | MirTarget; miRanda | -0.92 | 0 | NA | |
| 36 | hsa-miR-125a-5p | ASB2 | 0.6 | 0.01023 | -3.86 | 0 | miRanda | -0.65 | 0 | NA | |
| 37 | hsa-miR-125a-5p | ATL2 | 0.6 | 0.01023 | -0.08 | 0.64926 | miRNAWalker2 validate; miRanda | -0.2 | 0 | NA | |
| 38 | hsa-miR-125a-5p | ATP10D | 0.6 | 0.01023 | -0.69 | 0.01004 | MirTarget; miRanda | -0.26 | 0 | NA | |
| 39 | hsa-miR-125a-5p | ATP6V1B2 | 0.6 | 0.01023 | -0.17 | 0.24474 | miRanda | -0.17 | 0 | NA | |
| 40 | hsa-miR-125a-5p | ATP8B2 | 0.6 | 0.01023 | -1.89 | 0 | MirTarget | -0.39 | 0 | NA | |
| 41 | hsa-miR-125a-5p | ATP8B4 | 0.6 | 0.01023 | -1.9 | 0 | miRanda | -0.38 | 0 | NA | |
| 42 | hsa-miR-125a-5p | ATXN1 | 0.6 | 0.01023 | -1.51 | 0 | miRNAWalker2 validate; MirTarget; PITA; miRNATAP | -0.3 | 0 | NA | |
| 43 | hsa-miR-125a-5p | B2M | 0.6 | 0.01023 | -0 | 0.98848 | miRanda | -0.2 | 0.00015 | NA | |
| 44 | hsa-miR-125a-5p | B3GALNT2 | 0.6 | 0.01023 | -0.6 | 0 | MirTarget; miRanda; miRNATAP | -0.15 | 0 | NA | |
| 45 | hsa-miR-125a-5p | B4GALNT1 | 0.6 | 0.01023 | -0.59 | 0.29462 | miRanda | -0.84 | 0 | NA | |
| 46 | hsa-miR-125a-5p | BACE1 | 0.6 | 0.01023 | -0.72 | 0.00096 | mirMAP | -0.18 | 6.0E-5 | NA | |
| 47 | hsa-miR-125a-5p | BAG4 | 0.6 | 0.01023 | 0.14 | 0.55811 | MirTarget | -0.16 | 0.00089 | NA | |
| 48 | hsa-miR-125a-5p | BAK1 | 0.6 | 0.01023 | 0.76 | 0.00013 | miRNAWalker2 validate; PITA; miRanda; miRNATAP | -0.1 | 0.01351 | NA | |
| 49 | hsa-miR-125a-5p | BATF2 | 0.6 | 0.01023 | 0.06 | 0.89203 | miRanda | -0.39 | 4.0E-5 | NA | |
| 50 | hsa-miR-125a-5p | BAZ1A | 0.6 | 0.01023 | 0.41 | 0.01012 | miRanda | -0.11 | 0.00058 | NA | |
| 51 | hsa-miR-125a-5p | BCAT1 | 0.6 | 0.01023 | 0.31 | 0.53319 | MirTarget | -0.49 | 0 | NA | |
| 52 | hsa-miR-125a-5p | BCL2 | 0.6 | 0.01023 | -2.02 | 0 | PITA | -0.2 | 0.00065 | NA | |
| 53 | hsa-miR-125a-5p | BEND6 | 0.6 | 0.01023 | -0.8 | 0.03128 | miRanda | -0.35 | 0 | NA | |
| 54 | hsa-miR-125a-5p | BIN2 | 0.6 | 0.01023 | -0.82 | 0.04018 | miRanda; miRNATAP | -0.38 | 1.0E-5 | NA | |
| 55 | hsa-miR-125a-5p | BLZF1 | 0.6 | 0.01023 | -0.38 | 0.01298 | miRanda | -0.17 | 0 | NA | |
| 56 | hsa-miR-125a-5p | BMP1 | 0.6 | 0.01023 | 0.19 | 0.45337 | mirMAP | -0.14 | 0.01248 | NA | |
| 57 | hsa-miR-125a-5p | BMPR1B | 0.6 | 0.01023 | 0.07 | 0.91404 | MirTarget; miRNATAP | -0.81 | 0 | NA | |
| 58 | hsa-miR-125a-5p | BRCC3 | 0.6 | 0.01023 | 0.16 | 0.30814 | miRanda | -0.13 | 5.0E-5 | NA | |
| 59 | hsa-miR-125a-5p | BRD3 | 0.6 | 0.01023 | -0.16 | 0.29566 | miRanda | -0.12 | 0.00013 | NA | |
| 60 | hsa-miR-125a-5p | BTC | 0.6 | 0.01023 | -1.9 | 8.0E-5 | miRanda | -0.27 | 0.00787 | NA | |
| 61 | hsa-miR-125a-5p | C2 | 0.6 | 0.01023 | 0.19 | 0.65465 | miRanda | -0.23 | 0.00866 | NA | |
| 62 | hsa-miR-125a-5p | CACNA1B | 0.6 | 0.01023 | 0.25 | 0.68303 | MirTarget; miRanda; miRNATAP | -0.28 | 0.03205 | NA | |
| 63 | hsa-miR-125a-5p | CAMK2A | 0.6 | 0.01023 | -4.14 | 0 | mirMAP | -0.75 | 0 | NA | |
| 64 | hsa-miR-125a-5p | CAND2 | 0.6 | 0.01023 | -1.77 | 1.0E-5 | miRanda | -0.22 | 0.01091 | NA | |
| 65 | hsa-miR-125a-5p | CAPZA2 | 0.6 | 0.01023 | -0.83 | 0 | miRanda | -0.11 | 3.0E-5 | NA | |
| 66 | hsa-miR-125a-5p | CBX6 | 0.6 | 0.01023 | -1.54 | 0 | mirMAP | -0.16 | 0.01253 | NA | |
| 67 | hsa-miR-125a-5p | CCDC91 | 0.6 | 0.01023 | -0.41 | 0.01203 | miRanda | -0.12 | 0.00036 | NA | |
| 68 | hsa-miR-125a-5p | CCL5 | 0.6 | 0.01023 | -0.09 | 0.86108 | miRNAWalker2 validate | -0.27 | 0.0115 | NA | |
| 69 | hsa-miR-125a-5p | CCR2 | 0.6 | 0.01023 | -0.81 | 0.0912 | miRanda | -0.24 | 0.01723 | NA | |
| 70 | hsa-miR-125a-5p | CCR5 | 0.6 | 0.01023 | -0.51 | 0.25508 | miRanda | -0.45 | 0 | NA | |
| 71 | hsa-miR-125a-5p | CD244 | 0.6 | 0.01023 | -0.75 | 0.11701 | miRanda | -0.23 | 0.02134 | NA | |
| 72 | hsa-miR-125a-5p | CD248 | 0.6 | 0.01023 | -1.89 | 0 | PITA; miRanda; miRNATAP | -0.23 | 0.00215 | NA | |
| 73 | hsa-miR-125a-5p | CD300LF | 0.6 | 0.01023 | 0.49 | 0.24436 | miRNATAP | -0.42 | 0 | NA | |
| 74 | hsa-miR-125a-5p | CD69 | 0.6 | 0.01023 | -2.49 | 0 | miRanda | -0.32 | 0.00232 | NA | |
| 75 | hsa-miR-125a-5p | CD72 | 0.6 | 0.01023 | 0.23 | 0.52819 | miRanda | -0.19 | 0.01392 | NA | |
| 76 | hsa-miR-125a-5p | CD84 | 0.6 | 0.01023 | -0.53 | 0.27947 | miRanda | -0.67 | 0 | NA | |
| 77 | hsa-miR-125a-5p | CD8A | 0.6 | 0.01023 | -0.72 | 0.14726 | miRanda | -0.51 | 0 | NA | |
| 78 | hsa-miR-125a-5p | CDA | 0.6 | 0.01023 | 0.13 | 0.79951 | miRanda | -0.43 | 2.0E-5 | NA | |
| 79 | hsa-miR-125a-5p | CDK17 | 0.6 | 0.01023 | -0.52 | 0.00027 | miRanda | -0.13 | 1.0E-5 | NA | |
| 80 | hsa-miR-125a-5p | CDK5RAP2 | 0.6 | 0.01023 | -0.43 | 0.00431 | miRanda | -0.2 | 0 | NA | |
| 81 | hsa-miR-125a-5p | CDKN2B | 0.6 | 0.01023 | -0.11 | 0.83235 | miRanda | -0.31 | 0.00518 | NA | |
| 82 | hsa-miR-125a-5p | CEACAM21 | 0.6 | 0.01023 | -0.15 | 0.72613 | miRanda | -0.39 | 1.0E-5 | NA | |
| 83 | hsa-miR-125a-5p | CELF1 | 0.6 | 0.01023 | -0.3 | 0.01785 | mirMAP | -0.15 | 0 | NA | |
| 84 | hsa-miR-125a-5p | CENPO | 0.6 | 0.01023 | 1.82 | 0 | mirMAP | -0.14 | 0.0013 | NA | |
| 85 | hsa-miR-125a-5p | CFLAR | 0.6 | 0.01023 | -0.23 | 0.20284 | miRanda | -0.23 | 0 | NA | |
| 86 | hsa-miR-125a-5p | CGREF1 | 0.6 | 0.01023 | 1.54 | 0.00763 | MirTarget; miRanda | -0.37 | 0.00191 | NA | |
| 87 | hsa-miR-125a-5p | CHD1 | 0.6 | 0.01023 | -0.57 | 4.0E-5 | miRanda | -0.13 | 1.0E-5 | NA | |
| 88 | hsa-miR-125a-5p | CHRM3 | 0.6 | 0.01023 | -2.48 | 3.0E-5 | miRanda | -0.6 | 0 | NA | |
| 89 | hsa-miR-125a-5p | CHRNB2 | 0.6 | 0.01023 | 0.9 | 0.02654 | mirMAP | -0.26 | 0.0024 | NA | |
| 90 | hsa-miR-125a-5p | CKS1B | 0.6 | 0.01023 | 1.72 | 0 | miRanda | -0.13 | 0.00687 | NA | |
| 91 | hsa-miR-125a-5p | CLEC2B | 0.6 | 0.01023 | -0.84 | 0.04958 | miRanda | -0.39 | 1.0E-5 | NA | |
| 92 | hsa-miR-125a-5p | CNNM1 | 0.6 | 0.01023 | -3.31 | 0 | PITA; miRanda | -0.44 | 0.00016 | NA | |
| 93 | hsa-miR-125a-5p | CNTLN | 0.6 | 0.01023 | -1.17 | 0.00322 | miRanda | -0.54 | 0 | NA | |
| 94 | hsa-miR-125a-5p | COL14A1 | 0.6 | 0.01023 | -3.66 | 0 | miRanda | -0.23 | 0.01682 | NA | |
| 95 | hsa-miR-125a-5p | COL1A2 | 0.6 | 0.01023 | -0.91 | 0.05362 | miRanda | -0.32 | 0.00107 | NA | |
| 96 | hsa-miR-125a-5p | COL4A1 | 0.6 | 0.01023 | 0.15 | 0.58169 | miRNAWalker2 validate; miRanda | -0.2 | 0.00057 | NA | |
| 97 | hsa-miR-125a-5p | CORO1C | 0.6 | 0.01023 | -1.12 | 0 | miRNAWalker2 validate | -0.41 | 0 | NA | |
| 98 | hsa-miR-125a-5p | CPT1A | 0.6 | 0.01023 | -0.83 | 0.00093 | miRanda | -0.21 | 4.0E-5 | NA | |
| 99 | hsa-miR-125a-5p | CR1 | 0.6 | 0.01023 | -1.99 | 0.00029 | miRanda | -0.65 | 0 | NA | |
| 100 | hsa-miR-125a-5p | CREB5 | 0.6 | 0.01023 | -2.28 | 0 | miRNAWalker2 validate | -0.53 | 0 | NA | |
| 101 | hsa-miR-125a-5p | CREM | 0.6 | 0.01023 | -1.35 | 0 | miRanda | -0.1 | 0.00724 | NA | |
| 102 | hsa-miR-125a-5p | CRK | 0.6 | 0.01023 | -0.6 | 4.0E-5 | miRNAWalker2 validate | -0.13 | 1.0E-5 | NA | |
| 103 | hsa-miR-125a-5p | CSF1 | 0.6 | 0.01023 | -1.3 | 0.00033 | mirMAP | -0.4 | 0 | NA | |
| 104 | hsa-miR-125a-5p | CSF2RB | 0.6 | 0.01023 | -0.74 | 0.0696 | miRanda | -0.43 | 0 | NA | |
| 105 | hsa-miR-125a-5p | CTH | 0.6 | 0.01023 | -0.02 | 0.95595 | miRanda | -0.19 | 0.00571 | NA | |
| 106 | hsa-miR-125a-5p | CXCL13 | 0.6 | 0.01023 | 0.84 | 0.29157 | miRanda | -0.99 | 0 | NA | |
| 107 | hsa-miR-125a-5p | CYB5R4 | 0.6 | 0.01023 | -0.07 | 0.6698 | miRanda | -0.15 | 0 | NA | |
| 108 | hsa-miR-125a-5p | CYBB | 0.6 | 0.01023 | -0.86 | 0.06319 | miRanda | -0.61 | 0 | NA | |
| 109 | hsa-miR-125a-5p | CYTH3 | 0.6 | 0.01023 | -0.27 | 0.19343 | mirMAP | -0.22 | 0 | NA | |
| 110 | hsa-miR-125a-5p | CYTH4 | 0.6 | 0.01023 | -0.8 | 0.05153 | miRanda | -0.47 | 0 | NA | |
| 111 | hsa-miR-125a-5p | DAAM1 | 0.6 | 0.01023 | -0.94 | 0.00028 | MirTarget | -0.36 | 0 | NA | |
| 112 | hsa-miR-125a-5p | DCAF10 | 0.6 | 0.01023 | -0.23 | 0.06446 | MirTarget | -0.14 | 0 | NA | |
| 113 | hsa-miR-125a-5p | DCLK1 | 0.6 | 0.01023 | -3.63 | 0 | miRanda | -0.68 | 0 | NA | |
| 114 | hsa-miR-125a-5p | DCTN1 | 0.6 | 0.01023 | -0.35 | 0.00097 | miRNATAP | -0.1 | 0 | NA | |
| 115 | hsa-miR-125a-5p | DHFR | 0.6 | 0.01023 | 0.46 | 0.02432 | miRanda | -0.18 | 3.0E-5 | NA | |
| 116 | hsa-miR-125a-5p | DHX33 | 0.6 | 0.01023 | 0.22 | 0.41826 | MirTarget; miRNATAP | -0.22 | 0.0001 | NA | |
| 117 | hsa-miR-125a-5p | DIAPH3 | 0.6 | 0.01023 | 2.49 | 0 | miRanda | -0.38 | 0 | NA | |
| 118 | hsa-miR-125a-5p | DIRAS1 | 0.6 | 0.01023 | -3.19 | 0 | PITA; miRanda | -0.4 | 0.00133 | NA | |
| 119 | hsa-miR-125a-5p | DLD | 0.6 | 0.01023 | -0.32 | 0.01112 | MirTarget; miRanda | -0.11 | 2.0E-5 | NA | |
| 120 | hsa-miR-125a-5p | DMC1 | 0.6 | 0.01023 | -0.83 | 0.06436 | miRanda | -0.35 | 0.00016 | NA | |
| 121 | hsa-miR-125a-5p | DNAH11 | 0.6 | 0.01023 | 0.65 | 0.31423 | miRanda | -0.61 | 1.0E-5 | NA | |
| 122 | hsa-miR-125a-5p | DNAJB5 | 0.6 | 0.01023 | -2.65 | 0 | miRanda; miRNATAP | -0.54 | 0 | NA | |
| 123 | hsa-miR-125a-5p | DOCK11 | 0.6 | 0.01023 | -1.8 | 0 | miRanda | -0.5 | 0 | NA | |
| 124 | hsa-miR-125a-5p | DPF3 | 0.6 | 0.01023 | -1.67 | 1.0E-5 | mirMAP | -0.45 | 0 | NA | |
| 125 | hsa-miR-125a-5p | DPP4 | 0.6 | 0.01023 | -0.61 | 0.28445 | miRanda | -0.63 | 0 | NA | |
| 126 | hsa-miR-125a-5p | DPY19L2P2 | 0.6 | 0.01023 | -1.08 | 0.00966 | miRanda | -0.33 | 0.00011 | NA | |
| 127 | hsa-miR-125a-5p | DPYD | 0.6 | 0.01023 | -1.71 | 0.00028 | miRanda | -0.63 | 0 | NA | |
| 128 | hsa-miR-125a-5p | DPYSL3 | 0.6 | 0.01023 | -2.32 | 0 | miRanda | -0.5 | 0 | NA | |
| 129 | hsa-miR-125a-5p | DRP2 | 0.6 | 0.01023 | -1.35 | 0.00023 | MirTarget | -0.3 | 0.0001 | NA | |
| 130 | hsa-miR-125a-5p | DST | 0.6 | 0.01023 | -1.12 | 9.0E-5 | mirMAP | -0.17 | 0.00446 | NA | |
| 131 | hsa-miR-125a-5p | DSTN | 0.6 | 0.01023 | -1.58 | 0 | miRanda | -0.17 | 0 | NA | |
| 132 | hsa-miR-125a-5p | DTNA | 0.6 | 0.01023 | -4.06 | 0 | miRanda | -0.72 | 0 | NA | |
| 133 | hsa-miR-125a-5p | DUSP3 | 0.6 | 0.01023 | -1.04 | 0 | miRNAWalker2 validate | -0.19 | 0 | NA | |
| 134 | hsa-miR-125a-5p | DUSP7 | 0.6 | 0.01023 | 0.25 | 0.41555 | miRanda | -0.25 | 8.0E-5 | NA | |
| 135 | hsa-miR-125a-5p | E2F2 | 0.6 | 0.01023 | 2.71 | 0 | MirTarget | -0.3 | 2.0E-5 | NA | |
| 136 | hsa-miR-125a-5p | E2F7 | 0.6 | 0.01023 | 2.72 | 0 | miRNAWalker2 validate | -0.22 | 0.00336 | NA | |
| 137 | hsa-miR-125a-5p | ECE1 | 0.6 | 0.01023 | -0.29 | 0.08009 | mirMAP | -0.14 | 6.0E-5 | NA | |
| 138 | hsa-miR-125a-5p | ECE2 | 0.6 | 0.01023 | 1.99 | 0 | miRanda | -0.15 | 0.00145 | NA | |
| 139 | hsa-miR-125a-5p | EGFR | 0.6 | 0.01023 | -0.23 | 0.5939 | mirMAP | -0.46 | 0 | 19881956; 27094723; 24484870 | We report that EGFR signaling leads to transcriptional repression of the miRNA miR-125a through the ETS family transcription factor PEA3;Suppression of microRNA 125a 5p upregulates the TAZ EGFR signaling pathway and promotes retinoblastoma proliferation; Moreover the overexpression of miR-125a-5p led to a decrease in TAZ expression and downstream EGFR signaling pathway activation both in vitro and vivo; Finally TAZ overexpression in retinoblastoma cells overexpressing miR-125a-5p restored retinoblastoma cell proliferation and EGFR pathway activation; Taken together our data demonstrated that miR-125a-5p functions as an important tumor suppressor that suppresses the EGFR pathway by targeting TAZ to inhibit tumor progression in retinoblastoma;miR 125a regulates cell cycle proliferation and apoptosis by targeting the ErbB pathway in acute myeloid leukemia; Profiling revealed the ErbB pathway as significantly decreased with ectopic miR-125a; Either ectopic expression of miR-125a or inhibition of ErbB via Mubritinib resulted in inhibition of cell cycle proliferation and progression with enhanced apoptosis revealing ErbB inhibitors as potential novel therapeutic agents for treating miR-125a-low AML |
| 140 | hsa-miR-125a-5p | EGR3 | 0.6 | 0.01023 | -4.25 | 0 | PITA | -0.45 | 0 | NA | |
| 141 | hsa-miR-125a-5p | EIF4H | 0.6 | 0.01023 | -0.23 | 0.02542 | miRanda | -0.13 | 0 | NA | |
| 142 | hsa-miR-125a-5p | EIF5A2 | 0.6 | 0.01023 | -1.12 | 0.00497 | PITA; miRanda | -0.66 | 0 | NA | |
| 143 | hsa-miR-125a-5p | ELOVL4 | 0.6 | 0.01023 | -0.9 | 0.05961 | miRanda | -0.76 | 0 | NA | |
| 144 | hsa-miR-125a-5p | EMILIN2 | 0.6 | 0.01023 | -0.48 | 0.11275 | miRanda | -0.17 | 0.00849 | NA | |
| 145 | hsa-miR-125a-5p | ENKUR | 0.6 | 0.01023 | 1.45 | 0.00183 | miRanda | -0.48 | 0 | NA | |
| 146 | hsa-miR-125a-5p | ENO1 | 0.6 | 0.01023 | 0.86 | 0 | miRNAWalker2 validate | -0.15 | 9.0E-5 | NA | |
| 147 | hsa-miR-125a-5p | ENPEP | 0.6 | 0.01023 | -0.33 | 0.36616 | PITA; miRanda | -0.32 | 2.0E-5 | NA | |
| 148 | hsa-miR-125a-5p | ENTPD1 | 0.6 | 0.01023 | -1.12 | 0 | miRanda | -0.21 | 0 | NA | |
| 149 | hsa-miR-125a-5p | EPHA6 | 0.6 | 0.01023 | -3.76 | 0 | miRanda | -0.64 | 0 | NA | |
| 150 | hsa-miR-125a-5p | EPM2A | 0.6 | 0.01023 | -1.9 | 0 | miRanda | -0.2 | 0 | NA |
| Num | GO | Overlap | Size | P Value | Adj. P Value |
|---|---|---|---|---|---|
| 1 | IMMUNE SYSTEM PROCESS | 103 | 1984 | 4.086e-09 | 1.901e-05 |
| 2 | POSITIVE REGULATION OF MOLECULAR FUNCTION | 91 | 1791 | 1.058e-07 | 0.0002462 |
| 3 | POSITIVE REGULATION OF RESPONSE TO STIMULUS | 94 | 1929 | 4.263e-07 | 0.0004981 |
| 4 | CELLULAR RESPONSE TO ORGANIC SUBSTANCE | 91 | 1848 | 4.282e-07 | 0.0004981 |
| 5 | POSITIVE REGULATION OF CATALYTIC ACTIVITY | 77 | 1518 | 1.246e-06 | 0.0008282 |
| 6 | MOVEMENT OF CELL OR SUBCELLULAR COMPONENT | 68 | 1275 | 9.951e-07 | 0.0008282 |
| 7 | RESPONSE TO CYTOKINE | 45 | 714 | 1.116e-06 | 0.0008282 |
| 8 | RESPONSE TO OXYGEN CONTAINING COMPOUND | 71 | 1381 | 2.114e-06 | 0.001229 |
| 9 | CYTOKINE MEDIATED SIGNALING PATHWAY | 32 | 452 | 3.94e-06 | 0.001634 |
| 10 | REGULATION OF INTRACELLULAR SIGNAL TRANSDUCTION | 80 | 1656 | 4.894e-06 | 0.001634 |
| 11 | DEFENSE RESPONSE | 64 | 1231 | 4.916e-06 | 0.001634 |
| 12 | INTRACELLULAR SIGNAL TRANSDUCTION | 77 | 1572 | 4.577e-06 | 0.001634 |
| 13 | REGULATION OF IMMUNE SYSTEM PROCESS | 71 | 1403 | 3.684e-06 | 0.001634 |
| 14 | REGULATION OF ANATOMICAL STRUCTURE MORPHOGENESIS | 56 | 1021 | 4.234e-06 | 0.001634 |
| 15 | ACTIN FILAMENT BASED PROCESS | 31 | 450 | 9.627e-06 | 0.002986 |
| 16 | ANTIGEN PROCESSING AND PRESENTATION | 19 | 213 | 1.643e-05 | 0.004498 |
| 17 | RESPONSE TO PROTOZOAN | 6 | 20 | 1.635e-05 | 0.004498 |
| 18 | REGULATION OF HYDROLASE ACTIVITY | 65 | 1327 | 2.72e-05 | 0.005274 |
| 19 | REGULATION OF IMMUNE RESPONSE | 47 | 858 | 2.663e-05 | 0.005274 |
| 20 | POSITIVE REGULATION OF HYDROLASE ACTIVITY | 49 | 905 | 2.417e-05 | 0.005274 |
| 21 | LYMPHOCYTE ACTIVATION | 25 | 342 | 2.627e-05 | 0.005274 |
| 22 | LOCOMOTION | 57 | 1114 | 2.639e-05 | 0.005274 |
| 23 | CELLULAR RESPONSE TO CYTOKINE STIMULUS | 37 | 606 | 2.049e-05 | 0.005274 |
| 24 | BIOLOGICAL ADHESION | 54 | 1032 | 2.372e-05 | 0.005274 |
| 25 | CENTRAL NERVOUS SYSTEM PROJECTION NEURON AXONOGENESIS | 6 | 22 | 2.995e-05 | 0.005574 |
| 26 | LEUKOCYTE ACTIVATION | 28 | 414 | 3.585e-05 | 0.005892 |
| 27 | POSITIVE REGULATION OF CELL COMMUNICATION | 72 | 1532 | 3.792e-05 | 0.005892 |
| 28 | SINGLE ORGANISM CELL ADHESION | 30 | 459 | 3.606e-05 | 0.005892 |
| 29 | INTERFERON GAMMA MEDIATED SIGNALING PATHWAY | 10 | 70 | 3.374e-05 | 0.005892 |
| 30 | REGULATION OF CELLULAR COMPONENT MOVEMENT | 43 | 771 | 3.895e-05 | 0.005892 |
| 31 | REGULATION OF GTPASE ACTIVITY | 39 | 673 | 3.925e-05 | 0.005892 |
| 32 | REGULATION OF CALCIUM ION TRANSPORT | 18 | 209 | 4.346e-05 | 0.00632 |
| 33 | IMMUNE SYSTEM DEVELOPMENT | 35 | 582 | 4.66e-05 | 0.00657 |
| 34 | HOMEOSTATIC PROCESS | 64 | 1337 | 6.227e-05 | 0.007935 |
| 35 | CELL ACTIVATION | 34 | 568 | 6.537e-05 | 0.007935 |
| 36 | ANTIGEN PROCESSING AND PRESENTATION OF PEPTIDE ANTIGEN | 16 | 177 | 6.422e-05 | 0.007935 |
| 37 | RESPONSE TO ENDOGENOUS STIMULUS | 68 | 1450 | 6.768e-05 | 0.007935 |
| 38 | IMMUNE RESPONSE | 55 | 1100 | 6.822e-05 | 0.007935 |
| 39 | CARDIOVASCULAR SYSTEM DEVELOPMENT | 43 | 788 | 6.425e-05 | 0.007935 |
| 40 | CIRCULATORY SYSTEM DEVELOPMENT | 43 | 788 | 6.425e-05 | 0.007935 |
| 41 | RESPONSE TO INTERFERON GAMMA | 14 | 144 | 8.33e-05 | 0.009229 |
| 42 | REGULATION OF PROTEIN MODIFICATION PROCESS | 77 | 1710 | 8.27e-05 | 0.009229 |
| Num | GO | Overlap | Size | P Value | Adj. P Value |
|---|---|---|---|---|---|
| 1 | MOLECULAR FUNCTION REGULATOR | 71 | 1353 | 1.013e-06 | 0.0009413 |
| 2 | ENZYME BINDING | 84 | 1737 | 2.63e-06 | 0.001221 |
| 3 | ACTIN BINDING | 28 | 393 | 1.403e-05 | 0.004346 |
| 4 | CYTOSKELETAL PROTEIN BINDING | 45 | 819 | 3.685e-05 | 0.008558 |
| 5 | CYTOKINE RECEPTOR ACTIVITY | 11 | 89 | 5.48e-05 | 0.009105 |
| 6 | GTPASE BINDING | 22 | 295 | 5.88e-05 | 0.009105 |
| Num | GO | Overlap | Size | P Value | Adj. P Value |
|---|---|---|---|---|---|
| 1 | PLASMA MEMBRANE PROTEIN COMPLEX | 36 | 510 | 1.051e-06 | 0.000614 |
| 2 | CELL SURFACE | 46 | 757 | 2.28e-06 | 0.0006659 |
| 3 | INTRINSIC COMPONENT OF PLASMA MEMBRANE | 77 | 1649 | 2.473e-05 | 0.004814 |
| 4 | SIDE OF MEMBRANE | 28 | 428 | 6.416e-05 | 0.009367 |
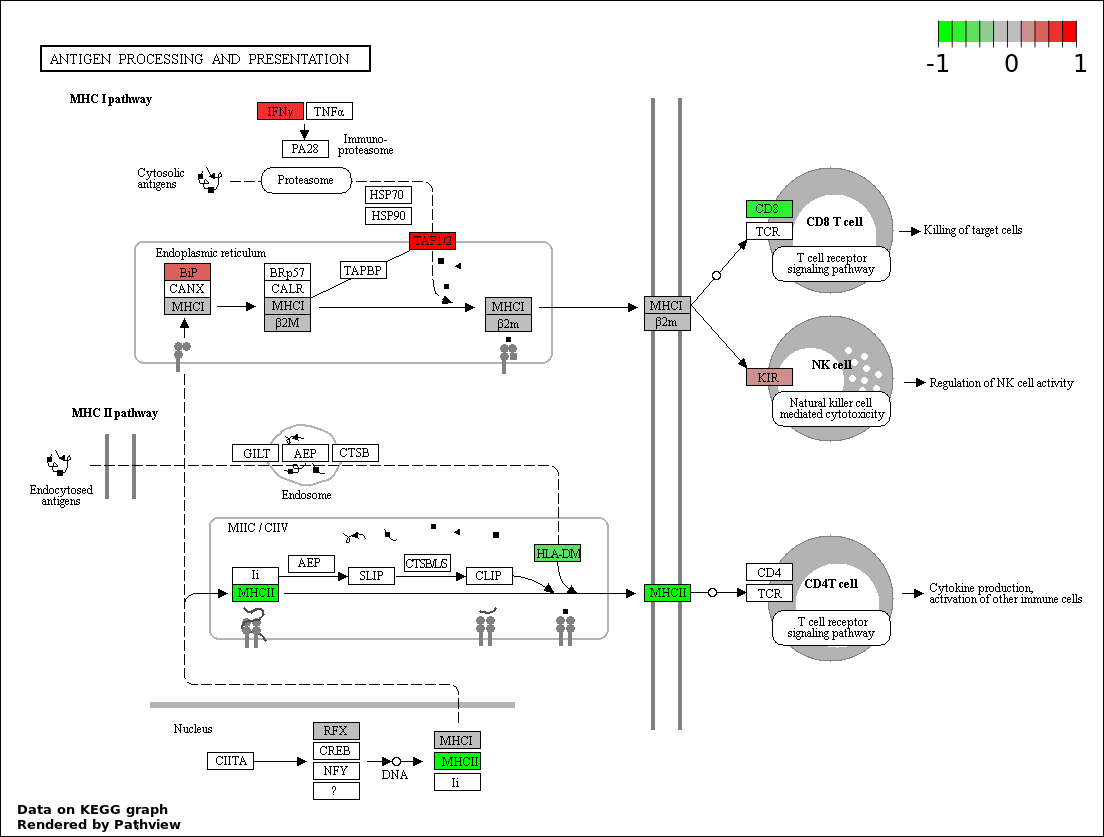
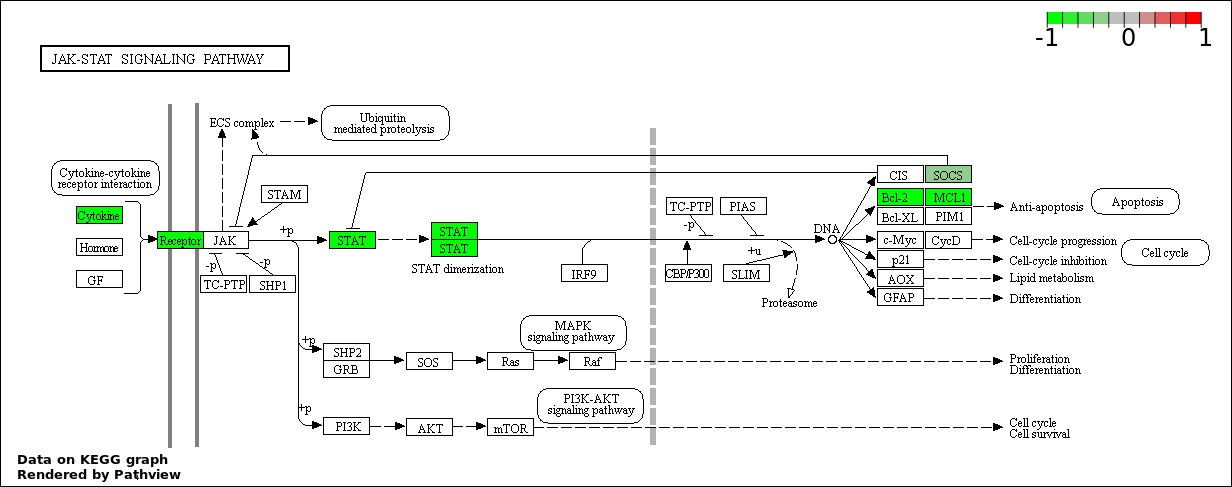
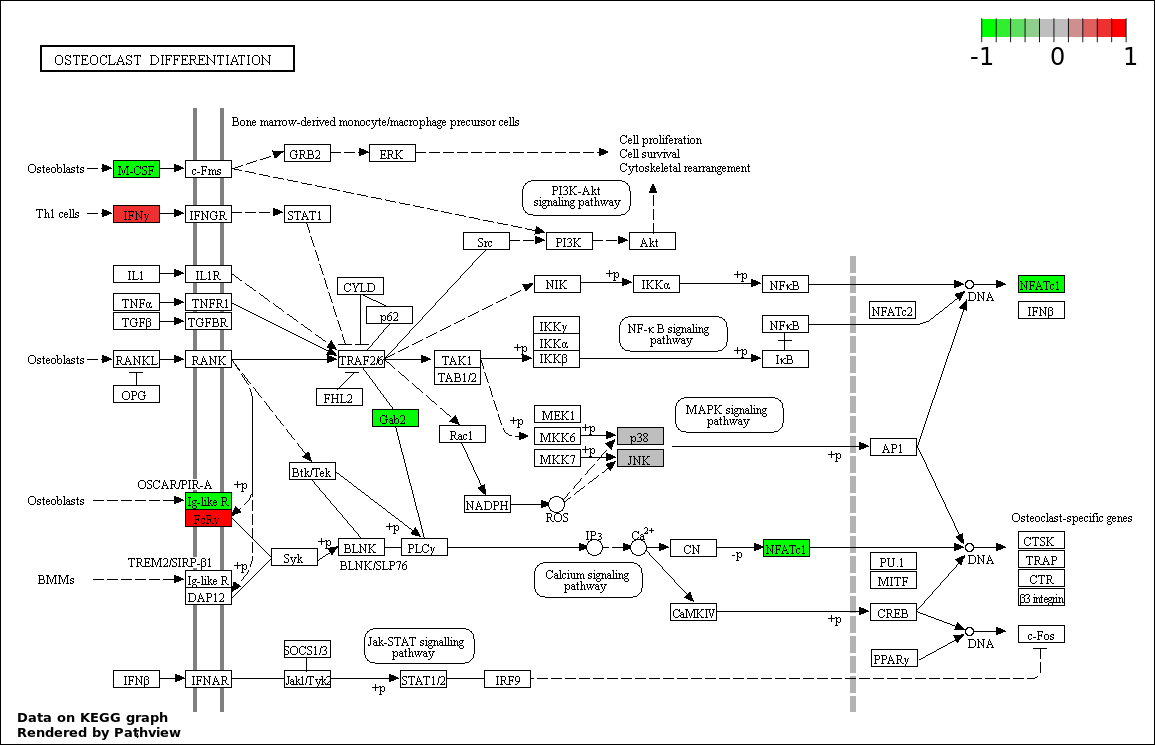
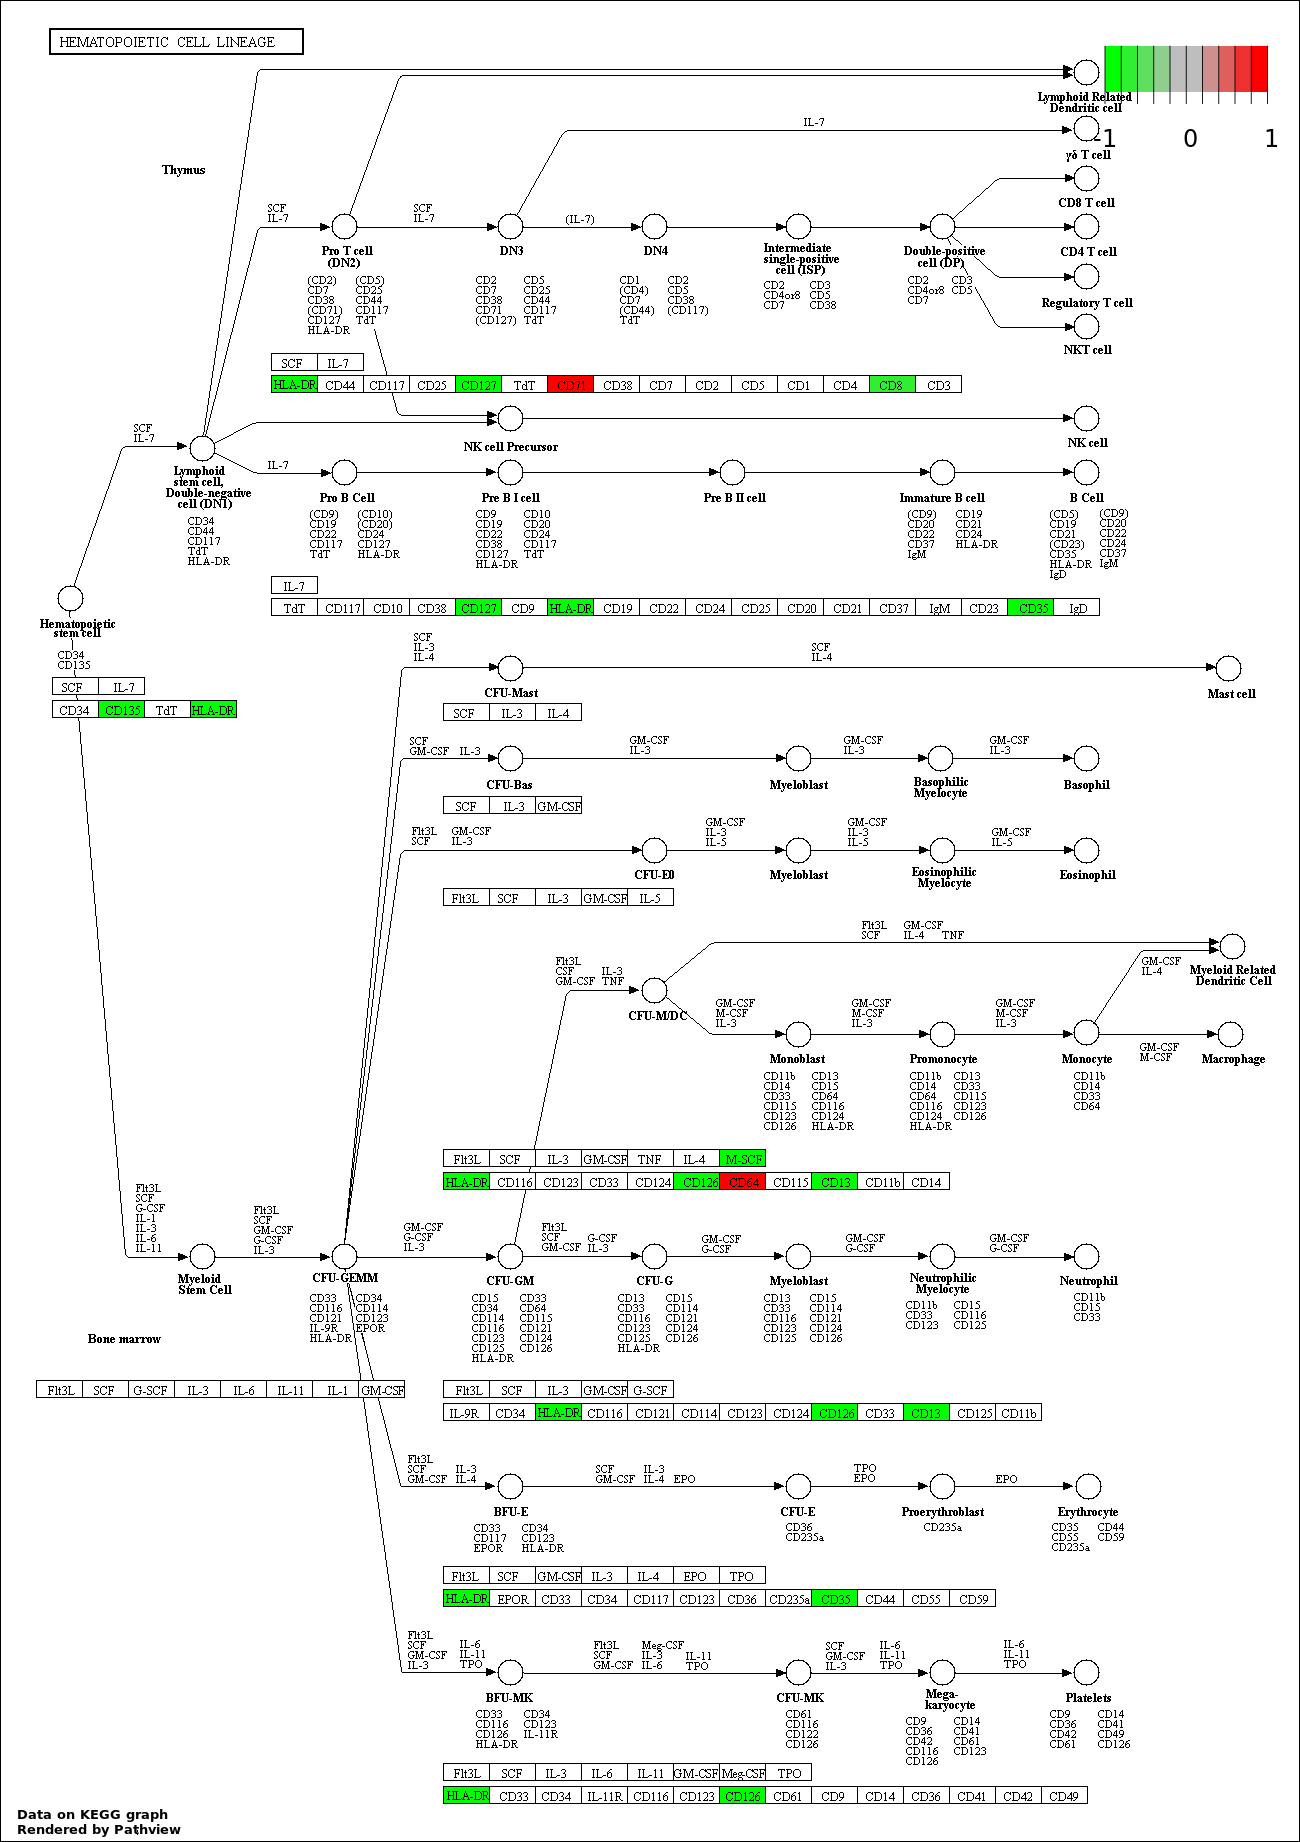
Over-represented Pathway
| Num | Pathway | Pathview | Overlap | Size | P Value | Adj. P Value |
|---|---|---|---|---|---|---|
| 1 | hsa04612_Antigen_processing_and_presentation | 11 | 78 | 1.558e-05 | 0.002804 | |
| 2 | hsa04630_Jak.STAT_signaling_pathway | 14 | 155 | 0.0001829 | 0.01646 | |
| 3 | hsa04380_Osteoclast_differentiation | 12 | 128 | 0.0003694 | 0.02216 | |
| 4 | hsa04640_Hematopoietic_cell_lineage | 9 | 88 | 0.001055 | 0.04747 | |
| 5 | hsa04510_Focal_adhesion | 14 | 200 | 0.002271 | 0.08175 | |
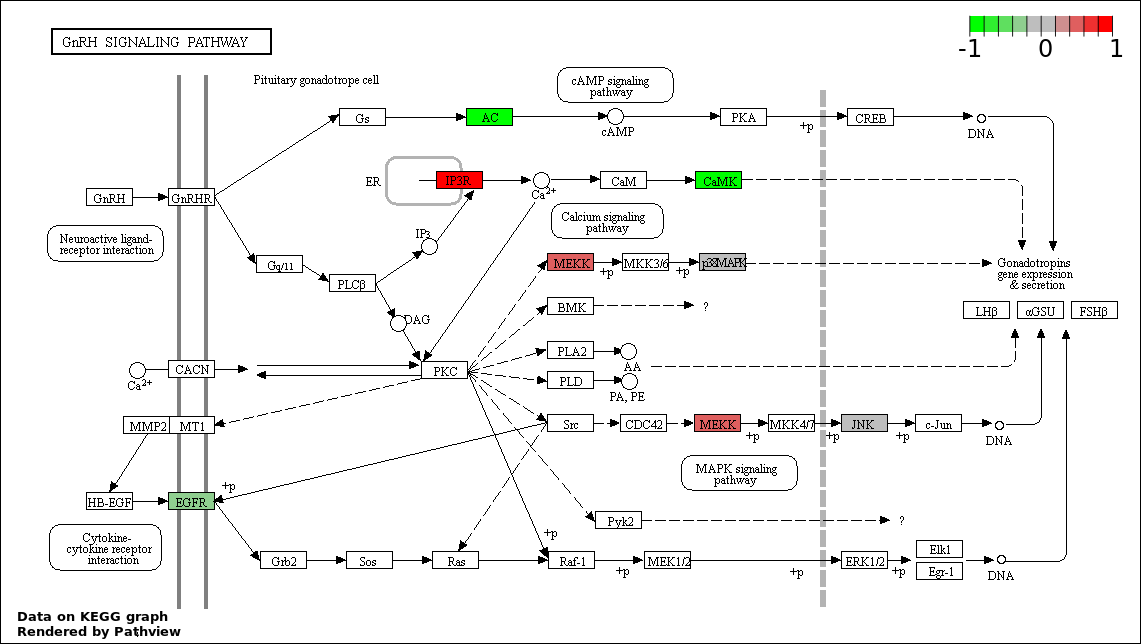
| 6 | hsa04912_GnRH_signaling_pathway | 9 | 101 | 0.002766 | 0.08297 | |
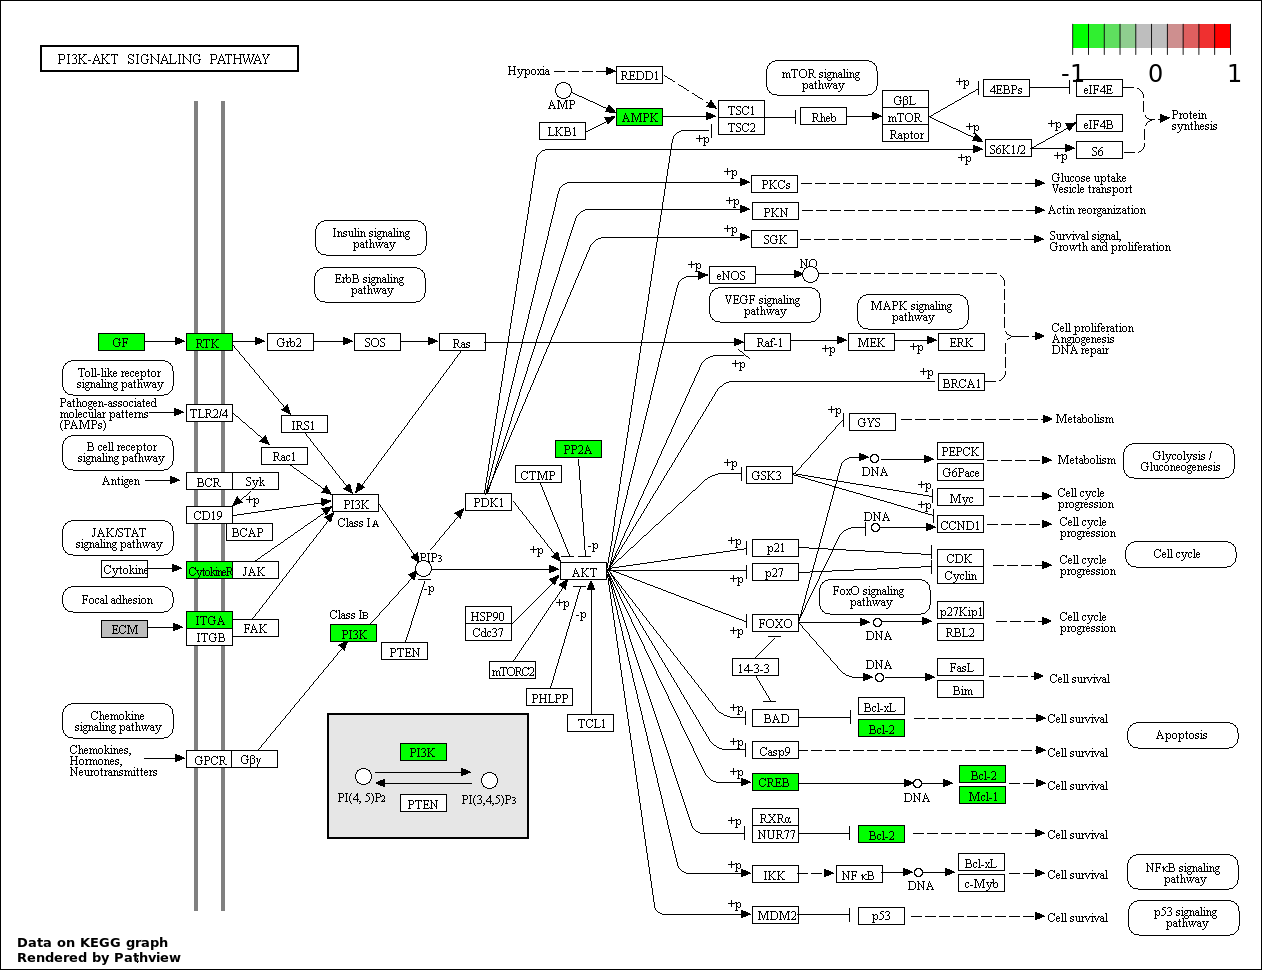
| 7 | hsa04151_PI3K_AKT_signaling_pathway | 20 | 351 | 0.003537 | 0.09096 | |
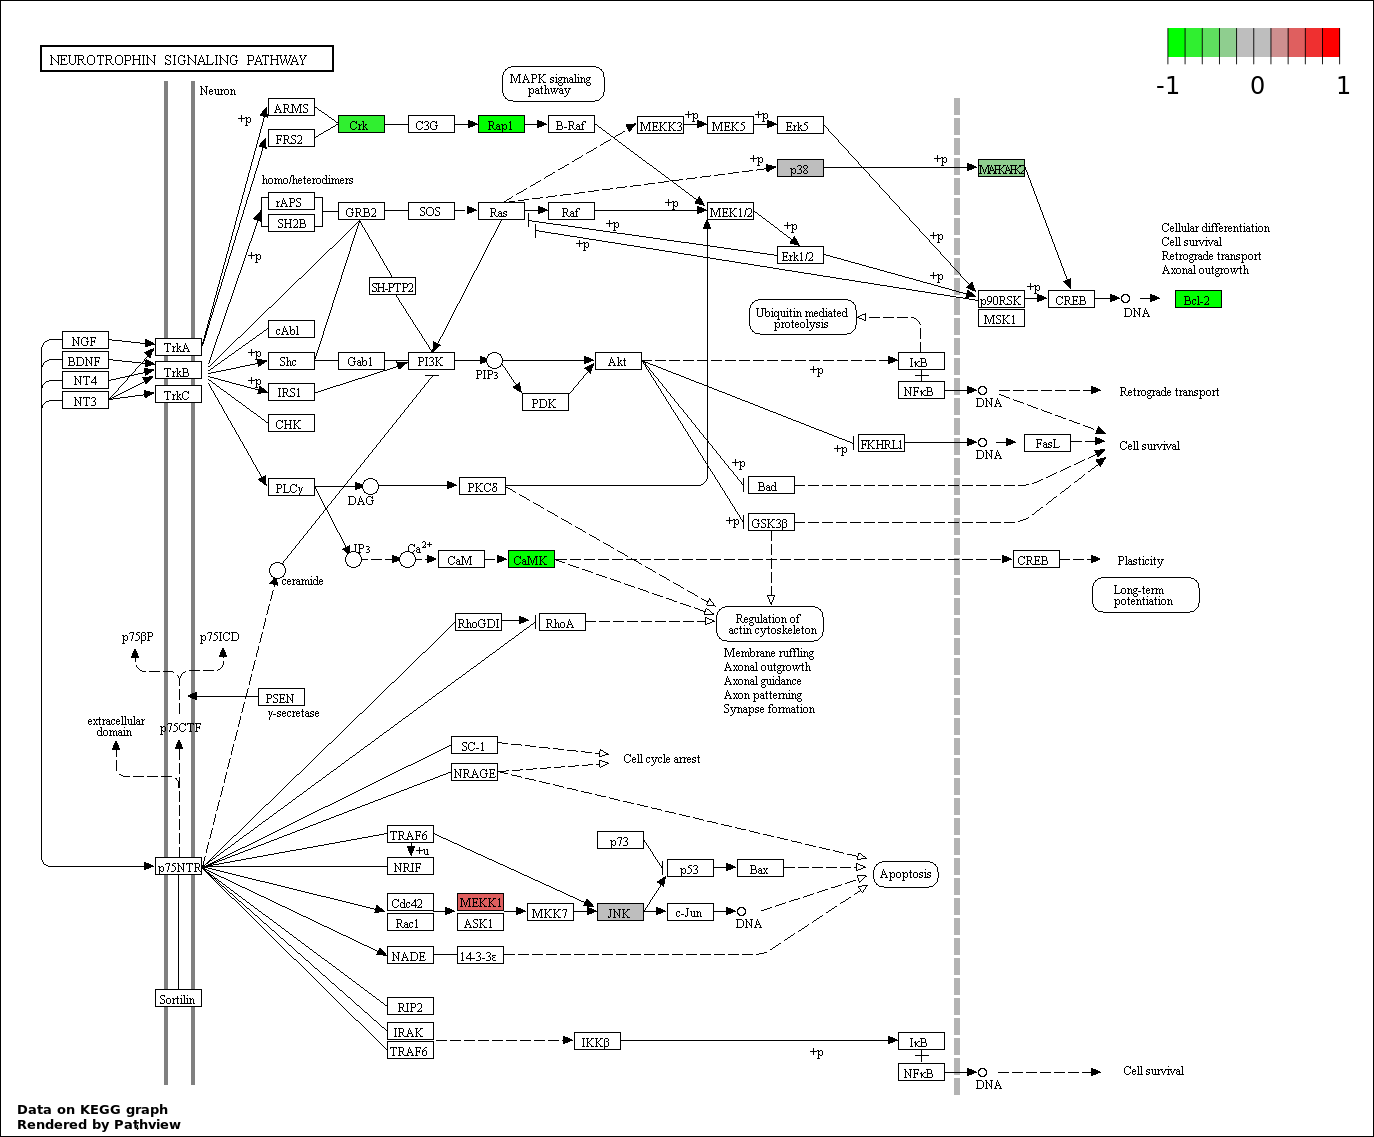
| 8 | hsa04722_Neurotrophin_signaling_pathway | 10 | 127 | 0.004068 | 0.09154 | |
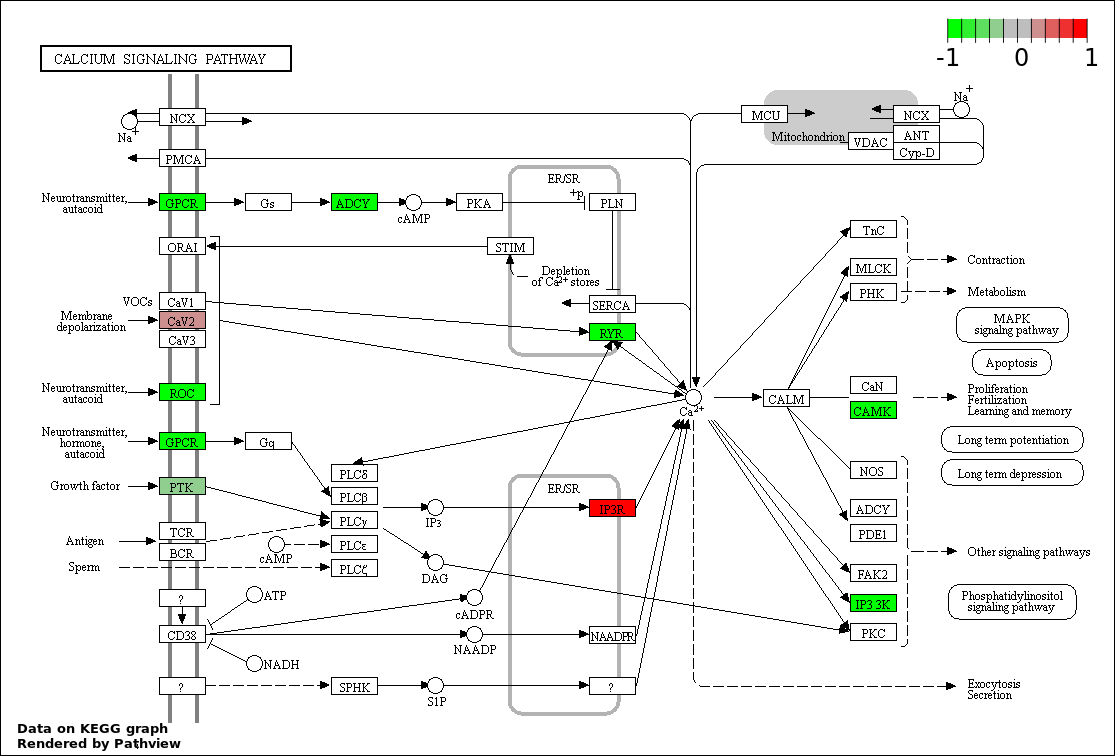
| 9 | hsa04020_Calcium_signaling_pathway | 12 | 177 | 0.005843 | 0.1169 | |
| 10 | hsa04514_Cell_adhesion_molecules_.CAMs. | 10 | 136 | 0.006566 | 0.1182 | |
| 11 | hsa04614_Renin.angiotensin_system | 3 | 17 | 0.01235 | 0.1864 | |
| 12 | hsa04010_MAPK_signaling_pathway | 15 | 268 | 0.01243 | 0.1864 | |
| 13 | hsa04012_ErbB_signaling_pathway | 7 | 87 | 0.01354 | 0.1875 | |
| 14 | hsa04145_Phagosome | 10 | 156 | 0.01625 | 0.209 | |
| 15 | hsa04370_VEGF_signaling_pathway | 6 | 76 | 0.02343 | 0.2565 | |
| 16 | hsa00562_Inositol_phosphate_metabolism | 5 | 57 | 0.02497 | 0.2565 | |
| 17 | hsa00240_Pyrimidine_metabolism | 7 | 99 | 0.02571 | 0.2565 | |
| 18 | hsa04664_Fc_epsilon_RI_signaling_pathway | 6 | 79 | 0.02772 | 0.2565 | |
| 19 | hsa04972_Pancreatic_secretion | 7 | 101 | 0.02829 | 0.2565 | |
| 20 | hsa04621_NOD.like_receptor_signaling_pathway | 5 | 59 | 0.0285 | 0.2565 | |
| 21 | hsa04310_Wnt_signaling_pathway | 9 | 151 | 0.03305 | 0.2833 | |
| 22 | hsa04512_ECM.receptor_interaction | 6 | 85 | 0.03779 | 0.303 | |
| 23 | hsa00280_Valine._leucine_and_isoleucine_degradation | 4 | 44 | 0.03872 | 0.303 | |
| 24 | hsa04914_Progesterone.mediated_oocyte_maturation | 6 | 87 | 0.0416 | 0.312 | |
| 25 | hsa04014_Ras_signaling_pathway | 12 | 236 | 0.04454 | 0.3207 | |
| 26 | hsa04114_Oocyte_meiosis | 7 | 114 | 0.04934 | 0.3379 | |
| 27 | hsa04610_Complement_and_coagulation_cascades | 5 | 69 | 0.05069 | 0.3379 | |
| 28 | hsa04672_Intestinal_immune_network_for_IgA_production | 4 | 49 | 0.05404 | 0.3474 | |
| 29 | hsa04971_Gastric_acid_secretion | 5 | 74 | 0.06473 | 0.4018 | |
| 30 | hsa04070_Phosphatidylinositol_signaling_system | 5 | 78 | 0.07738 | 0.4515 | |
| 31 | hsa00770_Pantothenate_and_CoA_biosynthesis | 2 | 16 | 0.07776 | 0.4515 | |
| 32 | hsa00450_Selenocompound_metabolism | 2 | 17 | 0.08648 | 0.4864 | |
| 33 | hsa04660_T_cell_receptor_signaling_pathway | 6 | 108 | 0.09599 | 0.5135 | |
| 34 | hsa04810_Regulation_of_actin_cytoskeleton | 10 | 214 | 0.09699 | 0.5135 | |
| 35 | hsa00230_Purine_metabolism | 8 | 162 | 0.102 | 0.5151 | |
| 36 | hsa00100_Steroid_biosynthesis | 2 | 19 | 0.1047 | 0.5151 | |
| 37 | hsa04910_Insulin_signaling_pathway | 7 | 138 | 0.1092 | 0.5151 | |
| 38 | hsa00620_Pyruvate_metabolism | 3 | 40 | 0.1104 | 0.5151 | |
| 39 | hsa04210_Apoptosis | 5 | 89 | 0.1184 | 0.5197 | |
| 40 | hsa04970_Salivary_secretion | 5 | 89 | 0.1184 | 0.5197 | |
| 41 | hsa04270_Vascular_smooth_muscle_contraction | 6 | 116 | 0.1235 | 0.5293 | |
| 42 | hsa04670_Leukocyte_transendothelial_migration | 6 | 117 | 0.1272 | 0.5324 | |
| 43 | hsa04962_Vasopressin.regulated_water_reabsorption | 3 | 44 | 0.1363 | 0.5393 | |
| 44 | hsa04920_Adipocytokine_signaling_pathway | 4 | 68 | 0.1366 | 0.5393 | |
| 45 | hsa04144_Endocytosis | 9 | 203 | 0.1402 | 0.5393 | |
| 46 | hsa03050_Proteasome | 3 | 45 | 0.143 | 0.5393 | |
| 47 | hsa00910_Nitrogen_metabolism | 2 | 23 | 0.1438 | 0.5393 | |
| 48 | hsa04720_Long.term_potentiation | 4 | 70 | 0.1473 | 0.5411 | |
| 49 | hsa04622_RIG.I.like_receptor_signaling_pathway | 4 | 71 | 0.1527 | 0.5499 | |
| 50 | hsa04320_Dorso.ventral_axis_formation | 2 | 25 | 0.1643 | 0.58 | |
| 51 | hsa00601_Glycosphingolipid_biosynthesis_._lacto_and_neolacto_series | 2 | 26 | 0.1748 | 0.602 | |
| 52 | hsa04620_Toll.like_receptor_signaling_pathway | 5 | 102 | 0.1773 | 0.602 | |
| 53 | hsa04062_Chemokine_signaling_pathway | 8 | 189 | 0.188 | 0.6207 | |
| 54 | hsa00983_Drug_metabolism_._other_enzymes | 3 | 52 | 0.1931 | 0.6207 | |
| 55 | hsa04742_Taste_transduction | 3 | 52 | 0.1931 | 0.6207 | |
| 56 | hsa04650_Natural_killer_cell_mediated_cytotoxicity | 6 | 136 | 0.2064 | 0.6517 | |
| 57 | hsa04974_Protein_digestion_and_absorption | 4 | 81 | 0.2109 | 0.6546 | |
| 58 | hsa00020_Citrate_cycle_.TCA_cycle. | 2 | 30 | 0.2174 | 0.6597 | |
| 59 | hsa04141_Protein_processing_in_endoplasmic_reticulum | 7 | 168 | 0.2199 | 0.6597 | |
| 60 | hsa00250_Alanine._aspartate_and_glutamate_metabolism | 2 | 32 | 0.2391 | 0.6725 | |
| 61 | hsa00260_Glycine._serine_and_threonine_metabolism | 2 | 32 | 0.2391 | 0.6725 | |
| 62 | hsa00640_Propanoate_metabolism | 2 | 32 | 0.2391 | 0.6725 | |
| 63 | hsa04140_Regulation_of_autophagy | 2 | 34 | 0.2609 | 0.7224 | |
| 64 | hsa00565_Ether_lipid_metabolism | 2 | 36 | 0.2827 | 0.7482 | |
| 65 | hsa00010_Glycolysis_._Gluconeogenesis | 3 | 65 | 0.2944 | 0.7679 | |
| 66 | hsa04666_Fc_gamma_R.mediated_phagocytosis | 4 | 95 | 0.3003 | 0.7722 | |
| 67 | hsa04730_Long.term_depression | 3 | 70 | 0.3344 | 0.838 | |
| 68 | hsa00380_Tryptophan_metabolism | 2 | 42 | 0.3474 | 0.838 | |
| 69 | hsa00071_Fatty_acid_metabolism | 2 | 43 | 0.358 | 0.838 | |
| 70 | hsa04520_Adherens_junction | 3 | 73 | 0.3585 | 0.838 | |
| 71 | hsa04662_B_cell_receptor_signaling_pathway | 3 | 75 | 0.3744 | 0.864 | |
| 72 | hsa00514_Other_types_of_O.glycan_biosynthesis | 2 | 46 | 0.3895 | 0.8874 | |
| 73 | hsa04330_Notch_signaling_pathway | 2 | 47 | 0.3998 | 0.8885 | |
| 74 | hsa00510_N.Glycan_biosynthesis | 2 | 49 | 0.4202 | 0.9005 | |
| 75 | hsa00480_Glutathione_metabolism | 2 | 50 | 0.4303 | 0.9007 | |
| 76 | hsa00561_Glycerolipid_metabolism | 2 | 50 | 0.4303 | 0.9007 | |
| 77 | hsa03015_mRNA_surveillance_pathway | 3 | 83 | 0.4372 | 0.9045 | |
| 78 | hsa04150_mTOR_signaling_pathway | 2 | 52 | 0.4502 | 0.9051 | |
| 79 | hsa04350_TGF.beta_signaling_pathway | 3 | 85 | 0.4525 | 0.9051 | |
| 80 | hsa04390_Hippo_signaling_pathway | 5 | 154 | 0.4675 | 0.9248 | |
| 81 | hsa04540_Gap_junction | 3 | 90 | 0.4901 | 0.9258 | |
| 82 | hsa04360_Axon_guidance | 4 | 130 | 0.5273 | 0.9631 | |
| 83 | hsa00970_Aminoacyl.tRNA_biosynthesis | 2 | 63 | 0.5519 | 0.9631 | |
| 84 | hsa04916_Melanogenesis | 3 | 101 | 0.5679 | 0.9631 | |
| 85 | hsa04120_Ubiquitin_mediated_proteolysis | 4 | 139 | 0.5803 | 0.9631 | |
| 86 | hsa04115_p53_signaling_pathway | 2 | 69 | 0.6015 | 0.9755 | |
| 87 | hsa04976_Bile_secretion | 2 | 71 | 0.6171 | 0.9918 | |
| 88 | hsa00982_Drug_metabolism_._cytochrome_P450 | 2 | 73 | 0.6323 | 0.9985 | |
| 89 | hsa04260_Cardiac_muscle_contraction | 2 | 77 | 0.6611 | 0.9985 | |
| 90 | hsa00564_Glycerophospholipid_metabolism | 2 | 80 | 0.6815 | 1 | |
| 91 | hsa04142_Lysosome | 3 | 121 | 0.6891 | 1 | |
| 92 | hsa04110_Cell_cycle | 3 | 128 | 0.725 | 1 | |
| 93 | hsa03013_RNA_transport | 3 | 152 | 0.8237 | 1 |