This regulatory network was inferred from the input dataset. The miRNAs and mRNAs are
presented as round and rectangle nodes respectively. The numerical value popped up upon mouse over the gene node is the log2 transformed fold-change of the gene expression between the two groups. All of the nodes are clickable, and the detailed information of the miRNAs/mRNAs and related cancer pathway will be displayed in another window. The edges between nodes are supported by both interactions (predicted or experimentally verified) and correlations learnt from cancer dataset. The numerical value popped up upon mouse over the edge is the correlation beat value (effect size) between the two nodes. The experimental evidences of the edges reported in previous cancer studies are highlighted by red/orange color. All of these information can be accessed by the "mouse-over" action. This network shows a full map of the miRNA-mRNA regulation of the input gene list(s), and the hub miRNAs (with the high network degree/betweenness centrality) would be the potential cancer drivers or tumor suppressors. The full result table can be accessed in the "Regulations" tab.
"miRNACancerMAP" is also a network visualization tool for users to draw their regulatory network by personal customization. Users can set the complexity of the network by limiting the number of nodes or edges. And the color of the nodes can be defined by different categories of the mRNAs and miRNAs, such as Gene-Ontology, pathway, and expression status. Users can also select to use network degree or network betweenness centrality to define the node size. And edges can be black or colored by the correlation. Purple edge means negative correlation (mostly found between miRNA and mRNA), and blue edge means positive correlation (found in PPI or miRNA-miRNA sponge effect). We can also add the protein-protein interactions (PPI) into the network. This result will show the cluster of genes regulated by some specific miRNAs. Additionally, miRNA-miRNA edges can be added by the "miRNA sponge" button, presenting some clusters of miRNAs that have the interactions via sponge effect.
miRNA-gene regulations
| Num | microRNA | Gene | miRNA log2FC | miRNA pvalue | Gene log2FC | Gene pvalue | Interaction | Correlation beta | Correlation P-value | PMID | Reported in cancer studies |
|---|---|---|---|---|---|---|---|---|---|---|---|
| 1 | hsa-miR-224-5p | ABCC5 | -2.66 | 0 | 0.67 | 0.21962 | mirMAP | -0.12 | 0 | NA | |
| 2 | hsa-miR-224-5p | ABHD2 | -2.66 | 0 | 1.06 | 0.12031 | mirMAP | -0.14 | 0 | NA | |
| 3 | hsa-miR-452-5p | ABHD2 | -2.02 | 0.00026 | 1.06 | 0.12031 | mirMAP | -0.22 | 0 | NA | |
| 4 | hsa-miR-18a-5p | ABR | -2.3 | 0 | 0.31 | 0.60278 | miRNAWalker2 validate; mirMAP | -0.11 | 0 | NA | |
| 5 | hsa-miR-224-5p | ACSS1 | -2.66 | 0 | 0.51 | 0.33926 | MirTarget | -0.16 | 0 | NA | |
| 6 | hsa-miR-452-5p | ACSS1 | -2.02 | 0.00026 | 0.51 | 0.33926 | MirTarget | -0.16 | 0 | NA | |
| 7 | hsa-miR-18a-5p | ADAMTS2 | -2.3 | 0 | 0.29 | 0.51167 | mirMAP | -0.15 | 0 | NA | |
| 8 | hsa-miR-224-5p | AFF3 | -2.66 | 0 | 4 | 0 | MirTarget | -0.49 | 0 | NA | |
| 9 | hsa-miR-18a-5p | AFF4 | -2.3 | 0 | 0.7 | 0.2756 | miRNAWalker2 validate | -0.22 | 0 | NA | |
| 10 | hsa-miR-224-5p | AGBL4 | -2.66 | 0 | 1.65 | 0 | mirMAP | -0.2 | 0 | NA | |
| 11 | hsa-miR-18a-5p | ALCAM | -2.3 | 0 | 1.44 | 0.0323 | MirTarget; miRNATAP | -0.34 | 0 | NA | |
| 12 | hsa-miR-224-5p | AMN1 | -2.66 | 0 | 0.48 | 0.12341 | MirTarget | -0.11 | 0 | NA | |
| 13 | hsa-miR-224-5p | AMZ1 | -2.66 | 0 | 1.47 | 0 | mirMAP | -0.23 | 0 | NA | |
| 14 | hsa-miR-18a-5p | ANKRD50 | -2.3 | 0 | 0.73 | 0.17675 | MirTarget; miRNATAP | -0.18 | 0 | NA | |
| 15 | hsa-miR-452-5p | ANKS1B | -2.02 | 0.00026 | 1.36 | 0 | miRNATAP | -0.29 | 0 | NA | |
| 16 | hsa-miR-18a-5p | APOLD1 | -2.3 | 0 | 0.38 | 0.4521 | mirMAP | -0.16 | 0 | NA | |
| 17 | hsa-miR-18a-5p | ARFGEF2 | -2.3 | 0 | 0.4 | 0.50575 | MirTarget | -0.12 | 0 | NA | |
| 18 | hsa-miR-18a-5p | ARHGAP5 | -2.3 | 0 | 0.05 | 0.93513 | MirTarget | -0.12 | 0 | NA | |
| 19 | hsa-miR-452-5p | ARID2 | -2.02 | 0.00026 | 0.69 | 0.16232 | MirTarget | -0.14 | 0 | NA | |
| 20 | hsa-miR-18a-5p | ARL15 | -2.3 | 0 | 0.82 | 0.02217 | MirTarget; miRNATAP | -0.26 | 0 | NA | |
| 21 | hsa-miR-224-5p | ARMCX2 | -2.66 | 0 | 0.5 | 0.33207 | MirTarget | -0.11 | 0 | NA | |
| 22 | hsa-miR-452-5p | ASAH1 | -2.02 | 0.00026 | 1 | 0.17531 | MirTarget | -0.1 | 0 | NA | |
| 23 | hsa-miR-18a-5p | ASTN1 | -2.3 | 0 | -0.11 | 0.73119 | MirTarget | -0.25 | 0 | NA | |
| 24 | hsa-miR-18a-5p | ASXL2 | -2.3 | 0 | 0.04 | 0.92196 | miRNATAP | -0.17 | 0 | NA | |
| 25 | hsa-miR-18a-5p | ATF7 | -2.3 | 0 | 0.31 | 0.57742 | mirMAP | -0.14 | 0 | NA | |
| 26 | hsa-miR-18a-5p | ATM | -2.3 | 0 | 0.05 | 0.92324 | miRNAWalker2 validate; miRTarBase; MirTarget | -0.12 | 0 | 23857602; 23437304; 25963391; 23229340 | Furthermore we used antisense oligonucleotides against micro RNAs miRNA or miRNA overexpression plasmids to study the role of miR-18a and -106a on ATM expression; Furthermore we identified that ERα activates miR-18a and -106a to downregulate ATM expression; We reveal a novel mechanism involving ERα and miR-18a and -106a regulation of ATM in breast cancer;MicroRNA 18a attenuates DNA damage repair through suppressing the expression of ataxia telangiectasia mutated in colorectal cancer; Through in silico search the 3'UTR of Ataxia telangiectasia mutated ATM contains a conserved miR-18a binding site; Expression of ATM was down-regulated in CRC tumors p<0.0001 and inversely correlated with miR-18a expression r = -0.4562 p<0.01; This was further confirmed by the down-regulation of ATM protein by miR-18a; As ATM is a key enzyme in DNA damage repair we evaluated the effect of miR-18a on DNA double-strand breaks; miR-18a attenuates cellular repair of DNA double-strand breaks by directly suppressing ATM a key enzyme in DNA damage repair;However the upregulation of miR-18a suppressed the level of ataxia-telangiectasia mutated and attenuated DNA double-strand break repair after irradiation which re-sensitized the cervical cancer cells to radiotherapy by promoting apoptosis;MicroRNA 18a upregulates autophagy and ataxia telangiectasia mutated gene expression in HCT116 colon cancer cells; Previous studies showed that certain microRNAs including miR-18a potentially regulate ATM in cancer cells; However the mechanisms behind the modulation of ATM by miR-18a remain to be elucidated in colon cancer cells; In the present study we explored the impact of miR-18a on the autophagy process and ATM expression in HCT116 colon cancer cells; Western blotting and luciferase assays were implemented to explore the impact of miR-18a on ATM gene expression in HCT116 cells; Moreover miR-18a overexpression led to the upregulation of ATM expression and suppression of mTORC1 activity; Results of the present study pertaining to the role of miR-18a in regulating autophagy and ATM gene expression in colon cancer cells revealed a novel function for miR-18a in a critical cellular event and on a crucial gene with significant impacts in cancer development progression treatment and in other diseases |
| 27 | hsa-miR-18a-5p | ATP1B2 | -2.3 | 0 | 0.53 | 0.01045 | mirMAP | -0.23 | 0 | NA | |
| 28 | hsa-miR-18a-5p | ATP2B1 | -2.3 | 0 | 0.32 | 0.5434 | miRNATAP | -0.12 | 0 | NA | |
| 29 | hsa-miR-18a-5p | ATP2C2 | -2.3 | 0 | 0.99 | 0.0117 | MirTarget | -0.2 | 0 | NA | |
| 30 | hsa-miR-18a-5p | ATXN1 | -2.3 | 0 | 0.48 | 0.35126 | MirTarget; miRNATAP | -0.16 | 0 | NA | |
| 31 | hsa-miR-18a-5p | BBX | -2.3 | 0 | 0.06 | 0.91654 | MirTarget; miRNATAP | -0.11 | 0 | NA | |
| 32 | hsa-miR-452-5p | BCAS1 | -2.02 | 0.00026 | 4.85 | 0 | mirMAP | -0.65 | 0 | NA | |
| 33 | hsa-miR-224-5p | BCL2 | -2.66 | 0 | 1.88 | 0.00098 | mirMAP | -0.24 | 0 | 24796455 | In addition the expressions of Bcl2 mRNA and protein were 1.05 ± 0.04 and 0.21 ± 0.03 in the miR-224 ASO group significantly lower than that in the control group 4.87 ± 0.96 and 0.88 ± 0.09 P < 0.01 |
| 34 | hsa-miR-452-5p | BCL2 | -2.02 | 0.00026 | 1.88 | 0.00098 | mirMAP | -0.28 | 0 | NA | |
| 35 | hsa-miR-18a-5p | BHLHE22 | -2.3 | 0 | -0.39 | 0.0481 | MirTarget; miRNATAP | -0.1 | 0.00101 | NA | |
| 36 | hsa-miR-224-5p | BTRC | -2.66 | 0 | 0.93 | 0.05784 | MirTarget | -0.13 | 0 | NA | |
| 37 | hsa-miR-452-5p | BZW1 | -2.02 | 0.00026 | 0.47 | 0.51928 | MirTarget; miRNATAP | -0.11 | 0 | NA | |
| 38 | hsa-miR-18a-5p | C1orf21 | -2.3 | 0 | 1.31 | 0.03763 | mirMAP | -0.35 | 0 | NA | |
| 39 | hsa-miR-224-5p | C1orf21 | -2.66 | 0 | 1.31 | 0.03763 | mirMAP | -0.13 | 0 | NA | |
| 40 | hsa-miR-452-5p | C1orf21 | -2.02 | 0.00026 | 1.31 | 0.03763 | mirMAP | -0.13 | 0 | NA | |
| 41 | hsa-miR-18a-5p | C1orf226 | -2.3 | 0 | 0.84 | 0.08628 | mirMAP | -0.29 | 0 | NA | |
| 42 | hsa-miR-18a-5p | C5orf30 | -2.3 | 0 | 1.64 | 0.00035 | miRNATAP | -0.22 | 0 | NA | |
| 43 | hsa-miR-18a-5p | CA12 | -2.3 | 0 | 4.61 | 0 | miRNAWalker2 validate; MirTarget | -0.85 | 0 | NA | |
| 44 | hsa-miR-18a-5p | CACNG4 | -2.3 | 0 | 3.36 | 0 | mirMAP | -0.48 | 0 | NA | |
| 45 | hsa-miR-224-5p | CADM2 | -2.66 | 0 | 2.36 | 0 | mirMAP | -0.16 | 1.0E-5 | NA | |
| 46 | hsa-miR-452-5p | CADM2 | -2.02 | 0.00026 | 2.36 | 0 | MirTarget | -0.13 | 0.00422 | NA | |
| 47 | hsa-miR-18a-5p | CALN1 | -2.3 | 0 | 1.14 | 0.00178 | mirMAP | -0.42 | 0 | NA | |
| 48 | hsa-miR-18a-5p | CAMK2B | -2.3 | 0 | 1.56 | 0 | mirMAP | -0.27 | 0 | NA | |
| 49 | hsa-miR-18a-5p | CAMK2N1 | -2.3 | 0 | 1.69 | 0.00251 | miRNATAP | -0.3 | 0 | NA | |
| 50 | hsa-miR-452-5p | CASC1 | -2.02 | 0.00026 | 2.56 | 0 | MirTarget | -0.45 | 0 | NA | |
| 51 | hsa-miR-452-5p | CASD1 | -2.02 | 0.00026 | 0.96 | 0.05329 | MirTarget; miRNATAP | -0.16 | 0 | NA | |
| 52 | hsa-miR-18a-5p | CASZ1 | -2.3 | 0 | 0.88 | 0.0914 | mirMAP | -0.22 | 0 | NA | |
| 53 | hsa-miR-224-5p | CCNG2 | -2.66 | 0 | 1.09 | 0.07868 | mirMAP | -0.12 | 0 | NA | |
| 54 | hsa-miR-452-5p | CCNO | -2.02 | 0.00026 | 1.97 | 0 | MirTarget | -0.27 | 0 | NA | |
| 55 | hsa-miR-452-5p | CDH2 | -2.02 | 0.00026 | 0.03 | 0.91735 | miRNATAP | -0.14 | 4.0E-5 | NA | |
| 56 | hsa-miR-18a-5p | CDON | -2.3 | 0 | 0.93 | 0.03701 | mirMAP | -0.27 | 0 | NA | |
| 57 | hsa-miR-452-5p | CDON | -2.02 | 0.00026 | 0.93 | 0.03701 | mirMAP | -0.11 | 0 | NA | |
| 58 | hsa-miR-18a-5p | CLASP2 | -2.3 | 0 | 0.44 | 0.39581 | miRNATAP | -0.14 | 0 | NA | |
| 59 | hsa-miR-224-5p | COQ7 | -2.66 | 0 | 0.87 | 0.0466 | mirMAP | -0.11 | 0 | NA | |
| 60 | hsa-miR-18a-5p | CREBL2 | -2.3 | 0 | 0.55 | 0.34569 | miRNAWalker2 validate; MirTarget; miRNATAP | -0.19 | 0 | NA | |
| 61 | hsa-miR-18a-5p | CRIM1 | -2.3 | 0 | 0.31 | 0.6343 | MirTarget; miRNATAP | -0.27 | 0 | NA | |
| 62 | hsa-miR-452-5p | CSMD3 | -2.02 | 0.00026 | 1.2 | 0.03461 | MirTarget | -0.22 | 0 | NA | |
| 63 | hsa-miR-18a-5p | CSNK1G1 | -2.3 | 0 | 0.46 | 0.31306 | mirMAP | -0.11 | 0 | NA | |
| 64 | hsa-miR-18a-5p | CSRNP3 | -2.3 | 0 | 0.3 | 0.37119 | miRNAWalker2 validate; miRNATAP | -0.36 | 0 | NA | |
| 65 | hsa-miR-452-5p | CST1 | -2.02 | 0.00026 | 1.36 | 0.00826 | MirTarget | -0.67 | 0 | NA | |
| 66 | hsa-miR-452-5p | CST5 | -2.02 | 0.00026 | 3.37 | 0 | MirTarget | -0.75 | 0 | NA | |
| 67 | hsa-miR-18a-5p | CTDSPL | -2.3 | 0 | 0.41 | 0.46081 | miRNAWalker2 validate; MirTarget; miRNATAP | -0.16 | 0 | NA | |
| 68 | hsa-miR-18a-5p | CTGF | -2.3 | 0 | 0.22 | 0.78118 | miRNAWalker2 validate; miRTarBase; MirTarget; miRNATAP | -0.12 | 2.0E-5 | 23249750 | Targeting of TGFβ signature and its essential component CTGF by miR 18 correlates with improved survival in glioblastoma; Indeed microRNA-18a but not other miR-17∼92 members has a functional site in the CTGF 3' UTR and its forced reexpression sharply reduces CTGF protein and mRNA levels; The unexpected effects of miR-18a on CTGF transcription are mediated in part by direct targeting of Smad3 and ensuing weakening of TGFβ signaling |
| 69 | hsa-miR-224-5p | CXXC4 | -2.66 | 0 | 1.31 | 0 | MirTarget | -0.18 | 0 | NA | |
| 70 | hsa-miR-452-5p | CXXC4 | -2.02 | 0.00026 | 1.31 | 0 | miRNATAP | -0.23 | 0 | NA | |
| 71 | hsa-miR-18a-5p | CYP4F11 | -2.3 | 0 | 2.83 | 0 | MirTarget | -0.61 | 0 | NA | |
| 72 | hsa-miR-18a-5p | DAAM2 | -2.3 | 0 | 0.04 | 0.92488 | miRNAWalker2 validate | -0.13 | 0 | NA | |
| 73 | hsa-miR-452-5p | DACH1 | -2.02 | 0.00026 | 4.05 | 0 | mirMAP | -0.51 | 0 | NA | |
| 74 | hsa-miR-452-5p | DCTN4 | -2.02 | 0.00026 | 0.76 | 0.19771 | mirMAP | -0.12 | 0 | NA | |
| 75 | hsa-miR-18a-5p | DCUN1D3 | -2.3 | 0 | 0.21 | 0.50418 | miRNAWalker2 validate | -0.12 | 0 | NA | |
| 76 | hsa-miR-452-5p | DENND1B | -2.02 | 0.00026 | 0.37 | 0.19669 | mirMAP | -0.15 | 0 | NA | |
| 77 | hsa-miR-452-5p | DHX40 | -2.02 | 0.00026 | 0.61 | 0.27609 | MirTarget | -0.11 | 0 | NA | |
| 78 | hsa-miR-18a-5p | DICER1 | -2.3 | 0 | 0.3 | 0.60913 | miRNAWalker2 validate | -0.14 | 0 | 27338043; 21935572 | MiR 18a upregulation decreases Dicer expression and confers paclitaxel resistance in triple negative breast cancer; In this study we investigated the association among miR-18a dysregulation Dicer dysregulation and paclitaxel PTX resistance in TNBC cells; The influence of miR-18a overexpression on Dicer expression was measured by qRT-PCR and Western blot analysis; MiR-18a overexpression directly led to Dicer repression at mRNA and protein level; This study found that miR-18a is an important miRNA that suppresses Dicer expression and increases PTX resistance in TNBC cells;microRNA 18a a member of the oncogenic miR 17 92 cluster targets Dicer and suppresses cell proliferation in bladder cancer T24 cells; Furthermore ectopic expression of miR-18a in T24 cells down-regulated Dicer expression at both the mRNA and protein level while inhibition miR-18a by antisense oligonucleotides could enhance Dicer expression in T24 cells; Two binding sites of miR-18a were found in Dicer 3' untranslated region 3' UTR; In addition knockdown of Dicer expression by siRNA mimicked cell growth suppression induced by miR-18a in T24 cells; These results show that miR-18a functions as a tumor suppressor by targeting Dicer in bladder cancer T24 cells and revealed a noteworthy feedback loop which may be utilized by the miR-17-92 cluster to control miRNA output and prevent its overexpression |
| 79 | hsa-miR-224-5p | DIO1 | -2.66 | 0 | 3.83 | 0 | miRTarBase | -0.35 | 0 | NA | |
| 80 | hsa-miR-18a-5p | DNAJC16 | -2.3 | 0 | 0.57 | 0.21774 | MirTarget | -0.15 | 0 | NA | |
| 81 | hsa-miR-224-5p | DNMBP | -2.66 | 0 | 1.14 | 0.0157 | MirTarget | -0.13 | 0 | NA | |
| 82 | hsa-miR-18a-5p | DOCK4 | -2.3 | 0 | -0.07 | 0.86467 | MirTarget | -0.11 | 0 | NA | |
| 83 | hsa-miR-18a-5p | DPY19L3 | -2.3 | 0 | 0.54 | 0.15711 | MirTarget | -0.18 | 0 | NA | |
| 84 | hsa-miR-452-5p | DPY19L3 | -2.02 | 0.00026 | 0.54 | 0.15711 | mirMAP | -0.12 | 0 | NA | |
| 85 | hsa-miR-18a-5p | DST | -2.3 | 0 | -0.02 | 0.98236 | mirMAP | -0.25 | 0 | NA | |
| 86 | hsa-miR-452-5p | DUSP4 | -2.02 | 0.00026 | 1.65 | 0.00224 | mirMAP | -0.17 | 0 | NA | |
| 87 | hsa-miR-224-5p | EFR3B | -2.66 | 0 | 0.91 | 0.00161 | MirTarget | -0.17 | 0 | NA | |
| 88 | hsa-miR-452-5p | ELAVL2 | -2.02 | 0.00026 | -1.04 | 5.0E-5 | MirTarget; miRNATAP | -0.14 | 0.00012 | NA | |
| 89 | hsa-miR-452-5p | ELFN2 | -2.02 | 0.00026 | 1.36 | 5.0E-5 | miRNATAP | -0.1 | 0.01262 | NA | |
| 90 | hsa-miR-452-5p | ELOVL5 | -2.02 | 0.00026 | 1.45 | 0.05049 | MirTarget | -0.16 | 0 | NA | |
| 91 | hsa-miR-452-5p | ERBB4 | -2.02 | 0.00026 | 5.37 | 0 | mirMAP | -0.7 | 0 | NA | |
| 92 | hsa-miR-18a-5p | ESR1 | -2.3 | 0 | 6.15 | 0 | miRNAWalker2 validate; miRTarBase; miRNATAP | -1.14 | 0 | 19027010; 24975878 | MicroRNA 18a prevents estrogen receptor alpha expression promoting proliferation of hepatocellular carcinoma cells; The gene ESR1 which encodes the estrogen receptor-alpha ERalpha was identified as a target of miR-18a miR-18a can repress ERalpha translation by binding to its mRNA at the 3' untranslated region;Elevated p53 promotes the processing of miR 18a to decrease estrogen receptor α in female hepatocellular carcinoma; Our previous study identified that estrogen receptor alpha ERα protein is downregulated in 60% of female HCC cases via a miR-18a elevation mediated suppression of ERα translation |
| 93 | hsa-miR-18a-5p | F3 | -2.3 | 0 | 0.07 | 0.88241 | MirTarget | -0.22 | 0 | NA | |
| 94 | hsa-miR-18a-5p | FAIM2 | -2.3 | 0 | 1.17 | 0.0002 | mirMAP | -0.37 | 0 | NA | |
| 95 | hsa-miR-224-5p | FAM135B | -2.66 | 0 | 2.43 | 0 | MirTarget | -0.31 | 0 | NA | |
| 96 | hsa-miR-18a-5p | FAM166B | -2.3 | 0 | 0.21 | 0.42685 | MirTarget | -0.14 | 0.00112 | NA | |
| 97 | hsa-miR-18a-5p | FAM168A | -2.3 | 0 | 0.04 | 0.90735 | mirMAP | -0.12 | 0 | NA | |
| 98 | hsa-miR-224-5p | FAM177B | -2.66 | 0 | 1.4 | 0.00023 | MirTarget | -0.15 | 2.0E-5 | NA | |
| 99 | hsa-miR-18a-5p | FAM196A | -2.3 | 0 | 2.86 | 0 | MirTarget | -0.56 | 0 | NA | |
| 100 | hsa-miR-452-5p | FAM196A | -2.02 | 0.00026 | 2.86 | 0 | mirMAP | -0.61 | 0 | NA | |
| 101 | hsa-miR-224-5p | FAM46C | -2.66 | 0 | 1.01 | 0.03653 | MirTarget | -0.12 | 0 | NA | |
| 102 | hsa-miR-18a-5p | FBP1 | -2.3 | 0 | 2.6 | 0 | MirTarget | -0.5 | 0 | NA | |
| 103 | hsa-miR-18a-5p | FEM1C | -2.3 | 0 | 0.62 | 0.20954 | miRNAWalker2 validate | -0.17 | 0 | NA | |
| 104 | hsa-miR-18a-5p | FGF1 | -2.3 | 0 | 0.65 | 0.10119 | MirTarget | -0.31 | 0 | NA | |
| 105 | hsa-miR-18a-5p | FNDC3A | -2.3 | 0 | 0.25 | 0.65712 | miRNATAP | -0.15 | 0 | NA | |
| 106 | hsa-miR-18a-5p | FRS2 | -2.3 | 0 | 1.13 | 0.03077 | MirTarget | -0.26 | 0 | NA | |
| 107 | hsa-miR-18a-5p | FRYL | -2.3 | 0 | 0.45 | 0.40277 | miRNATAP | -0.15 | 0 | NA | |
| 108 | hsa-miR-18a-5p | GAB1 | -2.3 | 0 | 0.51 | 0.28626 | MirTarget; miRNATAP | -0.18 | 0 | NA | |
| 109 | hsa-miR-452-5p | GARNL3 | -2.02 | 0.00026 | 0.72 | 0.01602 | MirTarget | -0.11 | 0 | NA | |
| 110 | hsa-miR-18a-5p | GAS7 | -2.3 | 0 | 0.45 | 0.39346 | mirMAP | -0.26 | 0 | NA | |
| 111 | hsa-miR-452-5p | GFRA1 | -2.02 | 0.00026 | 4.85 | 0 | MirTarget | -0.6 | 0 | NA | |
| 112 | hsa-miR-452-5p | GIN1 | -2.02 | 0.00026 | 0.76 | 0.00309 | MirTarget | -0.12 | 0 | NA | |
| 113 | hsa-miR-452-5p | GLCCI1 | -2.02 | 0.00026 | 1.02 | 0.01247 | miRNATAP | -0.1 | 0 | NA | |
| 114 | hsa-miR-18a-5p | GLRB | -2.3 | 0 | 1.38 | 4.0E-5 | MirTarget; miRNATAP | -0.42 | 0 | NA | |
| 115 | hsa-miR-18a-5p | GNA11 | -2.3 | 0 | 0.19 | 0.66767 | MirTarget | -0.13 | 0 | NA | |
| 116 | hsa-miR-18a-5p | GNG7 | -2.3 | 0 | -0.32 | 0.39849 | mirMAP | -0.1 | 0.00016 | NA | |
| 117 | hsa-miR-18a-5p | GNPDA2 | -2.3 | 0 | 0.44 | 0.24754 | MirTarget | -0.14 | 0 | NA | |
| 118 | hsa-miR-18a-5p | GTF2A1 | -2.3 | 0 | 0.31 | 0.27739 | MirTarget | -0.21 | 0 | NA | |
| 119 | hsa-miR-452-5p | GUF1 | -2.02 | 0.00026 | 0.44 | 0.35473 | MirTarget | -0.1 | 0 | NA | |
| 120 | hsa-miR-18a-5p | H6PD | -2.3 | 0 | 0.04 | 0.95545 | mirMAP | -0.13 | 0 | NA | |
| 121 | hsa-miR-18a-5p | HERC1 | -2.3 | 0 | 0.31 | 0.59955 | miRNAWalker2 validate | -0.17 | 0 | NA | |
| 122 | hsa-miR-18a-5p | HIPK2 | -2.3 | 0 | 0.04 | 0.95057 | mirMAP | -0.12 | 0 | NA | |
| 123 | hsa-miR-18a-5p | HLF | -2.3 | 0 | -0.19 | 0.61478 | MirTarget | -0.23 | 0 | NA | |
| 124 | hsa-miR-18a-5p | HMBOX1 | -2.3 | 0 | 0.24 | 0.30584 | MirTarget; miRNATAP | -0.21 | 0 | NA | |
| 125 | hsa-miR-224-5p | HOOK1 | -2.66 | 0 | 0.32 | 0.49452 | MirTarget | -0.14 | 0 | NA | |
| 126 | hsa-miR-18a-5p | HOXA9 | -2.3 | 0 | -0.3 | 0.24005 | miRNAWalker2 validate | -0.19 | 0 | NA | |
| 127 | hsa-miR-224-5p | HS6ST3 | -2.66 | 0 | 3.19 | 0 | MirTarget | -0.33 | 0 | NA | |
| 128 | hsa-miR-224-5p | IGF1R | -2.66 | 0 | 1.78 | 0.00817 | mirMAP | -0.26 | 0 | NA | |
| 129 | hsa-miR-452-5p | IGF1R | -2.02 | 0.00026 | 1.78 | 0.00817 | mirMAP | -0.34 | 0 | NA | |
| 130 | hsa-miR-18a-5p | IGFBP5 | -2.3 | 0 | 1.22 | 0.16438 | mirMAP | -0.23 | 0 | NA | |
| 131 | hsa-miR-18a-5p | IL17B | -2.3 | 0 | -0.05 | 0.89446 | MirTarget | -0.28 | 0 | NA | |
| 132 | hsa-miR-452-5p | IL6ST | -2.02 | 0.00026 | 2.17 | 0.00017 | mirMAP | -0.22 | 0 | NA | |
| 133 | hsa-miR-452-5p | INPP4B | -2.02 | 0.00026 | 2.68 | 0 | mirMAP | -0.29 | 0 | NA | |
| 134 | hsa-miR-18a-5p | ITGA2 | -2.3 | 0 | 0.68 | 0.17493 | MirTarget | -0.28 | 0 | NA | |
| 135 | hsa-miR-224-5p | ITPR1 | -2.66 | 0 | 1.63 | 0.00386 | MirTarget | -0.11 | 0 | NA | |
| 136 | hsa-miR-18a-5p | KCNA1 | -2.3 | 0 | 0.29 | 0.40072 | MirTarget; miRNATAP | -0.37 | 0 | NA | |
| 137 | hsa-miR-224-5p | KCNC1 | -2.66 | 0 | 1.79 | 0 | mirMAP | -0.26 | 0 | NA | |
| 138 | hsa-miR-224-5p | KCNE4 | -2.66 | 0 | 2.62 | 0 | mirMAP | -0.3 | 0 | NA | |
| 139 | hsa-miR-224-5p | KCNH1 | -2.66 | 0 | 3.12 | 0 | MirTarget | -0.38 | 0 | NA | |
| 140 | hsa-miR-224-5p | KIAA0040 | -2.66 | 0 | 1.41 | 0.02535 | mirMAP | -0.16 | 0 | NA | |
| 141 | hsa-miR-452-5p | KIAA1324L | -2.02 | 0.00026 | 1.43 | 0.00021 | MirTarget | -0.11 | 1.0E-5 | NA | |
| 142 | hsa-miR-452-5p | KIAA1958 | -2.02 | 0.00026 | 0.42 | 0.02235 | mirMAP | -0.11 | 0 | NA | |
| 143 | hsa-miR-18a-5p | KIF13B | -2.3 | 0 | 1.26 | 0.0332 | mirMAP | -0.43 | 0 | NA | |
| 144 | hsa-miR-224-5p | KIF26B | -2.66 | 0 | 0.03 | 0.93576 | mirMAP | -0.14 | 0 | NA | |
| 145 | hsa-miR-452-5p | KIF26B | -2.02 | 0.00026 | 0.03 | 0.93576 | mirMAP | -0.22 | 0 | NA | |
| 146 | hsa-miR-452-5p | KIF6 | -2.02 | 0.00026 | 0.39 | 0.06419 | mirMAP | -0.13 | 0 | NA | |
| 147 | hsa-miR-224-5p | KLHDC7A | -2.66 | 0 | 4.35 | 0 | mirMAP | -0.4 | 0 | NA | |
| 148 | hsa-miR-452-5p | KSR2 | -2.02 | 0.00026 | 1.23 | 0 | mirMAP | -0.29 | 0 | NA | |
| 149 | hsa-miR-452-5p | LARP4 | -2.02 | 0.00026 | 0.51 | 0.34456 | mirMAP | -0.11 | 0 | NA | |
| 150 | hsa-miR-452-5p | LCOR | -2.02 | 0.00026 | 0.88 | 0.00031 | mirMAP | -0.15 | 0 | NA |
| Num | GO | Overlap | Size | P Value | Adj. P Value |
|---|---|---|---|---|---|
| 1 | HOMOPHILIC CELL ADHESION VIA PLASMA MEMBRANE ADHESION MOLECULES | 19 | 153 | 5.294e-12 | 2.463e-08 |
| 2 | CELL CELL ADHESION VIA PLASMA MEMBRANE ADHESION MOLECULES | 20 | 204 | 1.147e-10 | 2.668e-07 |
| 3 | BIOLOGICAL ADHESION | 44 | 1032 | 2.93e-09 | 4.544e-06 |
| 4 | CELL CELL ADHESION | 31 | 608 | 1.455e-08 | 1.693e-05 |
| 5 | MAMMARY GLAND DEVELOPMENT | 11 | 117 | 2.848e-06 | 0.002209 |
| 6 | CELLULAR RESPONSE TO STEROID HORMONE STIMULUS | 15 | 218 | 2.497e-06 | 0.002209 |
| 7 | RESPONSE TO STEROID HORMONE | 23 | 497 | 5.777e-06 | 0.00352 |
| 8 | REGULATION OF MUSCLE TISSUE DEVELOPMENT | 10 | 103 | 6.053e-06 | 0.00352 |
| 9 | HORMONE MEDIATED SIGNALING PATHWAY | 12 | 158 | 9.389e-06 | 0.004854 |
| 10 | ORGAN GROWTH | 8 | 68 | 1.263e-05 | 0.005878 |
| 11 | RESPONSE TO HORMONE | 32 | 893 | 1.866e-05 | 0.007528 |
| 12 | REGULATION OF CELLULAR COMPONENT MOVEMENT | 29 | 771 | 1.941e-05 | 0.007528 |
| 13 | GLAND DEVELOPMENT | 19 | 395 | 2.235e-05 | 0.007998 |
| Num | GO | Overlap | Size | P Value | Adj. P Value |
|---|---|---|---|---|---|
| 1 | CALCIUM ION BINDING | 31 | 697 | 3.09e-07 | 0.0002871 |
| Num | GO | Overlap | Size | P Value | Adj. P Value |
|---|---|---|---|---|---|
| 1 | NEURON PROJECTION | 40 | 942 | 1.855e-08 | 1.083e-05 |
| 2 | NEURON PART | 46 | 1265 | 1.528e-07 | 4.461e-05 |
| 3 | SYNAPSE | 31 | 754 | 1.638e-06 | 0.0001692 |
| 4 | PLASMA MEMBRANE REGION | 36 | 929 | 9.133e-07 | 0.0001692 |
| 5 | NEURON PROJECTION MEMBRANE | 7 | 36 | 1.409e-06 | 0.0001692 |
| 6 | CELL PROJECTION | 55 | 1786 | 1.738e-06 | 0.0001692 |
| 7 | MEMBRANE REGION | 40 | 1134 | 2.297e-06 | 0.0001916 |
| 8 | SYNAPTIC MEMBRANE | 16 | 261 | 5.158e-06 | 0.0003765 |
| 9 | SYNAPSE PART | 26 | 610 | 6.218e-06 | 0.0004035 |
| 10 | MAIN AXON | 7 | 58 | 3.755e-05 | 0.002193 |
| 11 | AXON | 19 | 418 | 4.819e-05 | 0.002559 |
| 12 | AXOLEMMA | 4 | 14 | 5.672e-05 | 0.00276 |
| 13 | DENDRITE | 19 | 451 | 0.0001309 | 0.005882 |
| 14 | AXON PART | 12 | 219 | 0.0002244 | 0.009362 |
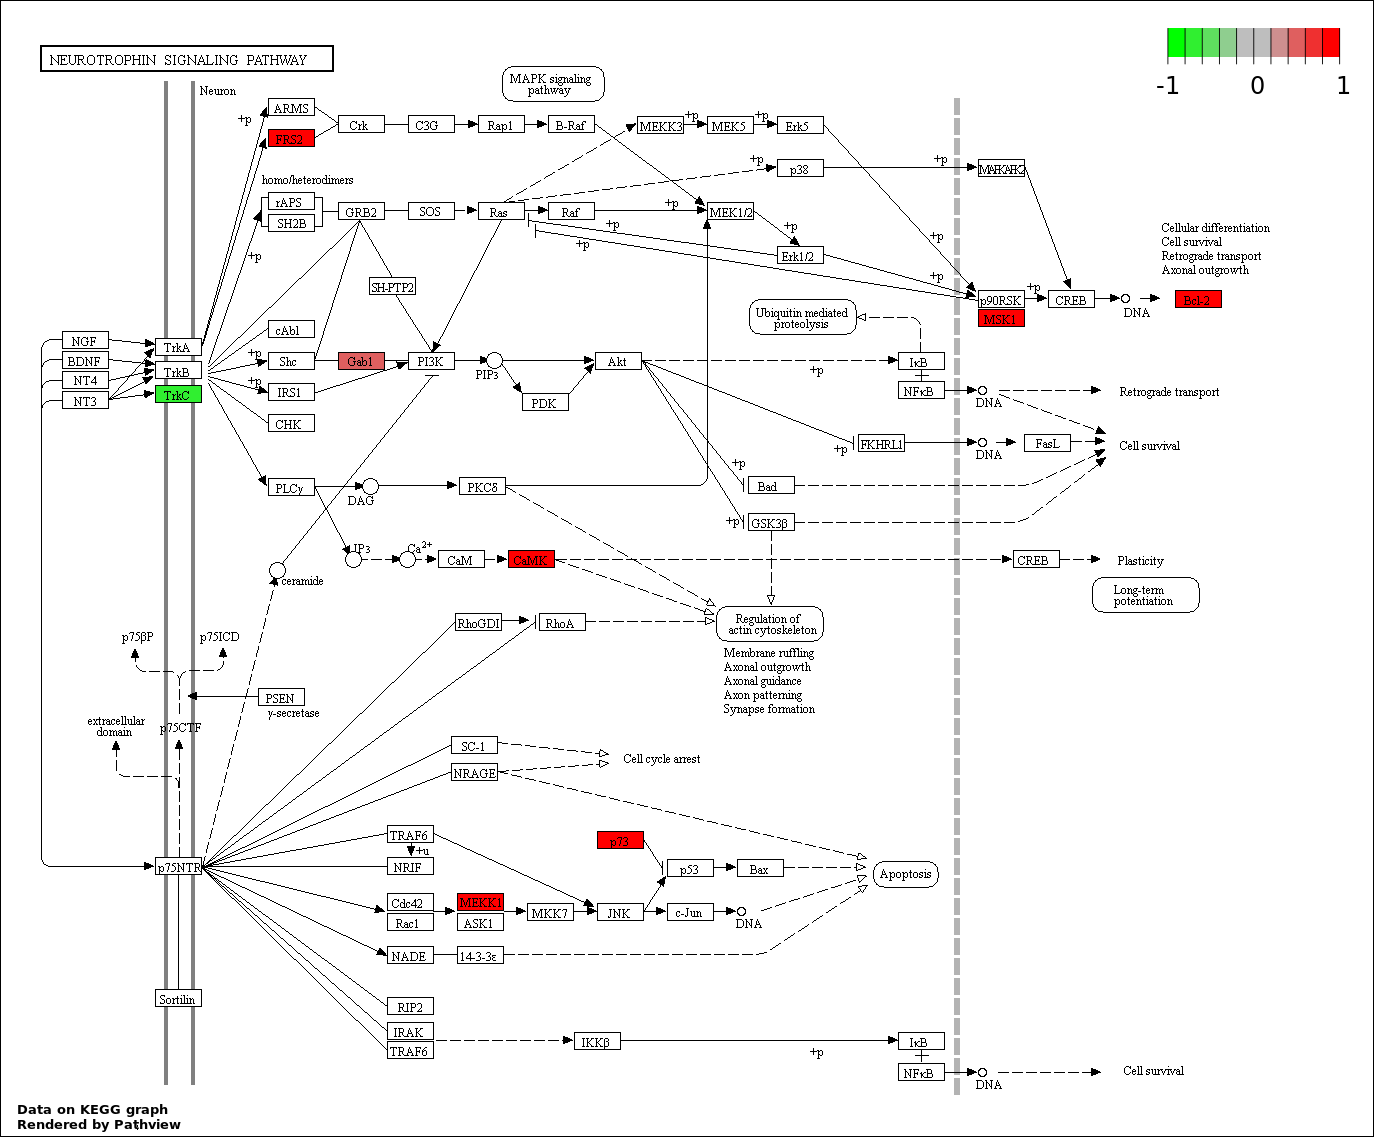
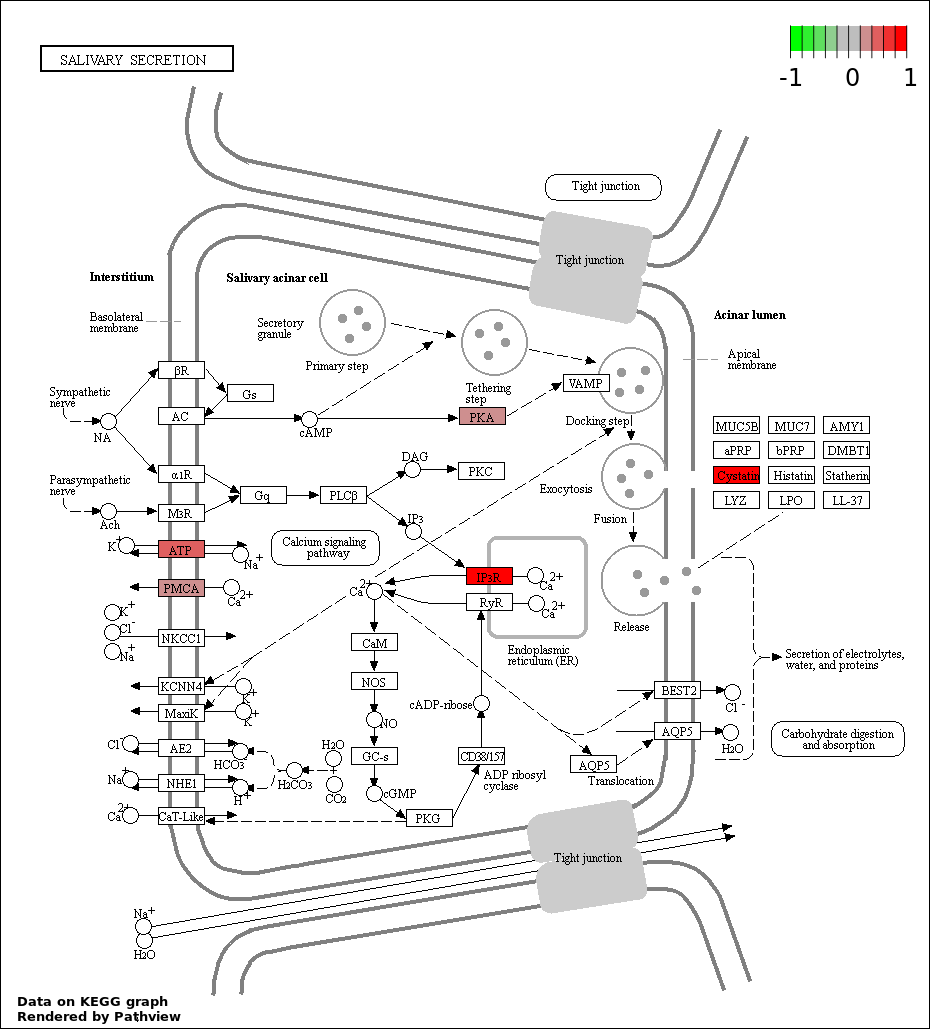
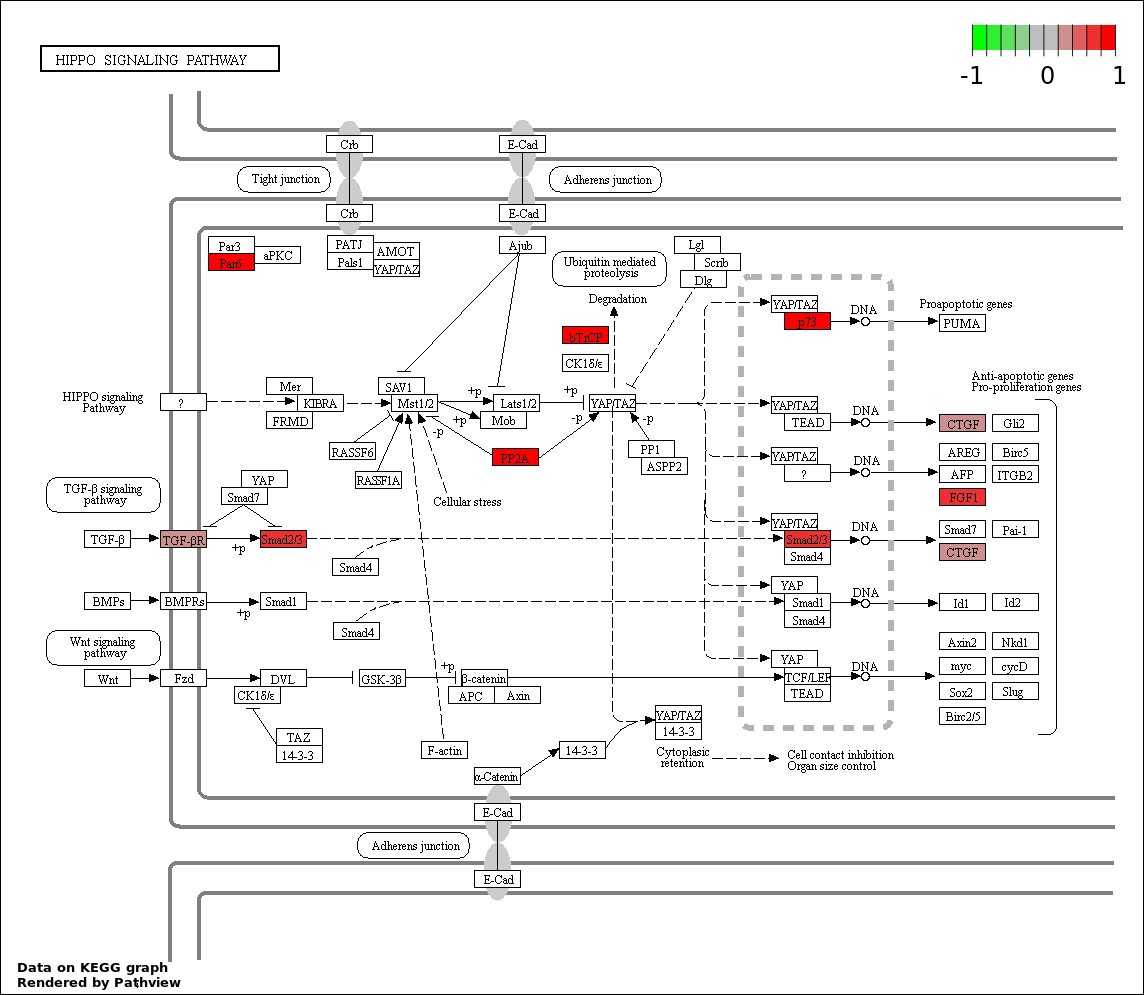
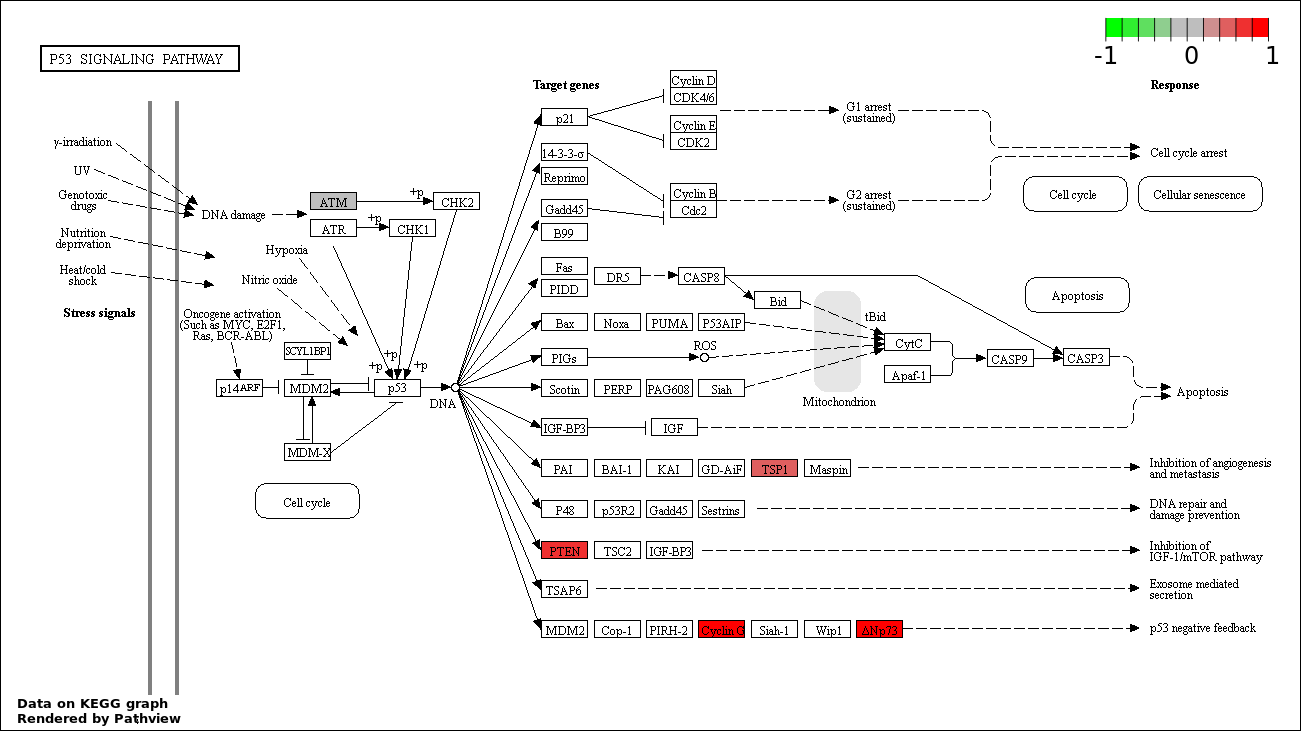
Over-represented Pathway
| Num | Pathway | Pathview | Overlap | Size | P Value | Adj. P Value |
|---|---|---|---|---|---|---|
| 1 | hsa04722_Neurotrophin_signaling_pathway | 8 | 127 | 0.001016 | 0.1488 | |
| 2 | hsa04144_Endocytosis | 10 | 203 | 0.001654 | 0.1488 | |
| 3 | hsa04970_Salivary_secretion | 6 | 89 | 0.003059 | 0.1538 | |
| 4 | hsa04390_Hippo_signaling_pathway | 8 | 154 | 0.003418 | 0.1538 | |
| 5 | hsa04115_p53_signaling_pathway | 5 | 69 | 0.004952 | 0.1783 | |
| 6 | hsa04114_Oocyte_meiosis | 6 | 114 | 0.0101 | 0.2819 | |
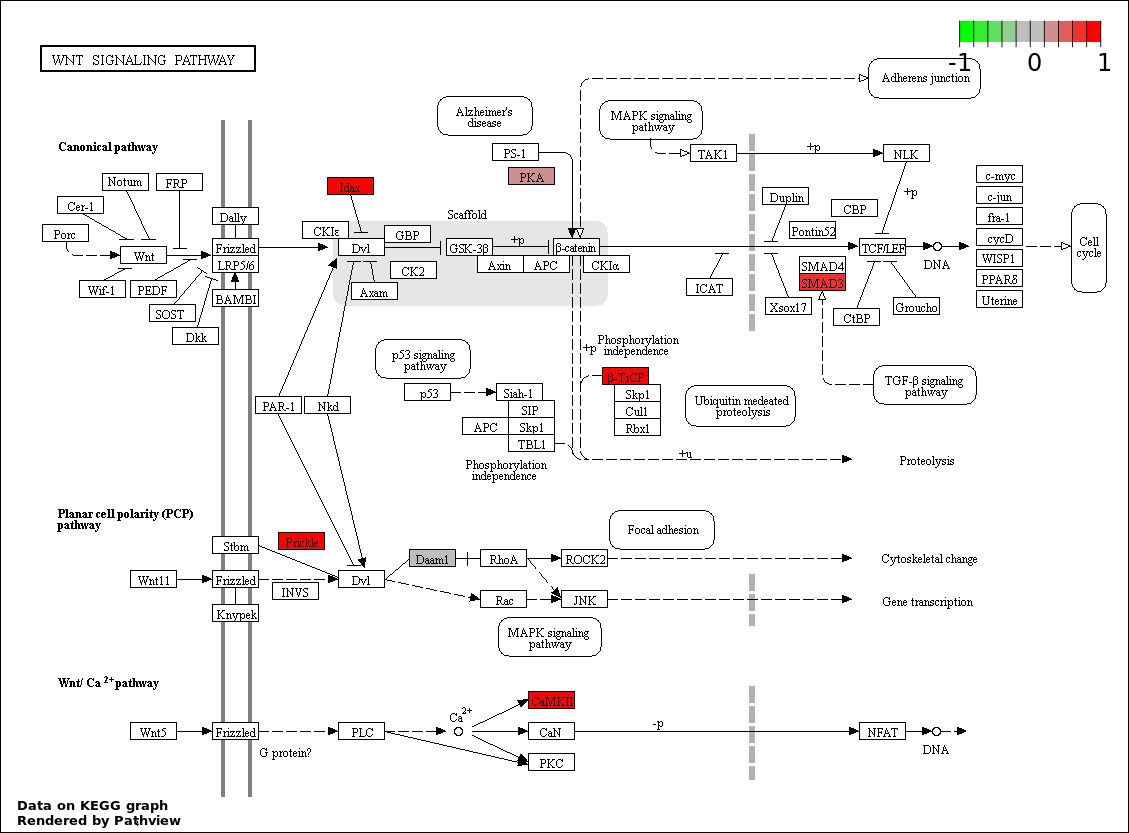
| 7 | hsa04310_Wnt_signaling_pathway | 7 | 151 | 0.01096 | 0.2819 | |
| 8 | hsa04514_Cell_adhesion_molecules_.CAMs. | 6 | 136 | 0.02231 | 0.4633 | |
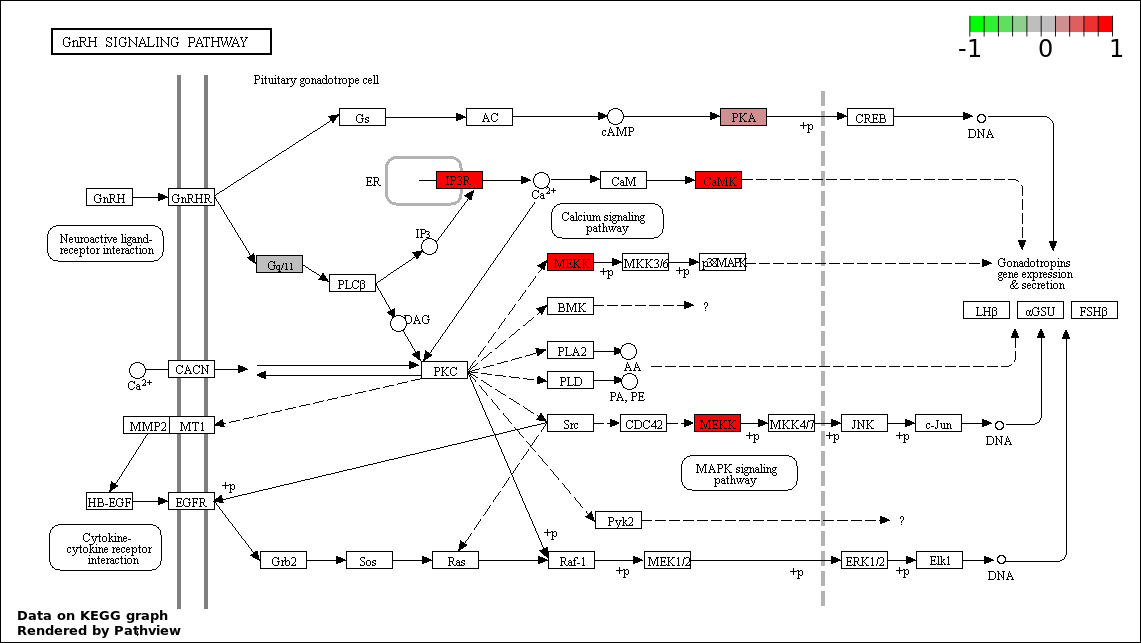
| 9 | hsa04912_GnRH_signaling_pathway | 5 | 101 | 0.02316 | 0.4633 | |
| 10 | hsa04010_MAPK_signaling_pathway | 9 | 268 | 0.02912 | 0.5053 | |
| 11 | hsa04971_Gastric_acid_secretion | 4 | 74 | 0.03088 | 0.5053 | |
| 12 | hsa04012_ErbB_signaling_pathway | 4 | 87 | 0.05099 | 0.6892 | |
| 13 | hsa04710_Circadian_rhythm_._mammal | 2 | 23 | 0.05177 | 0.6892 | |
| 14 | hsa04340_Hedgehog_signaling_pathway | 3 | 56 | 0.06048 | 0.6892 | |
| 15 | hsa04530_Tight_junction | 5 | 133 | 0.06277 | 0.6892 | |
| 16 | hsa00534_Glycosaminoglycan_biosynthesis_._heparan_sulfate | 2 | 26 | 0.06448 | 0.6892 | |
| 17 | hsa04020_Calcium_signaling_pathway | 6 | 177 | 0.06551 | 0.6892 | |
| 18 | hsa00030_Pentose_phosphate_pathway | 2 | 27 | 0.06892 | 0.6892 | |
| 19 | hsa04120_Ubiquitin_mediated_proteolysis | 5 | 139 | 0.07285 | 0.6902 | |
| 20 | hsa04720_Long.term_potentiation | 3 | 70 | 0.1019 | 0.8357 | |
| 21 | hsa04730_Long.term_depression | 3 | 70 | 0.1019 | 0.8357 | |
| 22 | hsa04510_Focal_adhesion | 6 | 200 | 0.1027 | 0.8357 | |
| 23 | hsa04520_Adherens_junction | 3 | 73 | 0.1119 | 0.8391 | |
| 24 | hsa04070_Phosphatidylinositol_signaling_system | 3 | 78 | 0.1294 | 0.9315 | |
| 25 | hsa04350_TGF.beta_signaling_pathway | 3 | 85 | 0.1554 | 1 | |
| 26 | hsa04512_ECM.receptor_interaction | 3 | 85 | 0.1554 | 1 | |
| 27 | hsa04962_Vasopressin.regulated_water_reabsorption | 2 | 44 | 0.1562 | 1 | |
| 28 | hsa04914_Progesterone.mediated_oocyte_maturation | 3 | 87 | 0.1631 | 1 | |
| 29 | hsa04210_Apoptosis | 3 | 89 | 0.1709 | 1 | |
| 30 | hsa04540_Gap_junction | 3 | 90 | 0.1748 | 1 | |
| 31 | hsa04014_Ras_signaling_pathway | 6 | 236 | 0.1784 | 1 | |
| 32 | hsa00510_N.Glycan_biosynthesis | 2 | 49 | 0.1847 | 1 | |
| 33 | hsa04151_PI3K_AKT_signaling_pathway | 8 | 351 | 0.202 | 1 | |
| 34 | hsa04972_Pancreatic_secretion | 3 | 101 | 0.2197 | 1 | |
| 35 | hsa00562_Inositol_phosphate_metabolism | 2 | 57 | 0.2316 | 1 | |
| 36 | hsa00010_Glycolysis_._Gluconeogenesis | 2 | 65 | 0.2791 | 1 | |
| 37 | hsa04270_Vascular_smooth_muscle_contraction | 3 | 116 | 0.284 | 1 | |
| 38 | hsa04976_Bile_secretion | 2 | 71 | 0.3146 | 1 | |
| 39 | hsa04260_Cardiac_muscle_contraction | 2 | 77 | 0.3497 | 1 | |
| 40 | hsa03015_mRNA_surveillance_pathway | 2 | 83 | 0.3842 | 1 | |
| 41 | hsa04916_Melanogenesis | 2 | 101 | 0.4823 | 1 | |
| 42 | hsa04670_Leukocyte_transendothelial_migration | 2 | 117 | 0.561 | 1 | |
| 43 | hsa04110_Cell_cycle | 2 | 128 | 0.6099 | 1 | |
| 44 | hsa04910_Insulin_signaling_pathway | 2 | 138 | 0.6507 | 1 | |
| 45 | hsa04145_Phagosome | 2 | 156 | 0.7156 | 1 | |
| 46 | hsa00230_Purine_metabolism | 2 | 162 | 0.7348 | 1 | |
| 47 | hsa04062_Chemokine_signaling_pathway | 2 | 189 | 0.8082 | 1 | |
| 48 | hsa04810_Regulation_of_actin_cytoskeleton | 2 | 214 | 0.8595 | 1 | |
| 49 | hsa04740_Olfactory_transduction | 2 | 388 | 0.9866 | 1 |