This regulatory network was inferred from the input dataset. The miRNAs and mRNAs are
presented as round and rectangle nodes respectively. The numerical value popped up upon mouse over the gene node is the log2 transformed fold-change of the gene expression between the two groups. All of the nodes are clickable, and the detailed information of the miRNAs/mRNAs and related cancer pathway will be displayed in another window. The edges between nodes are supported by both interactions (predicted or experimentally verified) and correlations learnt from cancer dataset. The numerical value popped up upon mouse over the edge is the correlation beat value (effect size) between the two nodes. The experimental evidences of the edges reported in previous cancer studies are highlighted by red/orange color. All of these information can be accessed by the "mouse-over" action. This network shows a full map of the miRNA-mRNA regulation of the input gene list(s), and the hub miRNAs (with the high network degree/betweenness centrality) would be the potential cancer drivers or tumor suppressors. The full result table can be accessed in the "Regulations" tab.
"miRNACancerMAP" is also a network visualization tool for users to draw their regulatory network by personal customization. Users can set the complexity of the network by limiting the number of nodes or edges. And the color of the nodes can be defined by different categories of the mRNAs and miRNAs, such as Gene-Ontology, pathway, and expression status. Users can also select to use network degree or network betweenness centrality to define the node size. And edges can be black or colored by the correlation. Purple edge means negative correlation (mostly found between miRNA and mRNA), and blue edge means positive correlation (found in PPI or miRNA-miRNA sponge effect). We can also add the protein-protein interactions (PPI) into the network. This result will show the cluster of genes regulated by some specific miRNAs. Additionally, miRNA-miRNA edges can be added by the "miRNA sponge" button, presenting some clusters of miRNAs that have the interactions via sponge effect.
miRNA-gene regulations
| Num | microRNA | Gene | miRNA log2FC | miRNA pvalue | Gene log2FC | Gene pvalue | Interaction | Correlation beta | Correlation P-value | PMID | Reported in cancer studies |
|---|---|---|---|---|---|---|---|---|---|---|---|
| 1 | hsa-miR-145-5p | CNDP2 | -2.63 | 0 | 0.62 | 0 | MirTarget | -0.11 | 0 | NA | |
| 2 | hsa-miR-361-5p | CNDP2 | -0.1 | 0.09543 | 0.62 | 0 | miRanda | -0.17 | 1.0E-5 | NA |
| Num | GO | Overlap | Size | P Value | Adj. P Value |
|---|---|---|---|---|---|
| 1 | SMALL MOLECULE METABOLIC PROCESS | 26 | 1767 | 1.244e-09 | 2.393e-06 |
| 2 | ETHANOL METABOLIC PROCESS | 5 | 14 | 1.543e-09 | 2.393e-06 |
| 3 | PRIMARY ALCOHOL METABOLIC PROCESS | 7 | 47 | 5.783e-10 | 2.393e-06 |
| 4 | CARBOXYLIC ACID BIOSYNTHETIC PROCESS | 9 | 270 | 1.054e-06 | 0.0008176 |
| 5 | ORGANIC ACID BIOSYNTHETIC PROCESS | 9 | 270 | 1.054e-06 | 0.0008176 |
| 6 | CELLULAR ALDEHYDE METABOLIC PROCESS | 6 | 84 | 9.238e-07 | 0.0008176 |
| 7 | ORGANIC ACID METABOLIC PROCESS | 15 | 953 | 3.469e-06 | 0.002306 |
| 8 | NEURONAL ACTION POTENTIAL | 4 | 28 | 4.081e-06 | 0.002374 |
| 9 | OXIDATION REDUCTION PROCESS | 14 | 898 | 8.588e-06 | 0.00444 |
| 10 | CATION TRANSPORT | 13 | 796 | 1.149e-05 | 0.005348 |
| 11 | ORGANONITROGEN COMPOUND METABOLIC PROCESS | 20 | 1796 | 1.274e-05 | 0.005391 |
| 12 | MEMBRANE DEPOLARIZATION DURING ACTION POTENTIAL | 4 | 39 | 1.587e-05 | 0.005783 |
| 13 | ION TRANSMEMBRANE TRANSPORT | 13 | 822 | 1.616e-05 | 0.005783 |
| 14 | ORGANIC HYDROXY COMPOUND METABOLIC PROCESS | 10 | 482 | 1.748e-05 | 0.00581 |
| 15 | TRANSMEMBRANE TRANSPORT | 15 | 1098 | 1.89e-05 | 0.005863 |
| 16 | CELLULAR AMINO ACID BIOSYNTHETIC PROCESS | 5 | 93 | 3.15e-05 | 0.008622 |
| 17 | POSITIVE REGULATION OF TELOMERE CAPPING | 3 | 16 | 3.081e-05 | 0.008622 |
| Num | GO | Overlap | Size | P Value | Adj. P Value |
|---|---|---|---|---|---|
| 1 | OXIDOREDUCTASE ACTIVITY ACTING ON THE ALDEHYDE OR OXO GROUP OF DONORS NAD OR NADP AS ACCEPTOR | 5 | 36 | 2.717e-07 | 0.0001343 |
| 2 | OXIDOREDUCTASE ACTIVITY ACTING ON THE CH OH GROUP OF DONORS NAD OR NADP AS ACCEPTOR | 7 | 113 | 2.892e-07 | 0.0001343 |
| 3 | ALDEHYDE DEHYDROGENASE NAD ACTIVITY | 4 | 19 | 7.935e-07 | 0.0001531 |
| 4 | VOLTAGE GATED SODIUM CHANNEL ACTIVITY | 4 | 20 | 9.889e-07 | 0.0001531 |
| 5 | OXIDOREDUCTASE ACTIVITY ACTING ON CH OH GROUP OF DONORS | 7 | 134 | 9.207e-07 | 0.0001531 |
| 6 | OXIDOREDUCTASE ACTIVITY ACTING ON THE ALDEHYDE OR OXO GROUP OF DONORS | 5 | 46 | 9.583e-07 | 0.0001531 |
| 7 | EXOPEPTIDASE ACTIVITY | 6 | 106 | 3.622e-06 | 0.0004808 |
| 8 | CATION TRANSMEMBRANE TRANSPORTER ACTIVITY | 12 | 622 | 4.906e-06 | 0.0005697 |
| 9 | SODIUM CHANNEL ACTIVITY | 4 | 37 | 1.282e-05 | 0.001323 |
| 10 | AMINOPEPTIDASE ACTIVITY | 4 | 43 | 2.353e-05 | 0.00212 |
| 11 | METALLOAMINOPEPTIDASE ACTIVITY | 3 | 15 | 2.51e-05 | 0.00212 |
| 12 | NAD BINDING | 4 | 53 | 5.421e-05 | 0.004197 |
| 13 | ACTIVE TRANSMEMBRANE TRANSPORTER ACTIVITY | 8 | 356 | 7.384e-05 | 0.004346 |
| 14 | RIBONUCLEOTIDE BINDING | 19 | 1860 | 7.271e-05 | 0.004346 |
| 15 | LIGASE ACTIVITY FORMING CARBON NITROGEN BONDS | 4 | 56 | 6.74e-05 | 0.004346 |
| 16 | COFACTOR BINDING | 7 | 263 | 7.486e-05 | 0.004346 |
| 17 | METALLOPEPTIDASE ACTIVITY | 6 | 188 | 9.332e-05 | 0.005099 |
| 18 | TRANSMEMBRANE TRANSPORTER ACTIVITY | 13 | 997 | 0.0001174 | 0.00606 |
| Num | GO | Overlap | Size | P Value | Adj. P Value |
|---|---|---|---|---|---|
| 1 | VOLTAGE GATED SODIUM CHANNEL COMPLEX | 4 | 14 | 2.08e-07 | 0.0001215 |
| 2 | SODIUM CHANNEL COMPLEX | 4 | 17 | 4.901e-07 | 0.0001431 |
| 3 | INTRINSIC COMPONENT OF PLASMA MEMBRANE | 18 | 1649 | 5.003e-05 | 0.009739 |
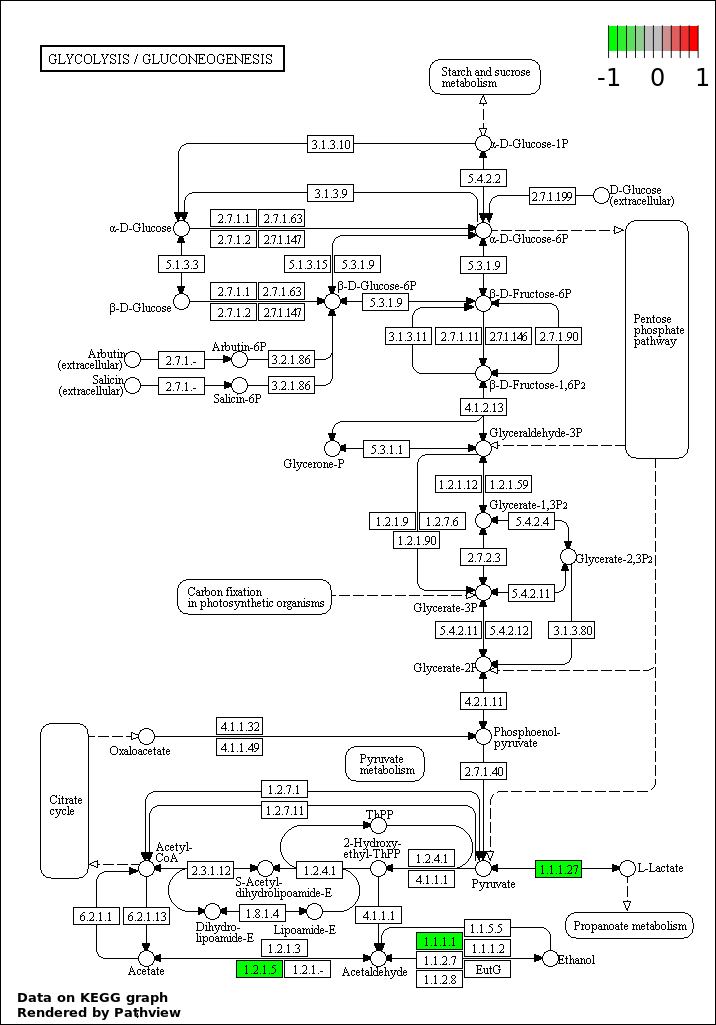
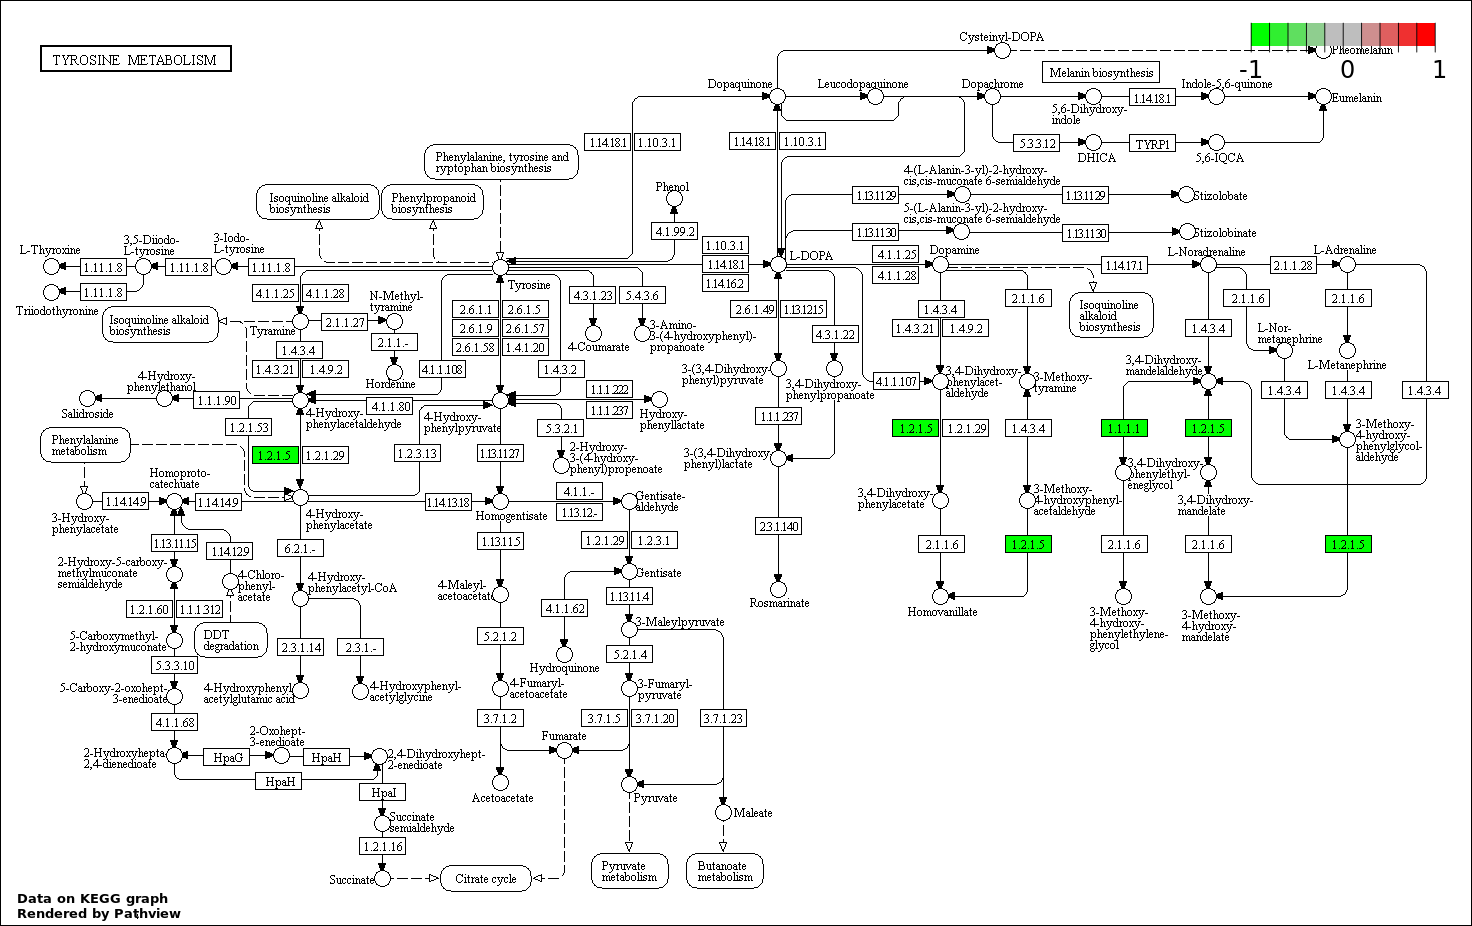
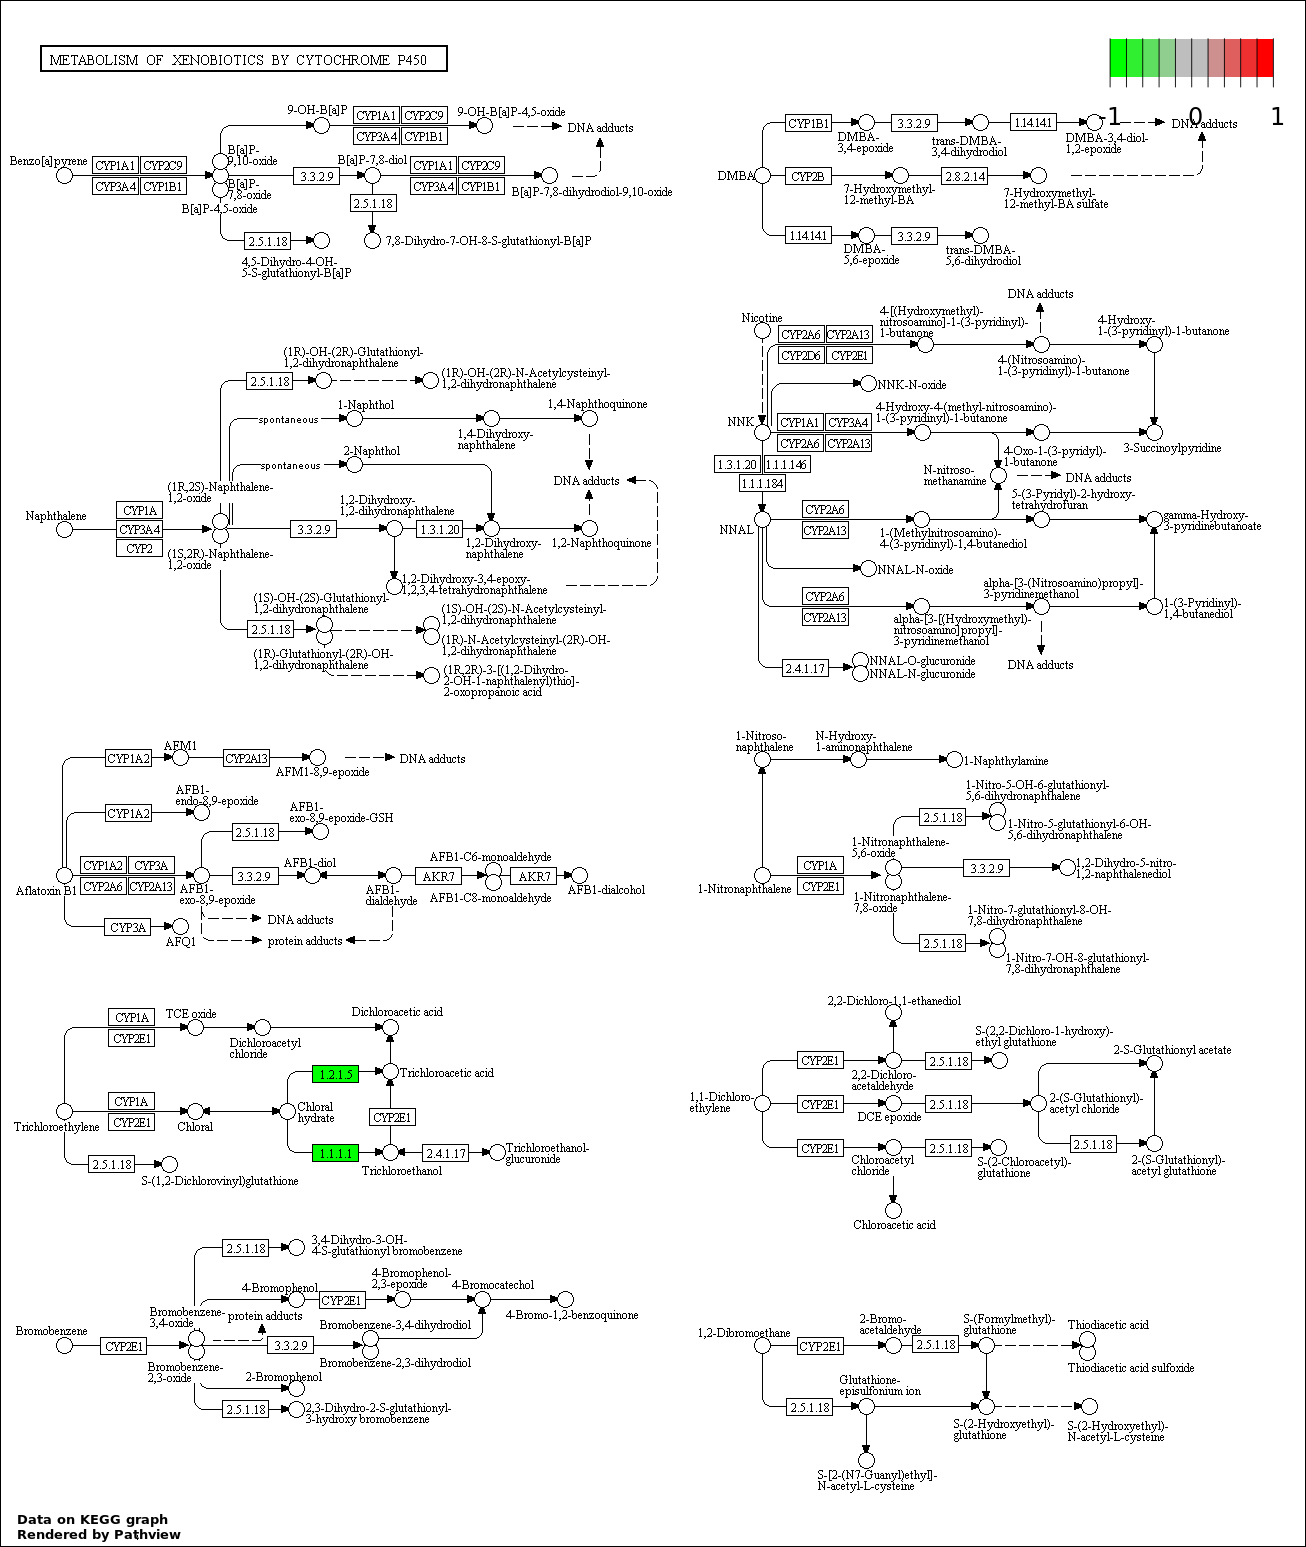
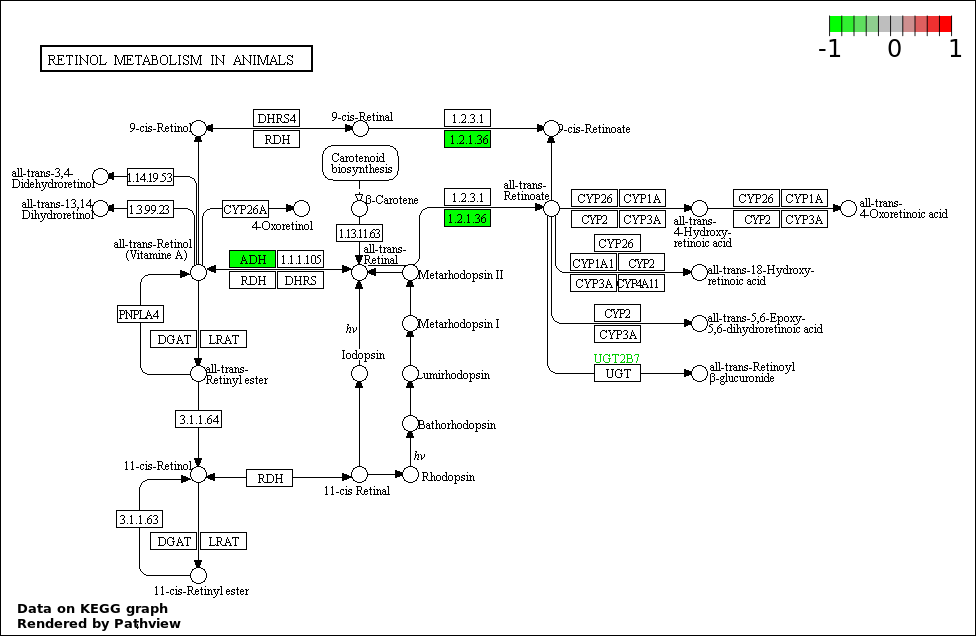
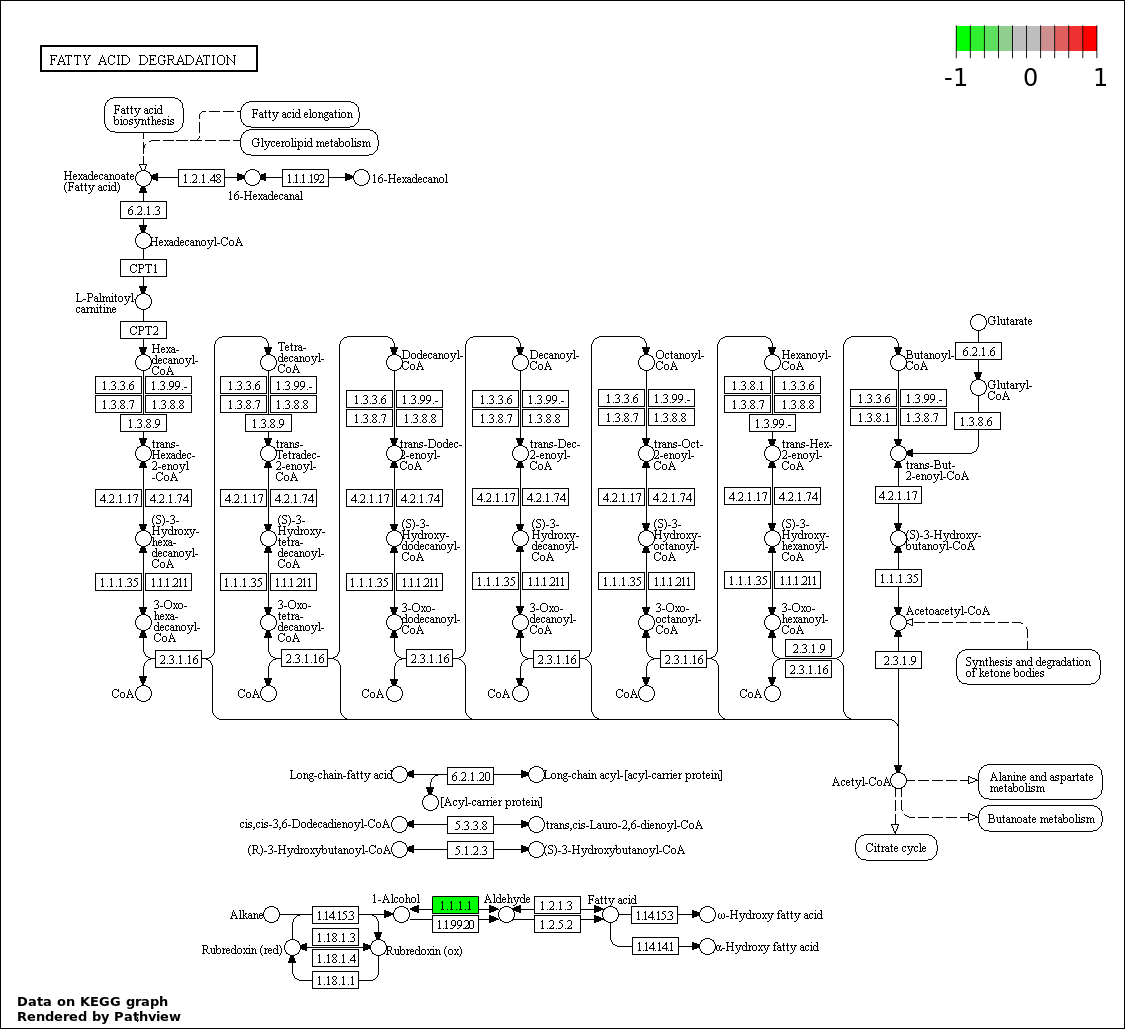
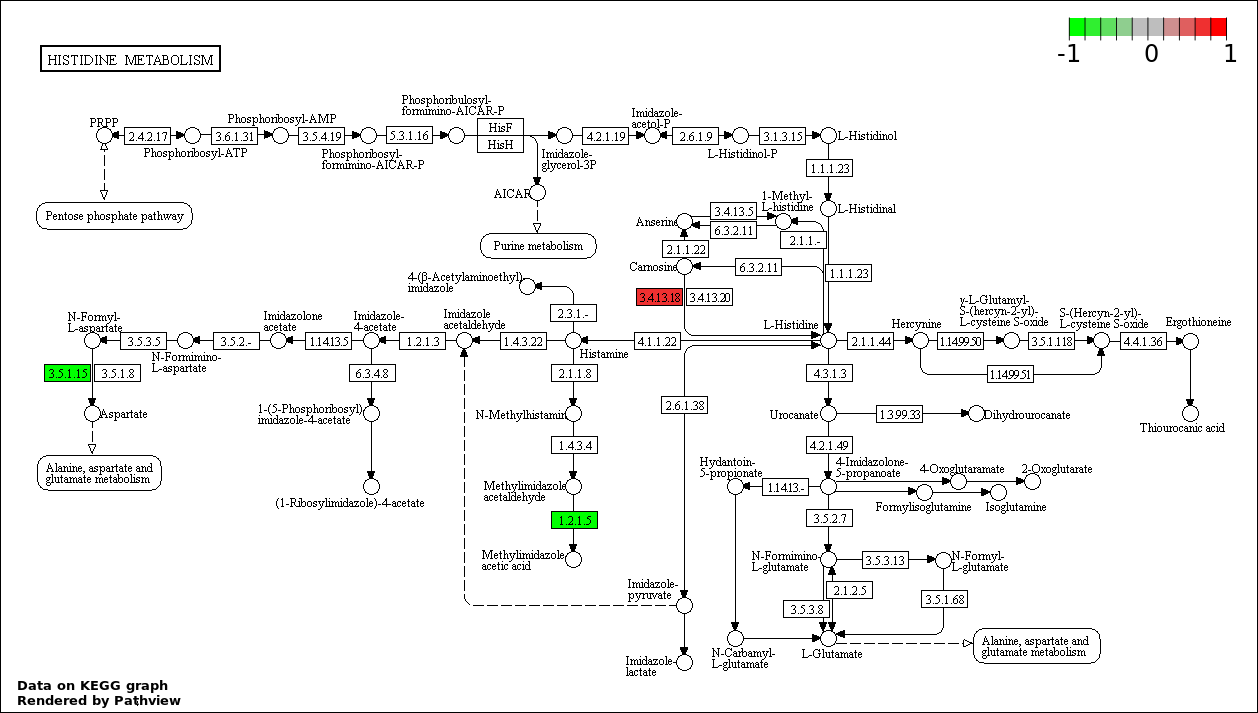
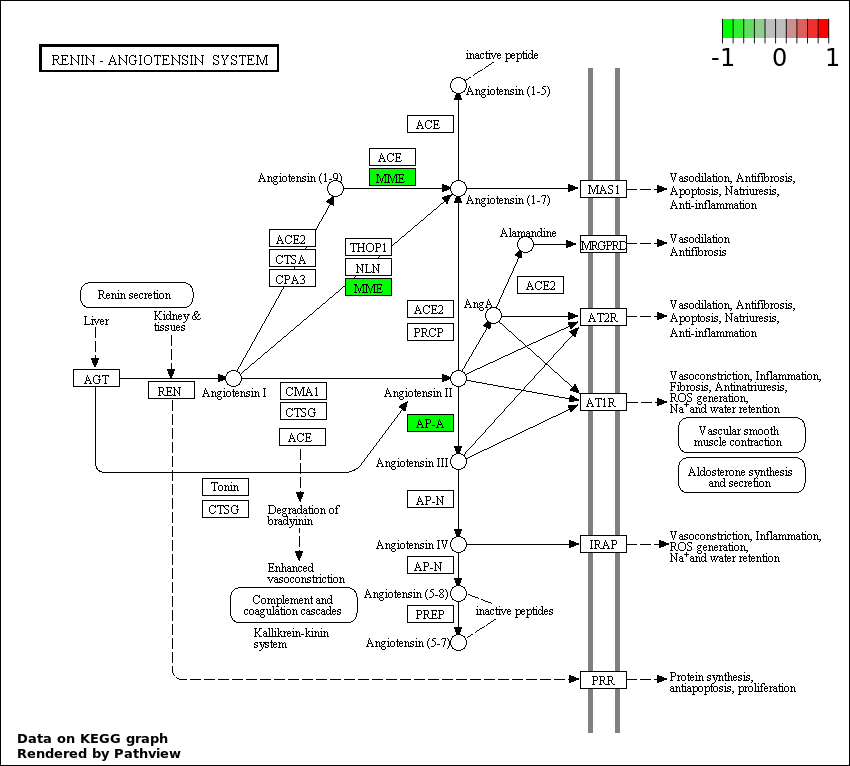
Over-represented Pathway
| Num | Pathway | Pathview | Overlap | Size | P Value | Adj. P Value |
|---|---|---|---|---|---|---|
| 1 | hsa00010_Glycolysis_._Gluconeogenesis | 7 | 65 | 6.053e-09 | 1.05e-06 | |
| 2 | hsa00350_Tyrosine_metabolism | 6 | 41 | 1.167e-08 | 1.05e-06 | |
| 3 | hsa00980_Metabolism_of_xenobiotics_by_cytochrome_P450 | 6 | 71 | 3.388e-07 | 1.801e-05 | |
| 4 | hsa00982_Drug_metabolism_._cytochrome_P450 | 6 | 73 | 4.002e-07 | 1.801e-05 | |
| 5 | hsa00830_Retinol_metabolism | 5 | 64 | 5.047e-06 | 0.0001817 | |
| 6 | hsa00071_Fatty_acid_metabolism | 4 | 43 | 2.353e-05 | 0.000706 | |
| 7 | hsa00340_Histidine_metabolism | 3 | 29 | 0.0001938 | 0.004984 | |
| 8 | hsa00360_Phenylalanine_metabolism | 2 | 17 | 0.001966 | 0.03754 | |
| 9 | hsa04614_Renin.angiotensin_system | 2 | 17 | 0.001966 | 0.03754 | |
| 10 | hsa04910_Insulin_signaling_pathway | 4 | 138 | 0.002085 | 0.03754 | |
| 11 | hsa00020_Citrate_cycle_.TCA_cycle. | 2 | 30 | 0.006086 | 0.08877 | |
| 12 | hsa00250_Alanine._aspartate_and_glutamate_metabolism | 2 | 32 | 0.006904 | 0.08877 | |
| 13 | hsa00260_Glycine._serine_and_threonine_metabolism | 2 | 32 | 0.006904 | 0.08877 | |
| 14 | hsa00640_Propanoate_metabolism | 2 | 32 | 0.006904 | 0.08877 | |
| 15 | hsa00620_Pyruvate_metabolism | 2 | 40 | 0.01064 | 0.1277 | |
| 16 | hsa04960_Aldosterone.regulated_sodium_reabsorption | 2 | 42 | 0.01169 | 0.1315 | |
| 17 | hsa04514_Cell_adhesion_molecules_.CAMs. | 3 | 136 | 0.01615 | 0.171 | |
| 18 | hsa04150_mTOR_signaling_pathway | 2 | 52 | 0.01755 | 0.1755 | |
| 19 | hsa04920_Adipocytokine_signaling_pathway | 2 | 68 | 0.02898 | 0.2484 | |
| 20 | hsa04730_Long.term_depression | 2 | 70 | 0.03057 | 0.2501 | |
| 21 | hsa04974_Protein_digestion_and_absorption | 2 | 81 | 0.0399 | 0.2993 | |
| 22 | hsa04510_Focal_adhesion | 3 | 200 | 0.0434 | 0.3089 | |
| 23 | hsa04914_Progesterone.mediated_oocyte_maturation | 2 | 87 | 0.0454 | 0.3089 | |
| 24 | hsa04640_Hematopoietic_cell_lineage | 2 | 88 | 0.04634 | 0.3089 | |
| 25 | hsa04151_PI3K_AKT_signaling_pathway | 4 | 351 | 0.04836 | 0.3109 | |
| 26 | hsa04810_Regulation_of_actin_cytoskeleton | 3 | 214 | 0.05123 | 0.318 | |
| 27 | hsa04014_Ras_signaling_pathway | 3 | 236 | 0.06481 | 0.3822 | |
| 28 | hsa04114_Oocyte_meiosis | 2 | 114 | 0.07313 | 0.3989 | |
| 29 | hsa04360_Axon_guidance | 2 | 130 | 0.09154 | 0.4656 |