This regulatory network was inferred from the input dataset. The miRNAs and mRNAs are
presented as round and rectangle nodes respectively. The numerical value popped up upon mouse over the gene node is the log2 transformed fold-change of the gene expression between the two groups. All of the nodes are clickable, and the detailed information of the miRNAs/mRNAs and related cancer pathway will be displayed in another window. The edges between nodes are supported by both interactions (predicted or experimentally verified) and correlations learnt from cancer dataset. The numerical value popped up upon mouse over the edge is the correlation beat value (effect size) between the two nodes. The experimental evidences of the edges reported in previous cancer studies are highlighted by red/orange color. All of these information can be accessed by the "mouse-over" action. This network shows a full map of the miRNA-mRNA regulation of the input gene list(s), and the hub miRNAs (with the high network degree/betweenness centrality) would be the potential cancer drivers or tumor suppressors. The full result table can be accessed in the "Regulations" tab.
"miRNACancerMAP" is also a network visualization tool for users to draw their regulatory network by personal customization. Users can set the complexity of the network by limiting the number of nodes or edges. And the color of the nodes can be defined by different categories of the mRNAs and miRNAs, such as Gene-Ontology, pathway, and expression status. Users can also select to use network degree or network betweenness centrality to define the node size. And edges can be black or colored by the correlation. Purple edge means negative correlation (mostly found between miRNA and mRNA), and blue edge means positive correlation (found in PPI or miRNA-miRNA sponge effect). We can also add the protein-protein interactions (PPI) into the network. This result will show the cluster of genes regulated by some specific miRNAs. Additionally, miRNA-miRNA edges can be added by the "miRNA sponge" button, presenting some clusters of miRNAs that have the interactions via sponge effect.
miRNA-gene regulations
| Num | microRNA | Gene | miRNA log2FC | miRNA pvalue | Gene log2FC | Gene pvalue | Interaction | Correlation beta | Correlation P-value | PMID | Reported in cancer studies |
|---|---|---|---|---|---|---|---|---|---|---|---|
| 1 | hsa-miR-326 | ABCC5 | 1.77 | 0.03673 | 1.8 | 0.0203 | miRanda | -0.12 | 0.02652 | NA | |
| 2 | hsa-miR-326 | ABHD6 | 1.77 | 0.03673 | -0.68 | 0.21242 | miRanda | -0.11 | 0.00343 | NA | |
| 3 | hsa-miR-326 | ACAP3 | 1.77 | 0.03673 | 0.55 | 0.20329 | MirTarget | -0.12 | 4.0E-5 | NA | |
| 4 | hsa-miR-326 | ACER2 | 1.77 | 0.03673 | 1.83 | 0.01308 | MirTarget; miRanda | -0.15 | 0.00227 | NA | |
| 5 | hsa-miR-326 | ACPP | 1.77 | 0.03673 | 3.93 | 3.0E-5 | miRanda | -0.13 | 0.04646 | NA | |
| 6 | hsa-miR-326 | ADAM33 | 1.77 | 0.03673 | -5.4 | 0 | miRanda; miRNATAP | -0.18 | 0.01905 | NA | |
| 7 | hsa-miR-326 | ADAMTS15 | 1.77 | 0.03673 | -1.08 | 0.48725 | mirMAP | -0.24 | 0.02347 | NA | |
| 8 | hsa-miR-326 | AGAP11 | 1.77 | 0.03673 | -2.7 | 0.0073 | miRanda | -0.25 | 0.00018 | NA | |
| 9 | hsa-miR-326 | AGPAT4 | 1.77 | 0.03673 | -1.78 | 0.03177 | mirMAP | -0.14 | 0.01589 | NA | |
| 10 | hsa-miR-326 | AMOTL1 | 1.77 | 0.03673 | -0.99 | 0.1814 | miRNATAP | -0.13 | 0.01109 | NA | |
| 11 | hsa-miR-326 | ARC | 1.77 | 0.03673 | -3.48 | 0.00134 | miRanda; miRNATAP | -0.18 | 0.01221 | NA | |
| 12 | hsa-miR-326 | ARHGEF37 | 1.77 | 0.03673 | -0.75 | 0.26489 | MirTarget; miRanda; miRNATAP | -0.21 | 0 | NA | |
| 13 | hsa-miR-326 | ARHGEF4 | 1.77 | 0.03673 | 1.39 | 0.1842 | mirMAP | -0.27 | 0.00013 | NA | |
| 14 | hsa-miR-326 | ATRNL1 | 1.77 | 0.03673 | -7.16 | 0 | miRanda | -0.31 | 0.00309 | NA | |
| 15 | hsa-miR-326 | AVPR1A | 1.77 | 0.03673 | -4.55 | 0.0001 | miRanda | -0.19 | 0.01537 | NA | |
| 16 | hsa-miR-326 | BCO2 | 1.77 | 0.03673 | -1.13 | 0.16359 | miRanda | -0.12 | 0.02737 | NA | |
| 17 | hsa-miR-326 | BICD2 | 1.77 | 0.03673 | 0.86 | 0.21413 | miRanda | -0.15 | 0.00159 | NA | |
| 18 | hsa-miR-326 | BMP8A | 1.77 | 0.03673 | -0.91 | 0.14941 | miRanda | -0.12 | 0.00459 | NA | |
| 19 | hsa-miR-326 | BOC | 1.77 | 0.03673 | -4.15 | 6.0E-5 | miRanda | -0.15 | 0.03068 | NA | |
| 20 | hsa-miR-326 | BTBD7 | 1.77 | 0.03673 | -0.03 | 0.9391 | miRanda | -0.11 | 0 | NA | |
| 21 | hsa-miR-326 | C20orf194 | 1.77 | 0.03673 | -1.86 | 0.0005 | PITA | -0.11 | 0.00235 | NA | |
| 22 | hsa-miR-326 | CACHD1 | 1.77 | 0.03673 | -2.27 | 0.00894 | miRanda | -0.12 | 0.03783 | NA | |
| 23 | hsa-miR-326 | CAPN3 | 1.77 | 0.03673 | 0.02 | 0.98099 | miRanda | -0.1 | 0.01521 | NA | |
| 24 | hsa-miR-326 | CASKIN1 | 1.77 | 0.03673 | 1.61 | 0.14711 | MirTarget; PITA; miRanda | -0.15 | 0.04889 | NA | |
| 25 | hsa-miR-326 | CBFA2T3 | 1.77 | 0.03673 | -1.36 | 0.14666 | MirTarget; miRanda; miRNATAP | -0.13 | 0.03606 | NA | |
| 26 | hsa-miR-326 | CCDC146 | 1.77 | 0.03673 | 0.39 | 0.59087 | miRanda | -0.11 | 0.01959 | NA | |
| 27 | hsa-miR-326 | CHRDL1 | 1.77 | 0.03673 | -10 | 0 | MirTarget; miRNATAP | -0.25 | 0.03474 | NA | |
| 28 | hsa-miR-326 | CHRNB4 | 1.77 | 0.03673 | 3.4 | 0.03394 | miRanda | -0.25 | 0.02377 | NA | |
| 29 | hsa-miR-326 | CLDN16 | 1.77 | 0.03673 | 1.66 | 0.2236 | MirTarget | -0.21 | 0.02001 | NA | |
| 30 | hsa-miR-326 | CNKSR3 | 1.77 | 0.03673 | -1.68 | 0.01775 | miRanda | -0.1 | 0.03204 | NA | |
| 31 | hsa-miR-326 | CNTN1 | 1.77 | 0.03673 | -2.85 | 0.12833 | miRanda | -0.28 | 0.02817 | NA | |
| 32 | hsa-miR-326 | COL2A1 | 1.77 | 0.03673 | -1.26 | 0.44711 | miRanda | -0.28 | 0.01308 | NA | |
| 33 | hsa-miR-326 | COL5A3 | 1.77 | 0.03673 | -1.13 | 0.24704 | miRanda | -0.14 | 0.03758 | NA | |
| 34 | hsa-miR-326 | CROCC | 1.77 | 0.03673 | -0.28 | 0.59938 | MirTarget; miRanda | -0.15 | 2.0E-5 | NA | |
| 35 | hsa-miR-326 | CSPG4 | 1.77 | 0.03673 | -2.75 | 0.00633 | miRanda | -0.21 | 0.00163 | NA | |
| 36 | hsa-miR-326 | DLL1 | 1.77 | 0.03673 | -1.05 | 0.27477 | miRanda | -0.16 | 0.01138 | NA | |
| 37 | hsa-miR-326 | DST | 1.77 | 0.03673 | -1.13 | 0.25105 | miRanda; mirMAP | -0.16 | 0.01638 | NA | |
| 38 | hsa-miR-326 | DUSP7 | 1.77 | 0.03673 | 0.94 | 0.22255 | miRanda; mirMAP | -0.11 | 0.0328 | NA | |
| 39 | hsa-miR-326 | ECM1 | 1.77 | 0.03673 | 0.53 | 0.6467 | miRanda | -0.23 | 0.00329 | NA | |
| 40 | hsa-miR-326 | ELOVL4 | 1.77 | 0.03673 | -1.31 | 0.37017 | miRanda | -0.21 | 0.03637 | NA | |
| 41 | hsa-miR-326 | EPHB3 | 1.77 | 0.03673 | 0.75 | 0.4432 | MirTarget; PITA; miRanda; miRNATAP | -0.26 | 0.0001 | NA | |
| 42 | hsa-miR-326 | ERBB2 | 1.77 | 0.03673 | 0.95 | 0.17584 | miRNAWalker2 validate; miRanda | -0.15 | 0.00157 | NA | |
| 43 | hsa-miR-326 | ERC1 | 1.77 | 0.03673 | -0.28 | 0.49235 | miRNATAP | -0.1 | 0.00017 | NA | |
| 44 | hsa-miR-326 | ERN1 | 1.77 | 0.03673 | -0.19 | 0.83042 | MirTarget; miRanda | -0.12 | 0.04555 | NA | |
| 45 | hsa-miR-326 | EVC | 1.77 | 0.03673 | -2.04 | 0.01095 | mirMAP | -0.13 | 0.01948 | NA | |
| 46 | hsa-miR-326 | FAM71F2 | 1.77 | 0.03673 | -0.2 | 0.81397 | miRanda | -0.15 | 0.00681 | NA | |
| 47 | hsa-miR-326 | FAT2 | 1.77 | 0.03673 | 6.66 | 0.00052 | miRanda | -0.42 | 0.00112 | NA | |
| 48 | hsa-miR-326 | FSCN1 | 1.77 | 0.03673 | 1.5 | 0.16435 | miRanda; miRNATAP | -0.19 | 0.01021 | 26359764 | Down regulation of miR 326 is associated with poor prognosis and promotes growth and metastasis by targeting FSCN1 in gastric cancer; The aim of this study is to identify the role of miR-326 in gastric cancer and clarify the regulation of Fascin1 FSCN1 by miR-326; Furthermore we identified FSCN1 as the functional target of miR-326 by directly targeting the 3'-UTR of FSCN1; Our study demonstrated that miR-326 overexpression was a poor prognostic marker for gastric cancer patients and miR-326 served as a tumor suppressor in gastric cancer via directly regulating FSCN1 |
| 49 | hsa-miR-326 | GFRA1 | 1.77 | 0.03673 | -6.72 | 0 | miRNATAP | -0.24 | 0.00656 | NA | |
| 50 | hsa-miR-326 | GNA11 | 1.77 | 0.03673 | -0.33 | 0.56791 | mirMAP | -0.1 | 0.01074 | NA | |
| 51 | hsa-miR-326 | GNAO1 | 1.77 | 0.03673 | -2.87 | 0.00104 | MirTarget; PITA; miRanda; miRNATAP | -0.13 | 0.03248 | NA | |
| 52 | hsa-miR-326 | GNB3 | 1.77 | 0.03673 | -1.72 | 0.044 | miRanda | -0.12 | 0.0401 | NA | |
| 53 | hsa-miR-326 | GPR153 | 1.77 | 0.03673 | -0.29 | 0.70065 | miRanda; miRNATAP | -0.11 | 0.02687 | NA | |
| 54 | hsa-miR-326 | GPR83 | 1.77 | 0.03673 | -0.32 | 0.72938 | MirTarget; miRanda | -0.13 | 0.04175 | NA | |
| 55 | hsa-miR-326 | GRIK5 | 1.77 | 0.03673 | -4.73 | 0 | miRanda | -0.17 | 0.00521 | NA | |
| 56 | hsa-miR-326 | H2AFY2 | 1.77 | 0.03673 | -0.24 | 0.81346 | miRanda | -0.2 | 0.00432 | NA | |
| 57 | hsa-miR-326 | HSF4 | 1.77 | 0.03673 | 1.11 | 0.06599 | miRanda | -0.11 | 0.00881 | NA | |
| 58 | hsa-miR-326 | ITGA2 | 1.77 | 0.03673 | 2.49 | 0.01604 | PITA | -0.18 | 0.009 | NA | |
| 59 | hsa-miR-326 | ITGA7 | 1.77 | 0.03673 | -3.96 | 0 | miRanda | -0.15 | 0.00228 | NA | |
| 60 | hsa-miR-326 | ITPRIP | 1.77 | 0.03673 | -0.51 | 0.43239 | MirTarget | -0.11 | 0.01082 | NA | |
| 61 | hsa-miR-326 | KCNIP2 | 1.77 | 0.03673 | -0 | 0.99501 | PITA; miRanda; miRNATAP | -0.11 | 0.00407 | NA | |
| 62 | hsa-miR-326 | KCNQ4 | 1.77 | 0.03673 | -2.57 | 0.03505 | MirTarget; miRNATAP | -0.18 | 0.03134 | NA | |
| 63 | hsa-miR-326 | KCTD15 | 1.77 | 0.03673 | -0.19 | 0.80405 | PITA; miRanda; miRNATAP | -0.23 | 1.0E-5 | NA | |
| 64 | hsa-miR-326 | KLF8 | 1.77 | 0.03673 | -1.13 | 0.35589 | miRanda | -0.22 | 0.00657 | NA | |
| 65 | hsa-miR-326 | KLHL21 | 1.77 | 0.03673 | -0.33 | 0.5637 | MirTarget; miRanda | -0.13 | 0.00053 | NA | |
| 66 | hsa-miR-326 | KRBA2 | 1.77 | 0.03673 | -1.18 | 0.09941 | miRanda; miRNATAP | -0.17 | 0.00029 | NA | |
| 67 | hsa-miR-326 | KREMEN1 | 1.77 | 0.03673 | 0.89 | 0.26034 | miRanda | -0.15 | 0.00546 | NA | |
| 68 | hsa-miR-326 | KRT31 | 1.77 | 0.03673 | 4.88 | 0.02734 | miRanda; miRNATAP | -0.39 | 0.00937 | NA | |
| 69 | hsa-miR-326 | LCN10 | 1.77 | 0.03673 | -6.31 | 0 | miRanda | -0.2 | 0.01121 | NA | |
| 70 | hsa-miR-326 | LRRC8E | 1.77 | 0.03673 | 3.52 | 0 | miRanda | -0.11 | 0.00604 | NA | |
| 71 | hsa-miR-326 | LTBP4 | 1.77 | 0.03673 | -3.6 | 0 | mirMAP; miRNATAP | -0.11 | 0.01243 | NA | |
| 72 | hsa-miR-326 | MAML3 | 1.77 | 0.03673 | -1.6 | 0.02486 | miRanda | -0.14 | 0.0035 | NA | |
| 73 | hsa-miR-326 | MAP3K9 | 1.77 | 0.03673 | 3.79 | 0 | mirMAP | -0.12 | 0.00534 | NA | |
| 74 | hsa-miR-326 | MAPKBP1 | 1.77 | 0.03673 | 0.17 | 0.78357 | mirMAP | -0.19 | 0 | NA | |
| 75 | hsa-miR-326 | MCAM | 1.77 | 0.03673 | -2.9 | 6.0E-5 | miRanda | -0.12 | 0.01465 | NA | |
| 76 | hsa-miR-326 | MDGA1 | 1.77 | 0.03673 | -1.44 | 0.15641 | mirMAP | -0.14 | 0.03607 | NA | |
| 77 | hsa-miR-326 | MGAT5 | 1.77 | 0.03673 | 0.24 | 0.82061 | mirMAP | -0.15 | 0.03321 | NA | |
| 78 | hsa-miR-326 | MICALL1 | 1.77 | 0.03673 | 0.73 | 0.27209 | miRanda; mirMAP | -0.11 | 0.01816 | NA | |
| 79 | hsa-miR-326 | MNT | 1.77 | 0.03673 | -0.61 | 0.04674 | miRNATAP | -0.11 | 0 | NA | |
| 80 | hsa-miR-326 | MRC2 | 1.77 | 0.03673 | -1.84 | 0.00521 | miRanda | -0.15 | 0.00104 | NA | |
| 81 | hsa-miR-326 | MUC15 | 1.77 | 0.03673 | 4.89 | 0.01409 | MirTarget; miRanda | -0.31 | 0.02129 | NA | |
| 82 | hsa-miR-326 | N4BP3 | 1.77 | 0.03673 | 1.96 | 0.00326 | mirMAP | -0.15 | 0.00118 | NA | |
| 83 | hsa-miR-326 | NAB2 | 1.77 | 0.03673 | -0.9 | 0.04124 | mirMAP | -0.1 | 0.00067 | NA | |
| 84 | hsa-miR-326 | NAV1 | 1.77 | 0.03673 | 0.37 | 0.59295 | mirMAP; miRNATAP | -0.11 | 0.01763 | NA | |
| 85 | hsa-miR-326 | NAV2 | 1.77 | 0.03673 | 0.39 | 0.61103 | MirTarget; miRanda | -0.15 | 0.00313 | NA | |
| 86 | hsa-miR-326 | NAV3 | 1.77 | 0.03673 | -4.15 | 0.00061 | MirTarget; miRanda | -0.24 | 0.00392 | NA | |
| 87 | hsa-miR-326 | NFIX | 1.77 | 0.03673 | -2.04 | 0.00019 | PITA; mirMAP | -0.15 | 5.0E-5 | NA | |
| 88 | hsa-miR-326 | NGB | 1.77 | 0.03673 | 4 | 0.07094 | miRanda | -0.3 | 0.04213 | NA | |
| 89 | hsa-miR-326 | NGFR | 1.77 | 0.03673 | -0.95 | 0.54765 | miRanda; mirMAP | -0.21 | 0.04646 | NA | |
| 90 | hsa-miR-326 | NIPSNAP3B | 1.77 | 0.03673 | -2.33 | 0.00011 | miRanda | -0.11 | 0.01036 | NA | |
| 91 | hsa-miR-326 | NOS1 | 1.77 | 0.03673 | -1 | 0.51604 | mirMAP | -0.31 | 0.0028 | NA | |
| 92 | hsa-miR-326 | NOTCH1 | 1.77 | 0.03673 | 0.77 | 0.22007 | miRNAWalker2 validate; miRTarBase | -0.13 | 0.00292 | NA | |
| 93 | hsa-miR-326 | NRARP | 1.77 | 0.03673 | 1.51 | 0.04246 | MirTarget; miRanda | -0.11 | 0.02502 | NA | |
| 94 | hsa-miR-326 | NRIP2 | 1.77 | 0.03673 | -3.76 | 0 | miRanda | -0.1 | 0.01061 | NA | |
| 95 | hsa-miR-326 | NRIP3 | 1.77 | 0.03673 | 0.14 | 0.8767 | miRanda | -0.14 | 0.02122 | NA | |
| 96 | hsa-miR-326 | PCDHB7 | 1.77 | 0.03673 | -4.18 | 0 | miRanda | -0.12 | 0.04179 | NA | |
| 97 | hsa-miR-326 | PCP4L1 | 1.77 | 0.03673 | 1.23 | 0.56855 | miRanda | -0.36 | 0.0125 | NA | |
| 98 | hsa-miR-326 | PGAM4 | 1.77 | 0.03673 | 0.54 | 0.29578 | miRanda | -0.1 | 0.00384 | NA | |
| 99 | hsa-miR-326 | PHLDB2 | 1.77 | 0.03673 | -1 | 0.30454 | miRanda | -0.18 | 0.00531 | NA | |
| 100 | hsa-miR-326 | PITPNM3 | 1.77 | 0.03673 | 0.65 | 0.34932 | mirMAP | -0.15 | 0.00162 | NA | |
| 101 | hsa-miR-326 | PKD1 | 1.77 | 0.03673 | -1.56 | 3.0E-5 | miRanda | -0.11 | 1.0E-5 | NA | |
| 102 | hsa-miR-326 | PLEKHG3 | 1.77 | 0.03673 | 0.05 | 0.91621 | MirTarget; miRanda | -0.16 | 0 | NA | |
| 103 | hsa-miR-326 | PLIN4 | 1.77 | 0.03673 | -5.37 | 0 | mirMAP | -0.24 | 0.00043 | NA | |
| 104 | hsa-miR-326 | PLP1 | 1.77 | 0.03673 | -7.11 | 0 | miRanda | -0.23 | 0.01529 | NA | |
| 105 | hsa-miR-326 | PLS3 | 1.77 | 0.03673 | -0.66 | 0.34249 | miRanda | -0.11 | 0.02503 | NA | |
| 106 | hsa-miR-326 | PRICKLE2 | 1.77 | 0.03673 | -3.45 | 0 | miRanda; miRNATAP | -0.11 | 0.02483 | NA | |
| 107 | hsa-miR-326 | PRIMA1 | 1.77 | 0.03673 | -2.15 | 0.13417 | miRanda | -0.3 | 0.00191 | NA | |
| 108 | hsa-miR-326 | PRRT4 | 1.77 | 0.03673 | 1.49 | 0.28873 | mirMAP | -0.21 | 0.02995 | NA | |
| 109 | hsa-miR-326 | RAPGEF3 | 1.77 | 0.03673 | -2.31 | 0.00431 | mirMAP | -0.11 | 0.03958 | NA | |
| 110 | hsa-miR-326 | RBM20 | 1.77 | 0.03673 | -2.15 | 0.07716 | MirTarget; miRanda | -0.22 | 0.00725 | NA | |
| 111 | hsa-miR-326 | RCBTB2 | 1.77 | 0.03673 | -1.05 | 0.03978 | miRanda | -0.11 | 0.00141 | NA | |
| 112 | hsa-miR-326 | RCOR1 | 1.77 | 0.03673 | 1.16 | 0.00399 | MirTarget; PITA; miRNATAP | -0.11 | 5.0E-5 | NA | |
| 113 | hsa-miR-326 | REEP1 | 1.77 | 0.03673 | -3.43 | 0.00235 | miRanda | -0.16 | 0.03351 | NA | |
| 114 | hsa-miR-326 | RGMA | 1.77 | 0.03673 | -2.04 | 0.0628 | mirMAP | -0.21 | 0.00372 | NA | |
| 115 | hsa-miR-326 | RNF112 | 1.77 | 0.03673 | -2.33 | 0.00498 | MirTarget; miRanda | -0.15 | 0.00688 | NA | |
| 116 | hsa-miR-326 | S100A7A | 1.77 | 0.03673 | 5.64 | 0.03216 | miRanda | -0.38 | 0.0315 | NA | |
| 117 | hsa-miR-326 | SAMD8 | 1.77 | 0.03673 | 0.23 | 0.64697 | miRanda | -0.11 | 0.00137 | NA | |
| 118 | hsa-miR-326 | SCN2B | 1.77 | 0.03673 | -6.08 | 0 | miRNATAP | -0.22 | 0.0065 | NA | |
| 119 | hsa-miR-326 | SCN4B | 1.77 | 0.03673 | -4.17 | 3.0E-5 | mirMAP | -0.22 | 0.00099 | NA | |
| 120 | hsa-miR-326 | SDK2 | 1.77 | 0.03673 | 0.18 | 0.89764 | miRanda; miRNATAP | -0.19 | 0.04352 | NA | |
| 121 | hsa-miR-326 | SEMA6D | 1.77 | 0.03673 | -2.2 | 0.0863 | PITA; miRanda; miRNATAP | -0.21 | 0.01641 | NA | |
| 122 | hsa-miR-326 | SETBP1 | 1.77 | 0.03673 | -2.4 | 0.00499 | miRanda | -0.14 | 0.016 | NA | |
| 123 | hsa-miR-326 | SH3PXD2A | 1.77 | 0.03673 | -0.79 | 0.07818 | MirTarget; PITA; miRanda; miRNATAP | -0.1 | 0.00059 | NA | |
| 124 | hsa-miR-326 | SHANK3 | 1.77 | 0.03673 | -2.1 | 0 | PITA | -0.13 | 3.0E-5 | NA | |
| 125 | hsa-miR-326 | SLC25A34 | 1.77 | 0.03673 | -1.35 | 0.03269 | MirTarget; miRanda; miRNATAP | -0.13 | 0.00155 | NA | |
| 126 | hsa-miR-326 | SLC5A10 | 1.77 | 0.03673 | 3.08 | 8.0E-5 | mirMAP | -0.15 | 0.00485 | NA | |
| 127 | hsa-miR-326 | SLC6A2 | 1.77 | 0.03673 | -0.45 | 0.80473 | miRanda | -0.26 | 0.03677 | NA | |
| 128 | hsa-miR-326 | SLC9A3 | 1.77 | 0.03673 | 1.6 | 0.32908 | MirTarget; miRanda | -0.29 | 0.00903 | NA | |
| 129 | hsa-miR-326 | SLCO3A1 | 1.77 | 0.03673 | 0.82 | 0.24485 | miRanda; miRNATAP | -0.12 | 0.00858 | NA | |
| 130 | hsa-miR-326 | SLFNL1 | 1.77 | 0.03673 | -0.19 | 0.712 | miRanda | -0.12 | 0.00054 | NA | |
| 131 | hsa-miR-326 | SOX10 | 1.77 | 0.03673 | -4.64 | 0.00011 | miRanda | -0.29 | 0.00029 | NA | |
| 132 | hsa-miR-326 | SPRR2A | 1.77 | 0.03673 | 6.96 | 0.01093 | miRanda | -0.49 | 0.00786 | NA | |
| 133 | hsa-miR-326 | SPRR2B | 1.77 | 0.03673 | 2.92 | 0.17918 | miRanda | -0.52 | 0.00041 | NA | |
| 134 | hsa-miR-326 | SPRR2D | 1.77 | 0.03673 | 5.84 | 0.03024 | miRanda | -0.38 | 0.03735 | NA | |
| 135 | hsa-miR-326 | SPRR2E | 1.77 | 0.03673 | 5.29 | 0.05497 | miRanda | -0.57 | 0.00223 | NA | |
| 136 | hsa-miR-326 | SPRR2F | 1.77 | 0.03673 | 3.01 | 0.20008 | miRanda | -0.62 | 8.0E-5 | NA | |
| 137 | hsa-miR-326 | SVIL | 1.77 | 0.03673 | -2.17 | 0.00017 | miRanda | -0.18 | 0 | NA | |
| 138 | hsa-miR-326 | SYNE2 | 1.77 | 0.03673 | 0.65 | 0.16476 | miRanda | -0.11 | 0.00044 | NA | |
| 139 | hsa-miR-326 | SYNGAP1 | 1.77 | 0.03673 | -1.23 | 0.00533 | PITA; mirMAP; miRNATAP | -0.12 | 4.0E-5 | NA | |
| 140 | hsa-miR-326 | SYNPO2L | 1.77 | 0.03673 | 1.12 | 0.31037 | MirTarget; miRNATAP | -0.2 | 0.00828 | NA | |
| 141 | hsa-miR-326 | TAL1 | 1.77 | 0.03673 | -3.9 | 0 | miRanda; miRNATAP | -0.16 | 0.00071 | NA | |
| 142 | hsa-miR-326 | TMPRSS11A | 1.77 | 0.03673 | 6.89 | 0.01527 | miRanda | -0.45 | 0.01911 | NA | |
| 143 | hsa-miR-326 | TMPRSS11BNL | 1.77 | 0.03673 | 2.52 | 0.16857 | miRanda | -0.25 | 0.04746 | NA | |
| 144 | hsa-miR-326 | TMPRSS11D | 1.77 | 0.03673 | 5.28 | 0.07997 | miRanda | -0.48 | 0.01826 | NA | |
| 145 | hsa-miR-326 | TMPRSS11F | 1.77 | 0.03673 | 4.73 | 0.02827 | miRanda | -0.43 | 0.00286 | NA | |
| 146 | hsa-miR-326 | TNK2 | 1.77 | 0.03673 | 0.58 | 0.23452 | miRanda; miRNATAP | -0.12 | 0.00036 | NA | |
| 147 | hsa-miR-326 | TRIM62 | 1.77 | 0.03673 | 0.96 | 0.03528 | mirMAP | -0.12 | 4.0E-5 | NA | |
| 148 | hsa-miR-326 | TRPV3 | 1.77 | 0.03673 | 4.28 | 0.00249 | MirTarget; miRanda | -0.3 | 0.00179 | NA | |
| 149 | hsa-miR-326 | TUBB3 | 1.77 | 0.03673 | 2.6 | 0.00337 | miRanda | -0.12 | 0.0486 | NA | |
| 150 | hsa-miR-326 | UNC119B | 1.77 | 0.03673 | -1.01 | 0.02913 | MirTarget | -0.12 | 7.0E-5 | NA |
| Num | GO | Overlap | Size | P Value | Adj. P Value |
|---|
| Num | GO | Overlap | Size | P Value | Adj. P Value |
|---|
| Num | GO | Overlap | Size | P Value | Adj. P Value |
|---|---|---|---|---|---|
| 1 | CELL PROJECTION | 37 | 1786 | 7.561e-08 | 4.416e-05 |
| 2 | CELL JUNCTION | 25 | 1151 | 6.168e-06 | 0.001801 |
| 3 | MEMBRANE REGION | 24 | 1134 | 1.486e-05 | 0.002892 |
| 4 | PLASMA MEMBRANE REGION | 21 | 929 | 2.054e-05 | 0.002998 |
| 5 | NEURON PART | 25 | 1265 | 3.052e-05 | 0.003 |
| 6 | CORNIFIED ENVELOPE | 5 | 45 | 3.082e-05 | 0.003 |
| 7 | BASAL PART OF CELL | 5 | 51 | 5.699e-05 | 0.004754 |
| 8 | CELL PROJECTION PART | 20 | 946 | 8.298e-05 | 0.006057 |
| 9 | INTRINSIC COMPONENT OF PLASMA MEMBRANE | 28 | 1649 | 0.0001402 | 0.009095 |
| 10 | CELL PROJECTION MEMBRANE | 10 | 298 | 0.0001636 | 0.009552 |
| 11 | ANCHORING JUNCTION | 13 | 489 | 0.0001805 | 0.009585 |
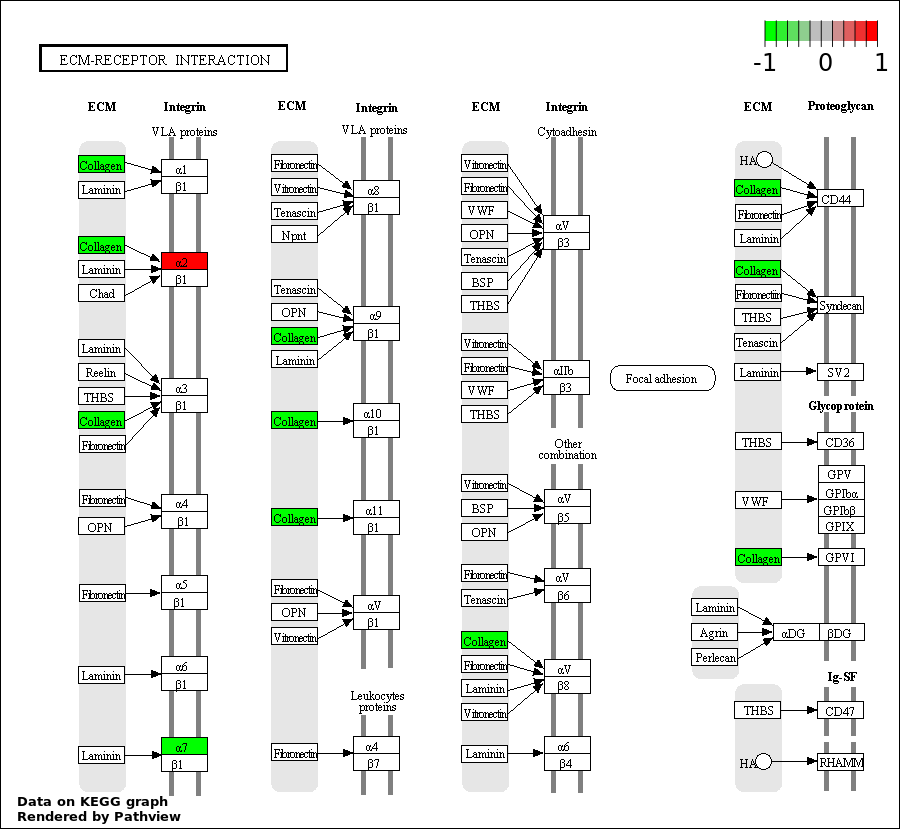
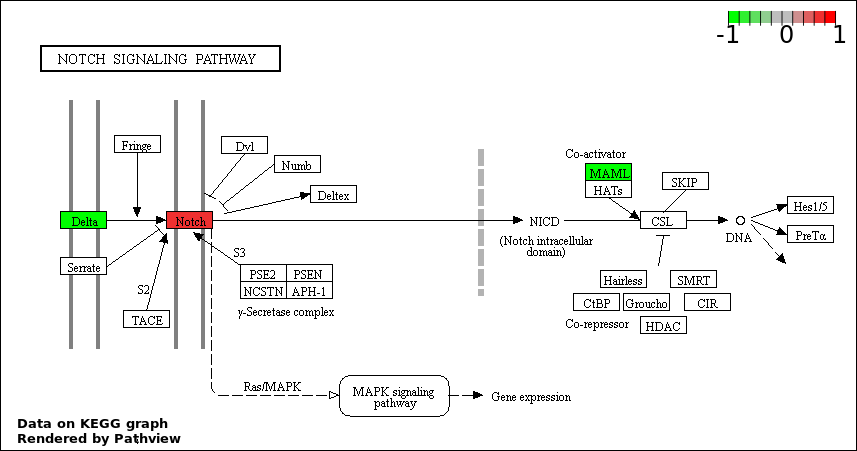
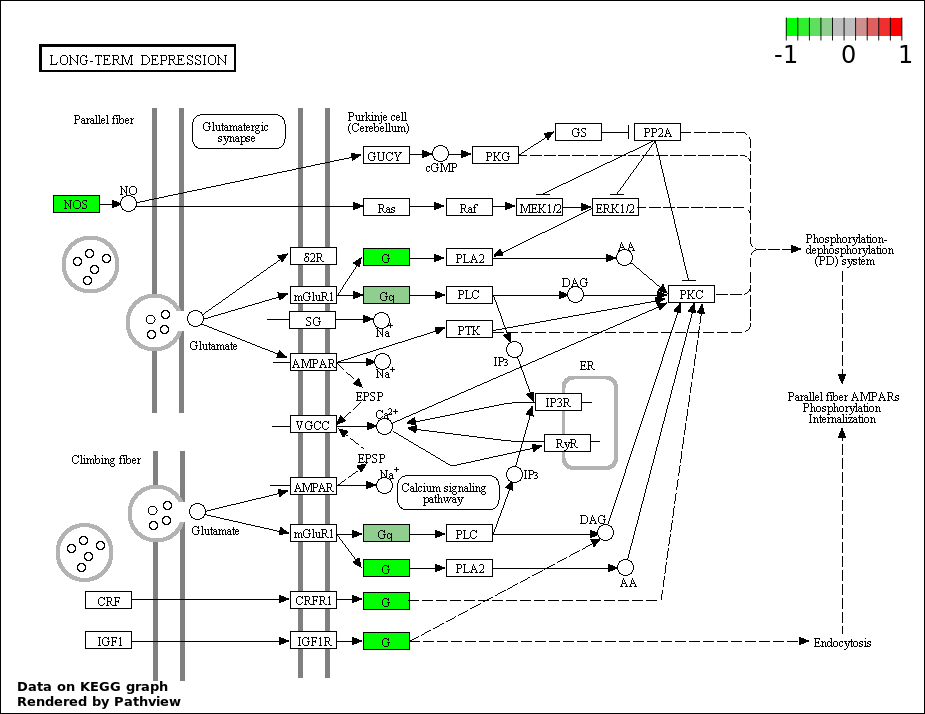
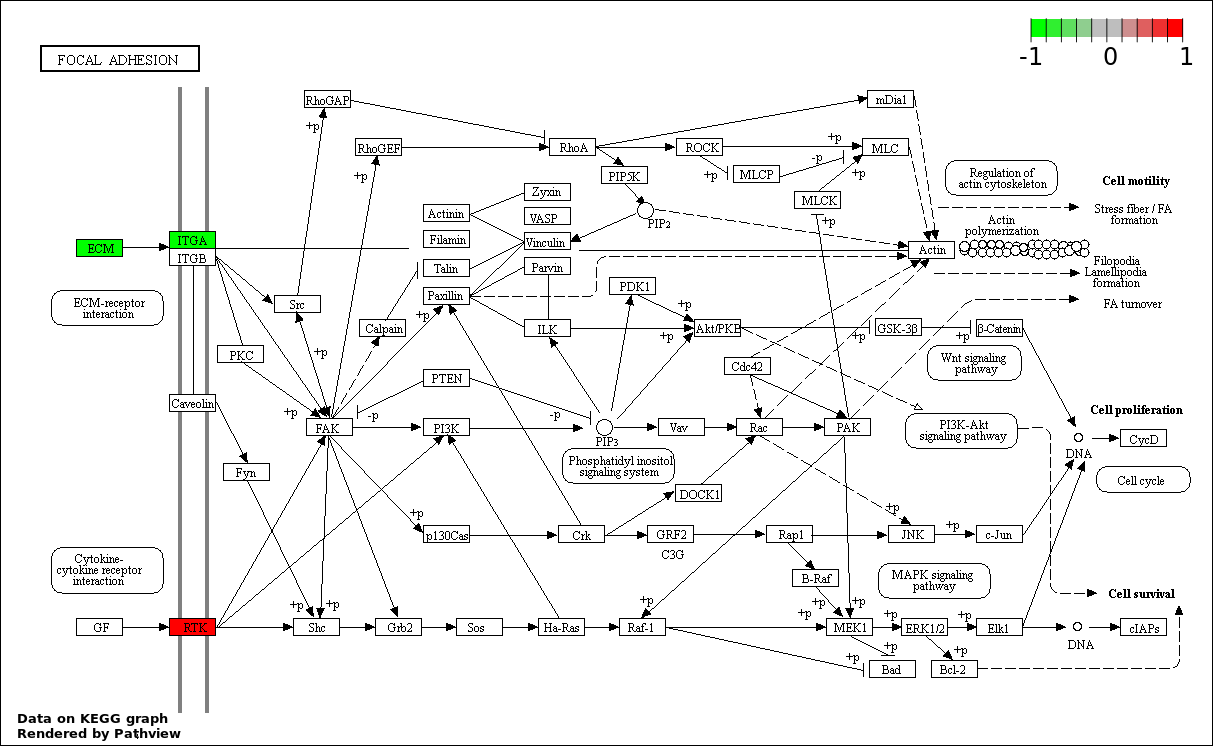
Over-represented Pathway
| Num | Pathway | Pathview | Overlap | Size | P Value | Adj. P Value |
|---|---|---|---|---|---|---|
| 1 | hsa04512_ECM.receptor_interaction | 4 | 85 | 0.00505 | 0.5864 | |
| 2 | hsa04330_Notch_signaling_pathway | 3 | 47 | 0.006516 | 0.5864 | |
| 3 | hsa04730_Long.term_depression | 3 | 70 | 0.01922 | 1 | |
| 4 | hsa04510_Focal_adhesion | 5 | 200 | 0.02359 | 1 | |
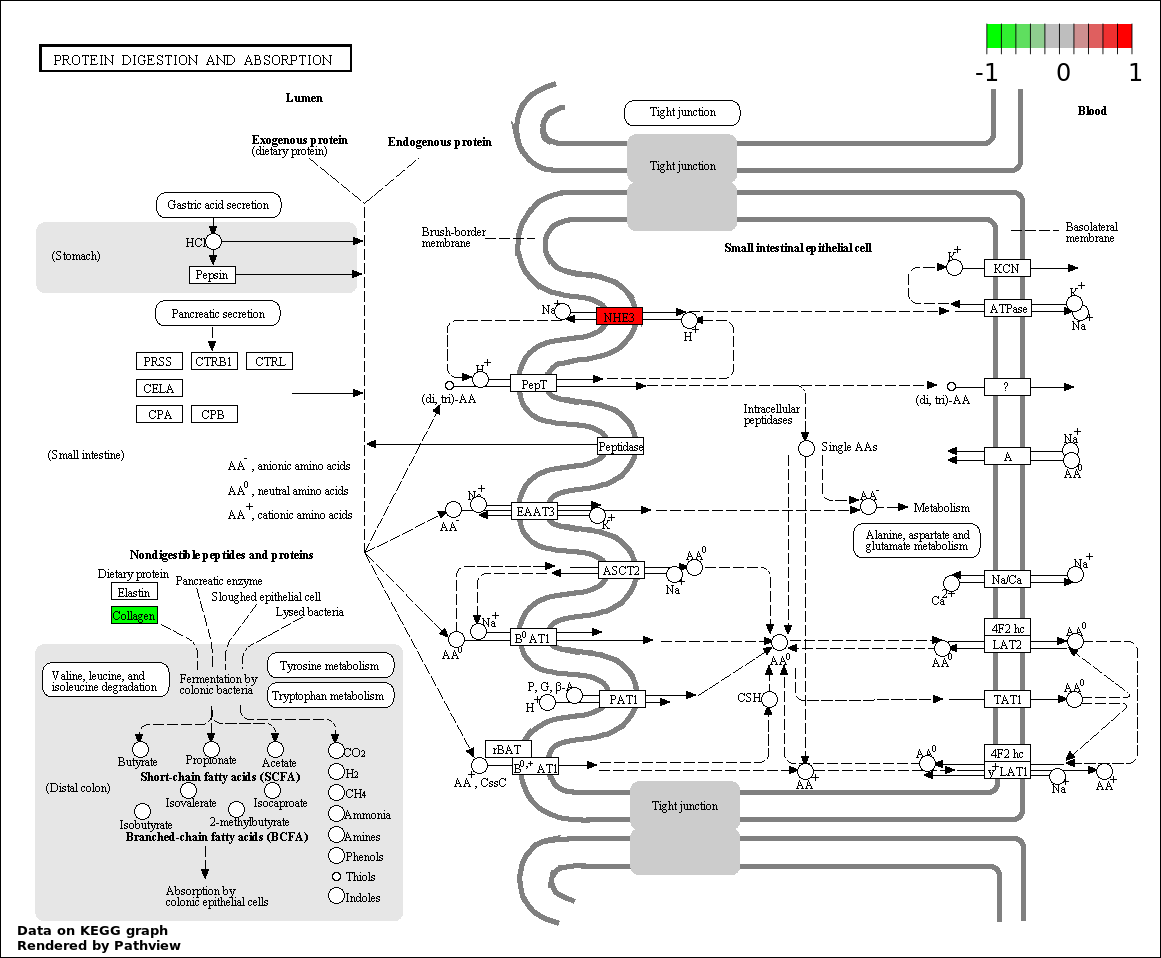
| 5 | hsa04974_Protein_digestion_and_absorption | 3 | 81 | 0.02811 | 1 | |
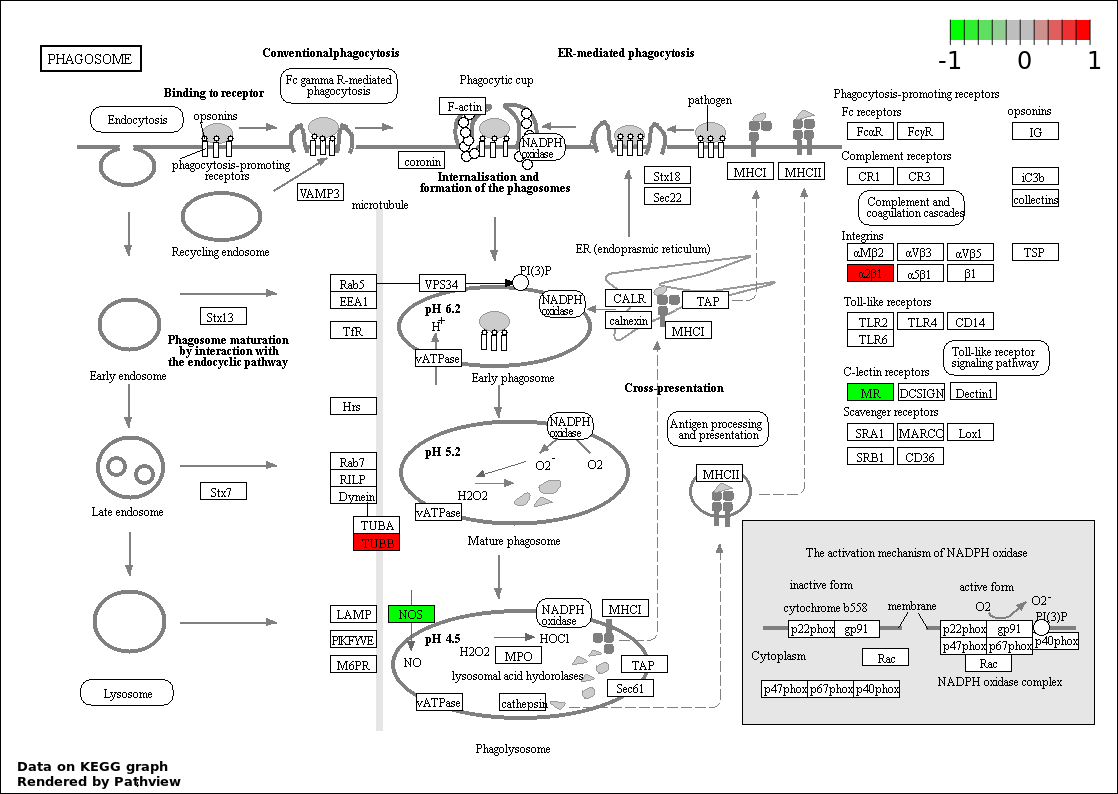
| 6 | hsa04145_Phagosome | 4 | 156 | 0.03824 | 1 | |
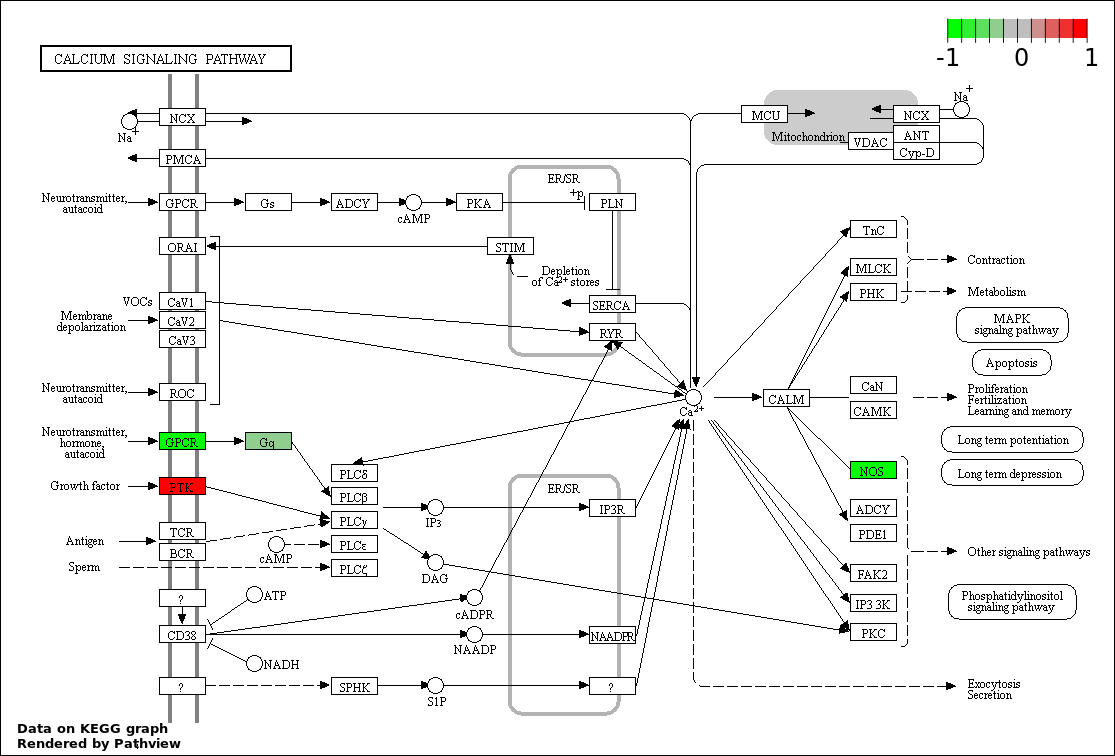
| 7 | hsa04020_Calcium_signaling_pathway | 4 | 177 | 0.05604 | 1 | |
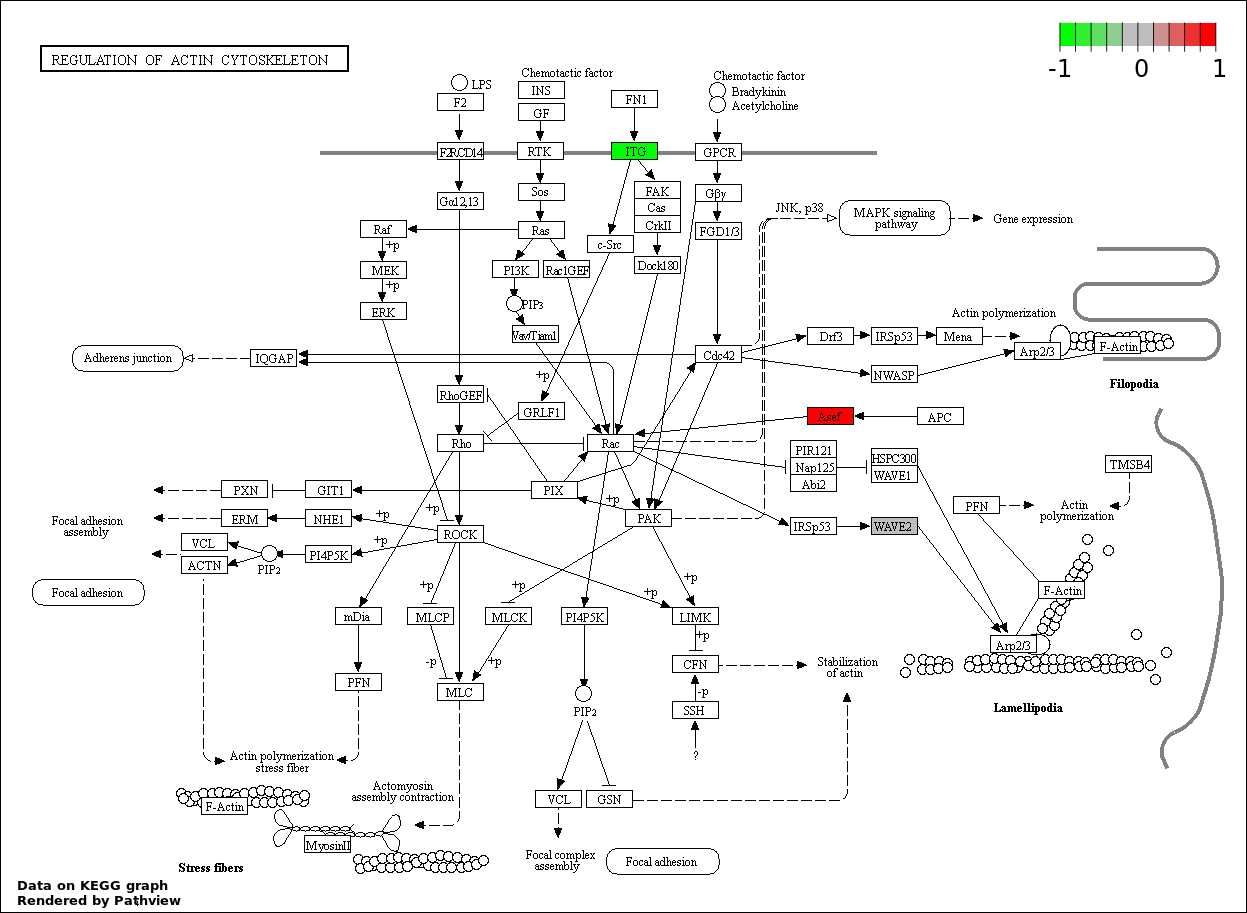
| 8 | hsa04810_Regulation_of_actin_cytoskeleton | 4 | 214 | 0.09641 | 1 | |
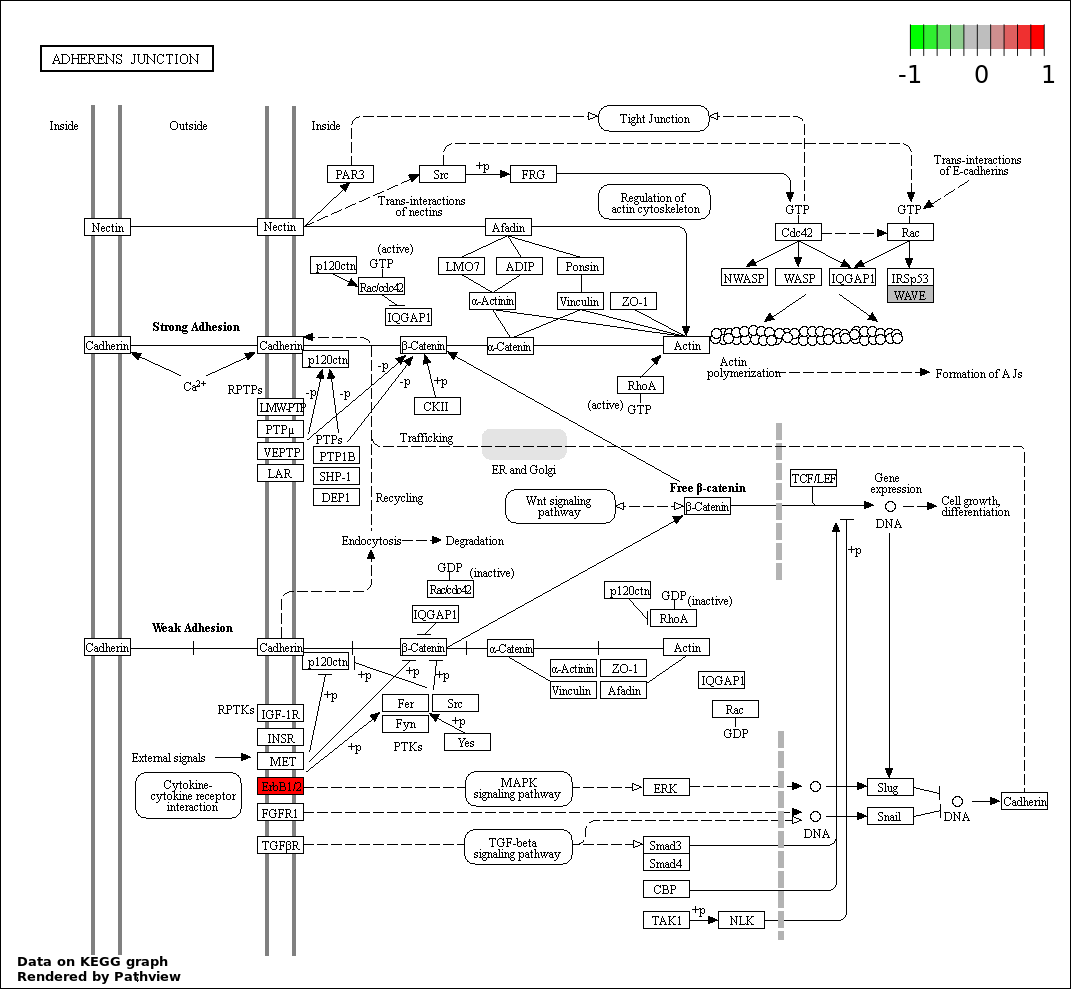
| 9 | hsa04520_Adherens_junction | 2 | 73 | 0.1182 | 1 | |
| 10 | hsa04151_PI3K_AKT_signaling_pathway | 5 | 351 | 0.1567 | 1 | |
| 11 | hsa04540_Gap_junction | 2 | 90 | 0.1653 | 1 | |
| 12 | hsa04270_Vascular_smooth_muscle_contraction | 2 | 116 | 0.2419 | 1 | |
| 13 | hsa04670_Leukocyte_transendothelial_migration | 2 | 117 | 0.2449 | 1 | |
| 14 | hsa04360_Axon_guidance | 2 | 130 | 0.2839 | 1 | |
| 15 | hsa04530_Tight_junction | 2 | 133 | 0.2928 | 1 | |
| 16 | hsa04014_Ras_signaling_pathway | 3 | 236 | 0.2992 | 1 | |
| 17 | hsa04514_Cell_adhesion_molecules_.CAMs. | 2 | 136 | 0.3018 | 1 |