This regulatory network was inferred from the input dataset. The miRNAs and mRNAs are
presented as round and rectangle nodes respectively. The numerical value popped up upon mouse over the gene node is the log2 transformed fold-change of the gene expression between the two groups. All of the nodes are clickable, and the detailed information of the miRNAs/mRNAs and related cancer pathway will be displayed in another window. The edges between nodes are supported by both interactions (predicted or experimentally verified) and correlations learnt from cancer dataset. The numerical value popped up upon mouse over the edge is the correlation beat value (effect size) between the two nodes. The experimental evidences of the edges reported in previous cancer studies are highlighted by red/orange color. All of these information can be accessed by the "mouse-over" action. This network shows a full map of the miRNA-mRNA regulation of the input gene list(s), and the hub miRNAs (with the high network degree/betweenness centrality) would be the potential cancer drivers or tumor suppressors. The full result table can be accessed in the "Regulations" tab.
"miRNACancerMAP" is also a network visualization tool for users to draw their regulatory network by personal customization. Users can set the complexity of the network by limiting the number of nodes or edges. And the color of the nodes can be defined by different categories of the mRNAs and miRNAs, such as Gene-Ontology, pathway, and expression status. Users can also select to use network degree or network betweenness centrality to define the node size. And edges can be black or colored by the correlation. Purple edge means negative correlation (mostly found between miRNA and mRNA), and blue edge means positive correlation (found in PPI or miRNA-miRNA sponge effect). We can also add the protein-protein interactions (PPI) into the network. This result will show the cluster of genes regulated by some specific miRNAs. Additionally, miRNA-miRNA edges can be added by the "miRNA sponge" button, presenting some clusters of miRNAs that have the interactions via sponge effect.
miRNA-gene regulations
| Num | microRNA | Gene | miRNA log2FC | miRNA pvalue | Gene log2FC | Gene pvalue | Interaction | Correlation beta | Correlation P-value | PMID | Reported in cancer studies |
|---|---|---|---|---|---|---|---|---|---|---|---|
| 1 | hsa-miR-139-3p | SOX4 | -2.53 | 0 | 0.75 | 0.00274 | miRNATAP | -0.34 | 0 | NA | |
| 2 | hsa-miR-204-5p | SOX4 | -0.54 | 0.03309 | 0.75 | 0.00274 | miRNAWalker2 validate; miRNATAP | -0.21 | 1.0E-5 | 26323722; 24984017 | Upregulation of microRNA 204 inhibits cell proliferation migration and invasion in human renal cell carcinoma cells by downregulating SOX4;Decreased miR 204 in H pylori associated gastric cancer promotes cancer cell proliferation and invasion by targeting SOX4; Luciferase assay revealed that SOX4 was target gene of miR-204 which was found up-regulated in H pylori positive tissues; Down-regulation of miR-204 and over-expression of SOX4 promoted epithelial-mesenchymal transition process; Taken together our findings demonstrated that miR-204 may act as a tumor suppressor in H pylori induced gastric cancer by targeting SOX4 |
| 3 | hsa-miR-30e-3p | SOX4 | -1.21 | 0 | 0.75 | 0.00274 | mirMAP | -0.52 | 0 | NA | |
| 4 | hsa-miR-32-5p | SOX4 | 0.08 | 0.54898 | 0.75 | 0.00274 | MirTarget; miRNATAP | -0.19 | 0.03899 | NA | |
| 5 | hsa-miR-34a-5p | SOX4 | 1.04 | 0 | 0.75 | 0.00274 | miRNATAP | -0.19 | 0.03067 | NA | |
| 6 | hsa-miR-616-3p | SOX4 | -0.7 | 2.0E-5 | 0.75 | 0.00274 | mirMAP | -0.16 | 0.03454 | NA | |
| 7 | hsa-miR-616-5p | SOX4 | 0.15 | 0.40284 | 0.75 | 0.00274 | MirTarget; mirMAP; miRNATAP | -0.23 | 0.00081 | NA | |
| 8 | hsa-miR-618 | SOX4 | 0.14 | 0.51715 | 0.75 | 0.00274 | PITA; miRNATAP | -0.24 | 7.0E-5 | NA |
| Num | GO | Overlap | Size | P Value | Adj. P Value |
|---|---|---|---|---|---|
| 1 | RESPONSE TO STEROID HORMONE | 10 | 497 | 1.214e-11 | 5.647e-08 |
| 2 | RESPONSE TO ORGANIC CYCLIC COMPOUND | 11 | 917 | 2.038e-10 | 3.162e-07 |
| 3 | RESPONSE TO LIPID | 11 | 888 | 1.447e-10 | 3.162e-07 |
| 4 | RESPONSE TO HORMONE | 10 | 893 | 3.682e-09 | 4.234e-06 |
| 5 | SEX DIFFERENTIATION | 7 | 266 | 4.549e-09 | 4.234e-06 |
| 6 | RESPONSE TO OXYGEN CONTAINING COMPOUND | 11 | 1381 | 1.537e-08 | 1.192e-05 |
| 7 | CELLULAR HORMONE METABOLIC PROCESS | 5 | 104 | 5.028e-08 | 3.342e-05 |
| 8 | CELLULAR RESPONSE TO ORGANIC CYCLIC COMPOUND | 7 | 465 | 2.094e-07 | 0.0001218 |
| 9 | REGULATION OF HORMONE LEVELS | 7 | 478 | 2.524e-07 | 0.0001305 |
| 10 | CELLULAR RESPONSE TO ORGANIC SUBSTANCE | 11 | 1848 | 3.11e-07 | 0.0001447 |
| 11 | RESPONSE TO ENDOGENOUS STIMULUS | 10 | 1450 | 3.665e-07 | 0.000155 |
| 12 | HORMONE METABOLIC PROCESS | 5 | 164 | 4.895e-07 | 0.0001898 |
| 13 | CELLULAR RESPONSE TO HORMONE STIMULUS | 7 | 552 | 6.663e-07 | 0.0002385 |
| 14 | NEGATIVE REGULATION OF CELL DEATH | 8 | 872 | 9.981e-07 | 0.0003317 |
| 15 | DEVELOPMENTAL PROCESS INVOLVED IN REPRODUCTION | 7 | 602 | 1.191e-06 | 0.0003695 |
| 16 | REPRODUCTIVE SYSTEM DEVELOPMENT | 6 | 408 | 2.113e-06 | 0.0005784 |
| 17 | CELLULAR RESPONSE TO STEROID HORMONE STIMULUS | 5 | 218 | 1.994e-06 | 0.0005784 |
| 18 | RESPONSE TO TOXIC SUBSTANCE | 5 | 241 | 3.26e-06 | 0.0008426 |
| 19 | CELLULAR RESPONSE TO LIPID | 6 | 457 | 4.067e-06 | 0.000996 |
| 20 | REGULATION OF CELL DEATH | 9 | 1472 | 4.931e-06 | 0.001147 |
| 21 | TRICARBOXYLIC ACID METABOLIC PROCESS | 3 | 37 | 6.502e-06 | 0.001441 |
| 22 | RESPONSE TO NITROGEN COMPOUND | 7 | 859 | 1.248e-05 | 0.002573 |
| 23 | MALE SEX DIFFERENTIATION | 4 | 148 | 1.272e-05 | 0.002573 |
| 24 | RESPONSE TO ANTIBIOTIC | 3 | 47 | 1.348e-05 | 0.002614 |
| 25 | HORMONE MEDIATED SIGNALING PATHWAY | 4 | 158 | 1.646e-05 | 0.003064 |
| 26 | REPRODUCTION | 8 | 1297 | 1.908e-05 | 0.003414 |
| 27 | RESPONSE TO ALCOHOL | 5 | 362 | 2.342e-05 | 0.004036 |
| 28 | ORGANIC ACID METABOLIC PROCESS | 7 | 953 | 2.449e-05 | 0.004069 |
| 29 | NEGATIVE REGULATION OF CELL PROLIFERATION | 6 | 643 | 2.844e-05 | 0.004563 |
| 30 | CELLULAR RESPONSE TO ENDOGENOUS STIMULUS | 7 | 1008 | 3.516e-05 | 0.005338 |
| 31 | GLAND DEVELOPMENT | 5 | 395 | 3.557e-05 | 0.005338 |
| 32 | RESPONSE TO DRUG | 5 | 431 | 5.389e-05 | 0.007598 |
| 33 | REGULATION OF CELL PROLIFERATION | 8 | 1496 | 5.358e-05 | 0.007598 |
| 34 | NATURAL KILLER CELL DIFFERENTIATION | 2 | 12 | 6.233e-05 | 0.007632 |
| 35 | RESPONSE TO INSECTICIDE | 2 | 12 | 6.233e-05 | 0.007632 |
| 36 | RESPONSE TO ESTROGEN | 4 | 218 | 5.801e-05 | 0.007632 |
| 37 | RESPONSE TO EXTRACELLULAR STIMULUS | 5 | 441 | 6.009e-05 | 0.007632 |
| 38 | DEVELOPMENT OF PRIMARY SEXUAL CHARACTERISTICS | 4 | 216 | 5.597e-05 | 0.007632 |
| 39 | POSITIVE REGULATION OF GLUCONEOGENESIS | 2 | 13 | 7.362e-05 | 0.008783 |
| 40 | STEROID METABOLIC PROCESS | 4 | 237 | 8.023e-05 | 0.009105 |
| 41 | REGULATION OF MITOTIC CELL CYCLE | 5 | 468 | 7.961e-05 | 0.009105 |
| 42 | LIPID METABOLIC PROCESS | 7 | 1158 | 8.519e-05 | 0.009288 |
| 43 | PROGESTERONE METABOLIC PROCESS | 2 | 14 | 8.583e-05 | 0.009288 |
| 44 | RESPONSE TO INORGANIC SUBSTANCE | 5 | 479 | 8.884e-05 | 0.009395 |
| 45 | CELLULAR RESPONSE TO OXYGEN CONTAINING COMPOUND | 6 | 799 | 9.557e-05 | 0.009882 |
| Num | GO | Overlap | Size | P Value | Adj. P Value |
|---|---|---|---|---|---|
| 1 | TRANSCRIPTION FACTOR ACTIVITY RNA POLYMERASE II CORE PROMOTER PROXIMAL REGION SEQUENCE SPECIFIC BINDING | 6 | 328 | 5.935e-07 | 0.0005514 |
| 2 | TRANSCRIPTIONAL ACTIVATOR ACTIVITY RNA POLYMERASE II CORE PROMOTER PROXIMAL REGION SEQUENCE SPECIFIC BINDING | 5 | 226 | 2.38e-06 | 0.0008637 |
| 3 | CORE PROMOTER SEQUENCE SPECIFIC DNA BINDING | 4 | 101 | 2.789e-06 | 0.0008637 |
| 4 | CORE PROMOTER BINDING | 4 | 152 | 1.413e-05 | 0.001907 |
| 5 | TRANSCRIPTION FACTOR ACTIVITY DIRECT LIGAND REGULATED SEQUENCE SPECIFIC DNA BINDING | 3 | 48 | 1.437e-05 | 0.001907 |
| 6 | TRANSCRIPTIONAL ACTIVATOR ACTIVITY RNA POLYMERASE II TRANSCRIPTION REGULATORY REGION SEQUENCE SPECIFIC BINDING | 5 | 315 | 1.199e-05 | 0.001907 |
| 7 | OXYGEN BINDING | 3 | 47 | 1.348e-05 | 0.001907 |
| 8 | ENZYME BINDING | 9 | 1737 | 1.909e-05 | 0.002216 |
| 9 | STEROID HORMONE RECEPTOR ACTIVITY | 3 | 59 | 2.682e-05 | 0.002492 |
| 10 | RNA POLYMERASE II TRANSCRIPTION FACTOR ACTIVITY SEQUENCE SPECIFIC DNA BINDING | 6 | 629 | 2.512e-05 | 0.002492 |
| 11 | HORMONE BINDING | 3 | 65 | 3.59e-05 | 0.003032 |
| 12 | TRANSCRIPTION COACTIVATOR BINDING | 2 | 11 | 5.197e-05 | 0.004023 |
| 13 | BETA CATENIN BINDING | 3 | 84 | 7.738e-05 | 0.00553 |
| 14 | STEROID BINDING | 3 | 91 | 9.822e-05 | 0.006517 |
| 15 | NUCLEIC ACID BINDING TRANSCRIPTION FACTOR ACTIVITY | 7 | 1199 | 0.0001061 | 0.006574 |
| Num | GO | Overlap | Size | P Value | Adj. P Value |
|---|
Over-represented Pathway
| Num | Pathway | Pathview | Overlap | Size | P Value | Adj. P Value |
|---|---|---|---|---|---|---|
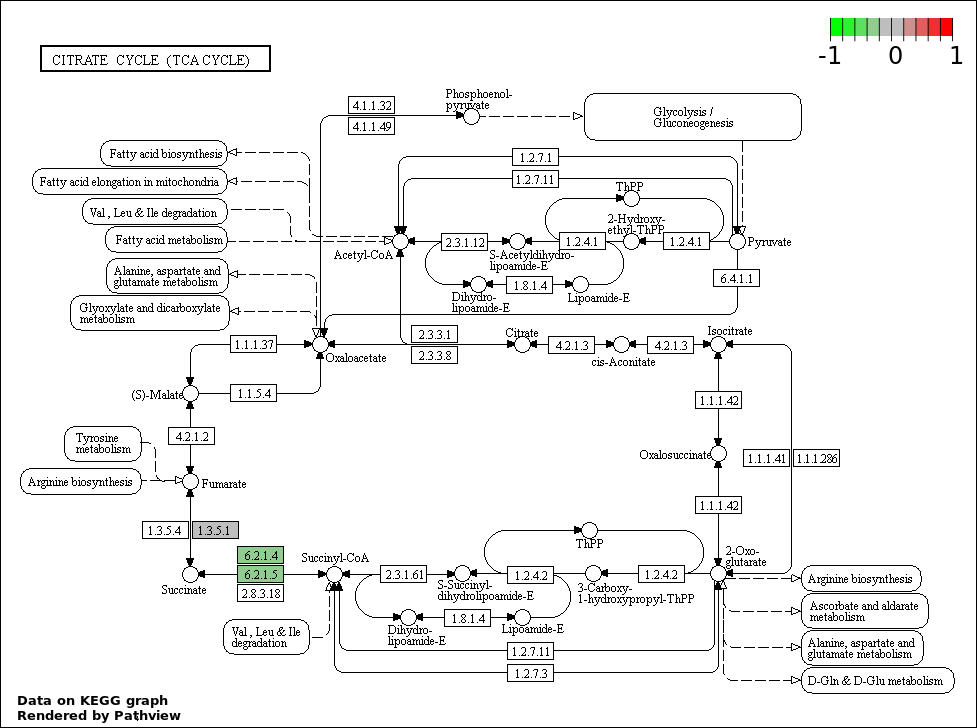
| 1 | hsa00020_Citrate_cycle_.TCA_cycle. | 2 | 30 | 0.0004064 | 0.07193 | |
| 2 | hsa00140_Steroid_hormone_biosynthesis | 2 | 57 | 0.001467 | 0.1089 | |
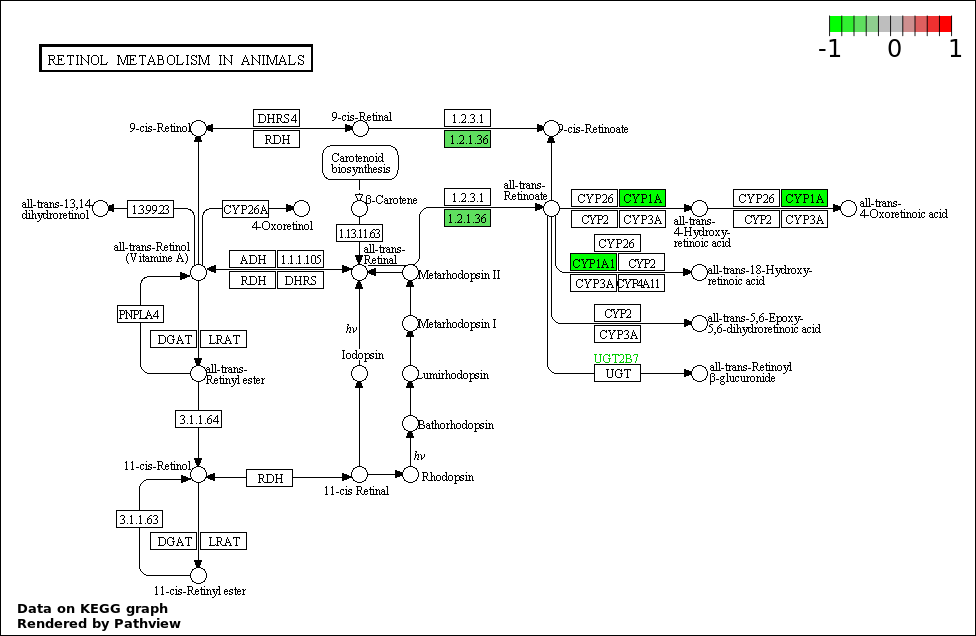
| 3 | hsa00830_Retinol_metabolism | 2 | 64 | 0.001845 | 0.1089 | |
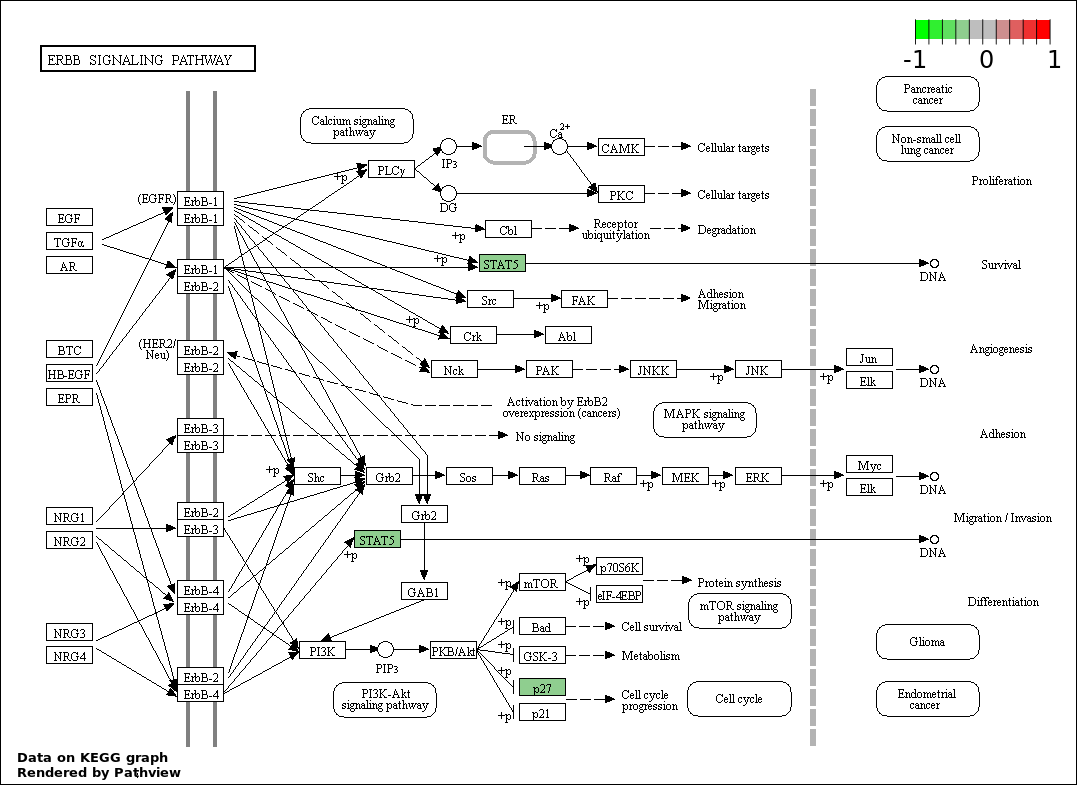
| 4 | hsa04012_ErbB_signaling_pathway | 2 | 87 | 0.003378 | 0.1495 |