RNA-Seq is a sequencing technique which uses next-generation sequencing (NGS) to reveal the presence and quantity of RNA in a biological sample at a given moment, analyzing the continuously changing cellular transcriptome. RNA-seq data analyses typically consist of 1. accurate mapping of millions of short sequencing reads to a reference genome, including the identification of splicing events; 2. quantifying expression levels of genes, transcripts, and exons; 3. differential analysis of gene expression among different biological condictions.
In this tutorial, we will use data come from two commercially available RNA samples: Universal Human Reference (UHR) and Human Brain Reference (HBR). The UHR is total RNA isolated from a diverse set of 10 cancer cell lines. The HBR is total RNA isolated from the brains of 23 Caucasians, male and female, of varying age but mostly 60-80 years old. Each of these two samples was spiked by a spike-in control, an aliquot of the ERCC ExFold RNA Spike-In Control Mixes to analyze whether the RNA-seq can reveal the abundance of transcripts,
We will now make a subdirectory in your home directory to hold the files you will be creating and using in the course of this tutorial. To make a subdirectory called RNAseq in your current working directory type
% cd ~
% mkdir RNAseq
To see the directory you have just created, type ls
% cd RNAseq
To see the directory you have jumped to, type pwd
% mkdir reference
% ln -s /home/ytong/OMICs_RNAseq/reference/hg38.chr22.fa reference/hg38.chr22.fa
% ln -s /home/ytong/OMICs_RNAseq/reference/hg38.chr22.gtf reference/hg38.chr22.gtf
% ln -s /home/ytong/OMICs_RNAseq/reference/illumina_multiplex.fa reference/illumina_multiplex.fa
% mkdir data
% ln -s /home/ytong/OMICs_RNAseq/data/HBR_Rep* data/
% ln -s /home/ytong/OMICs_RNAseq/data/UHR_Rep* data/
% ls -lh data
This option "-s" make "ln" provide a softlink from the raw data to your current directory
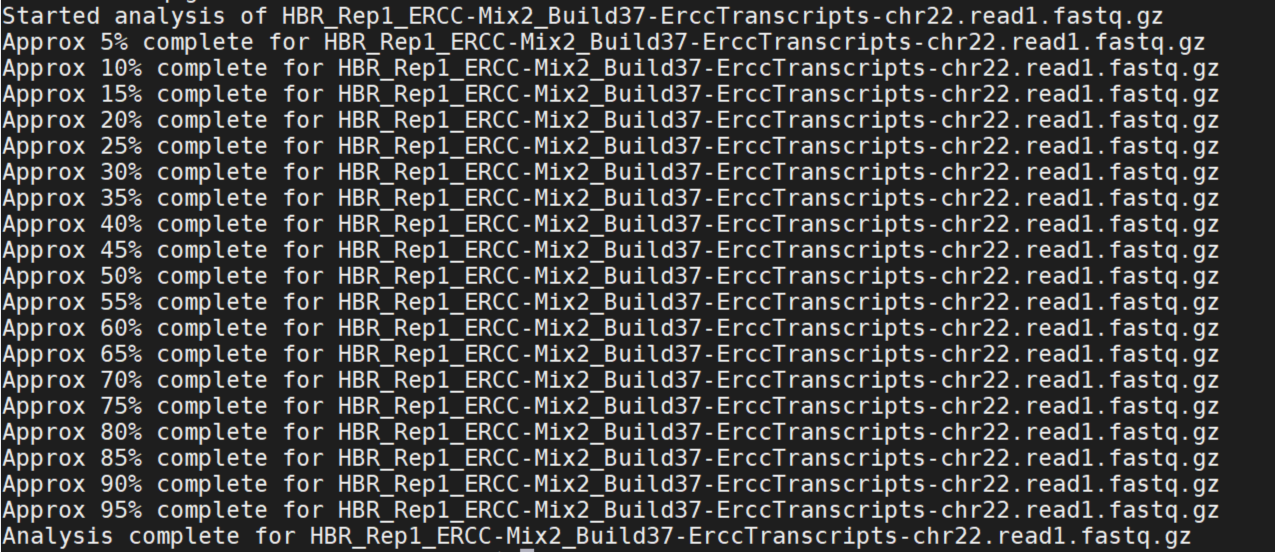
% fastqc -extract data/HBR_Rep1.R1.fastq.gz
% head -n 20 data/HBR_Rep1.R1_fastqc/fastqc_data.txt
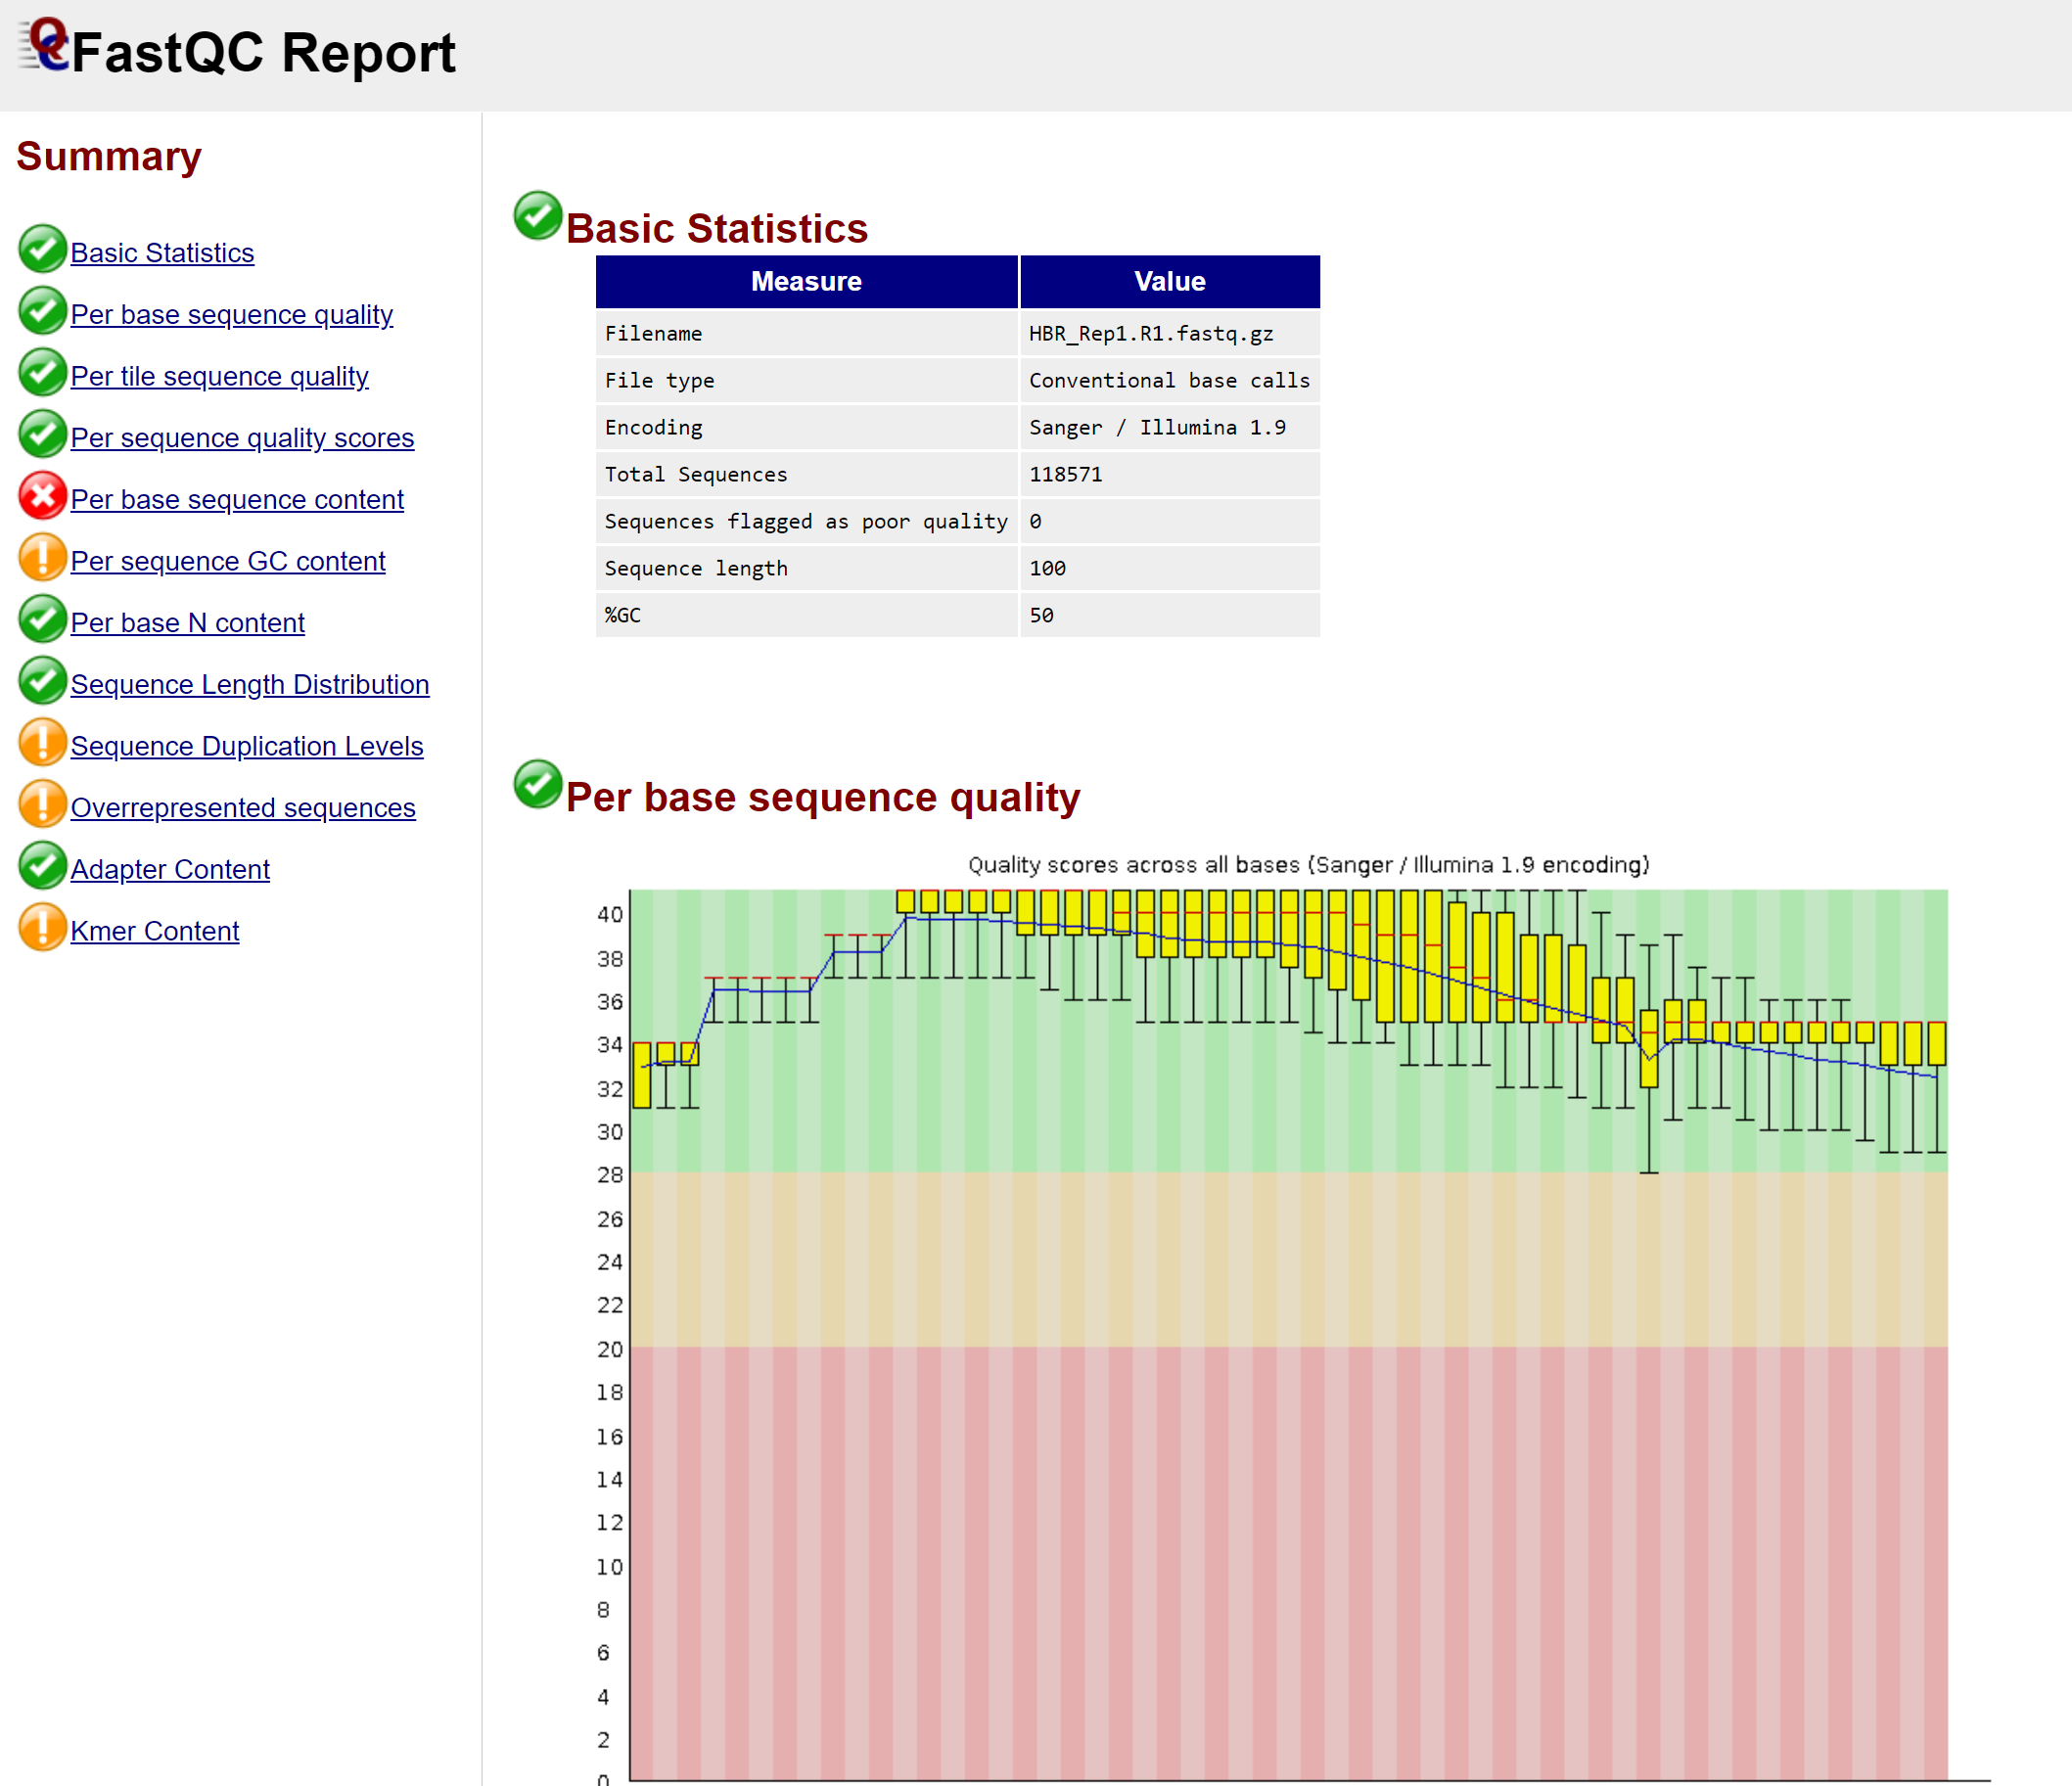
Download and open your fastqc result and check the RNA-seq data quality
Question: where (in which directory) is the fastqc result? How many sections are in the result?
% mkdir data_trim
% flexbar --adapter-min-overlap 7 --adapter-trim-end RIGHT --adapters reference/illumina_multiplex.fa --pre-trim-left 13 --max-uncalled 300 --min-read-length 25 --threads 8 --zip-output GZ --reads data/HBR_Rep2.R1.fastq.gz --reads2 data/HBR_Rep2.R2.fastq.gz --target data_trim/HBR_Rep2
Repeat the read trimming for all the 6 samples
Question: please re-do the fastqc on the trimmed data files. What is the purpose of sequence trimming? What are the quality differences (by FastQC results) before and after trimming
STAR2 is an aligner designed to specifically address many of the challenges of RNA-seq data mapping using a strategy to account for spliced alignments. STAR is shown to have high accuracy and outperforms other aligners by more than a factor of 50 in mapping speed, but it is memory intensive. The algorithm achieves this highly efficient mapping by performing a two-step process: Seed searching; Clustering, stitching, and scoring
% STAR --runThreadN 12 \
% --runMode genomeGenerate \
% --genomeDir reference \
% --genomeFastaFiles reference/hg38.chr22.fa \
% --sjdbGTFfile reference/hg38.chr22.gtf \
% --sjdbOverhang 99
Question: What are the input files for genome indexing? Why are we doing genome indexing?
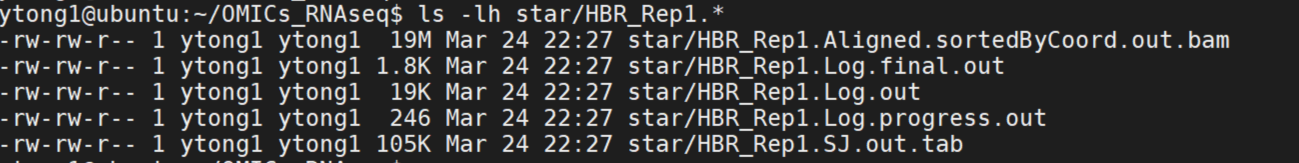
% mkdir star
create subdirectory for each sample, all the temp files will be stored in this directory
% mkdir star/HBR_Rep1
unzip the fastq.gz files to the star folder (you can do that from the raw fastq files, or from the trimmed fastq files)
% gunzip -c data/HBR_Rep1.R1.fastq.gz > star/HBR_Rep1/R1.fastq
% gunzip -c data/HBR_Rep1.R2.fastq.gz > star/HBR_Rep1/R2.fastq
running STAR2
% STAR --genomeDir reference \
% --runThreadN 12 \
% --readFilesIn \
% star/HBR_Rep1/R1.fastq star/HBR_Rep1/R2.fastq \
% --outFileNamePrefix star/HBR_Rep1. \
% --outSAMtype BAM SortedByCoordinate \
% --outSAMunmapped Within \
% --outSAMattributes Standard
% cat star/HBR_Rep1.Log.final.out
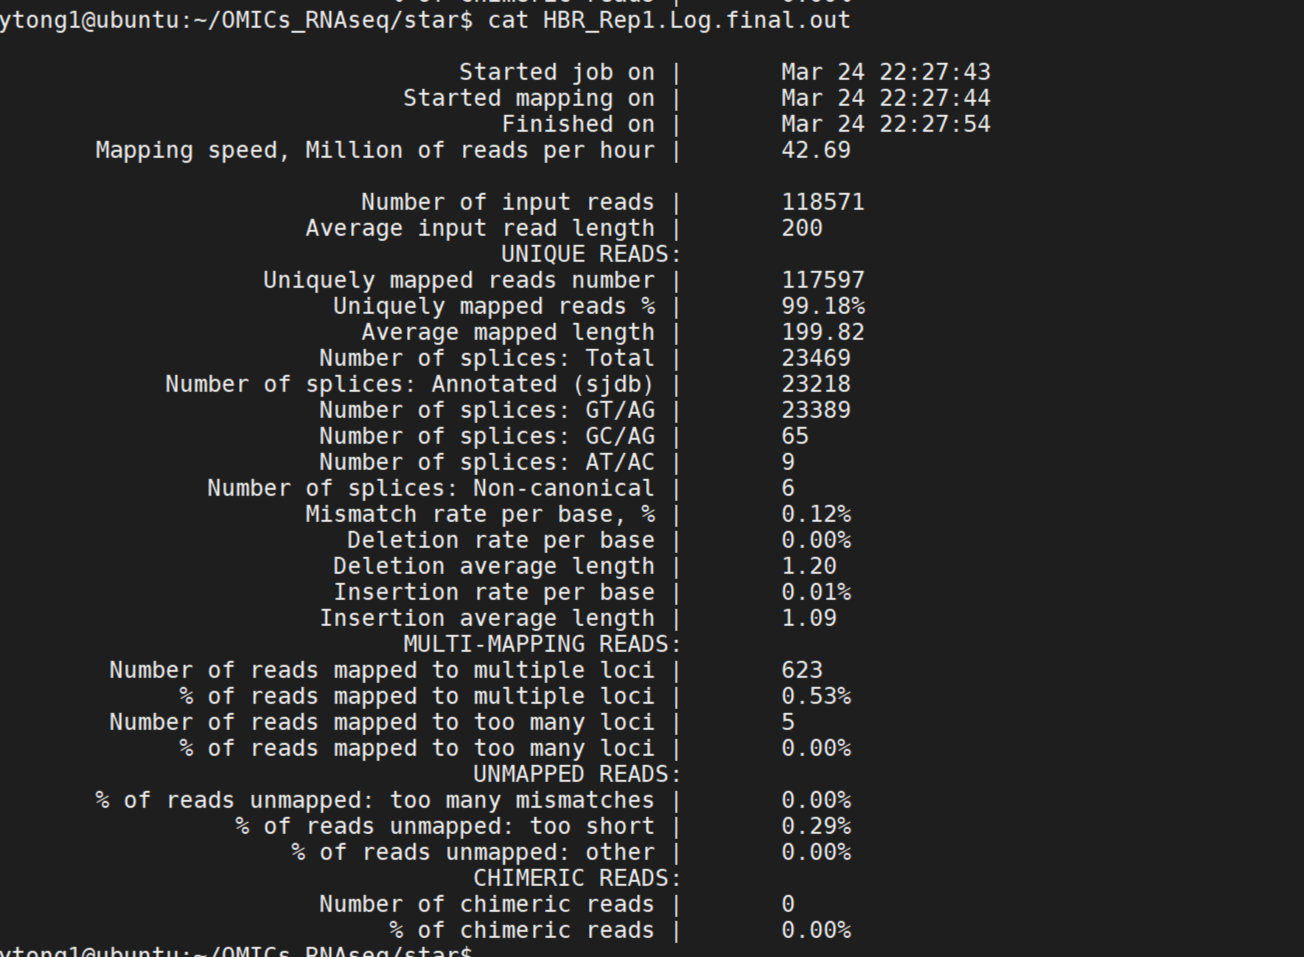
Question: what is the format and content of inputs and outputs? Please repeat the alignment for all the 6 samples.
Additional Question: how to sort, index and visualize the alignment results (bam files)? Please use knowledge gained from last section to finish this task and picture the reads alignment in IGV
% htseq-count -f bam star/HBR_Rep1.Aligned.sortedByCoord.out.bam reference/hg38.chr22.gtf > star/HBR_Rep1.count.txt
Question: what is the input and output files? what is format and content inside the output files. Repeat this step for all 6 samples
% R
options(stringsAsFactors = FALSE)
source("/home/ytong/R/workdirectory/function/test_dif_exp.R")
source("/home/ytong/R/workdirectory/function/id2name.R")
source("/home/ytong/R/workdirectory/function/plot_volcano.R")
count_dir="/home/yourfolder/RNAseq/star/"
out_dir="/home/yourfolder/RNAseq/star/"
gene_count=read_count(count_dir)
head(gene_count)
gene_count=id2name(gene_count)
head(gene_count)
write.table(gene_count,paste0(out_dir,"/gene_exp.count.matrix.txt"), sep="\t",quote=FALSE)
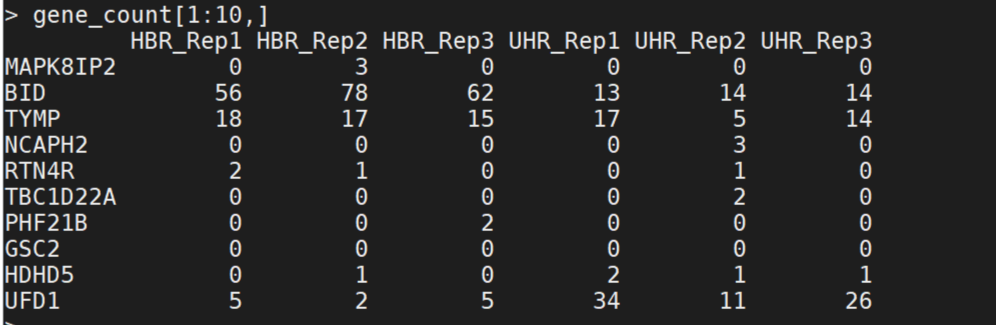
Question: download the gene count matrix and tell the number of rows and columns. What is the rows and what is the columns?
gene_exp=limma_norm(gene_count)
head(gene_exp)
write.table(gene_exp,paste0(out_dir,"gene_exp.log2exp.matrix.txt"), sep="\t",quote=FALSE)
Question: what is the normalization method we used in this step?
Define the testing groups
sample_names=colnames(gene_count)
g1=sample_names[1:3]
g2=sample_names[4:6]
g1;g2
Test DEGs between groups
dif_exp=test_dif_exp(gene_exp,g1,g2,groupid=c("HBR","UHR"))
dif_exp=data.frame(symbol=rownames(dif_exp), dif_exp,check.names=FALSE)
head(dif_exp)
write.table(dif_exp,paste0(out_dir,"/deg.txt"), sep="\t",row.names=FALSE,quote=FALSE)
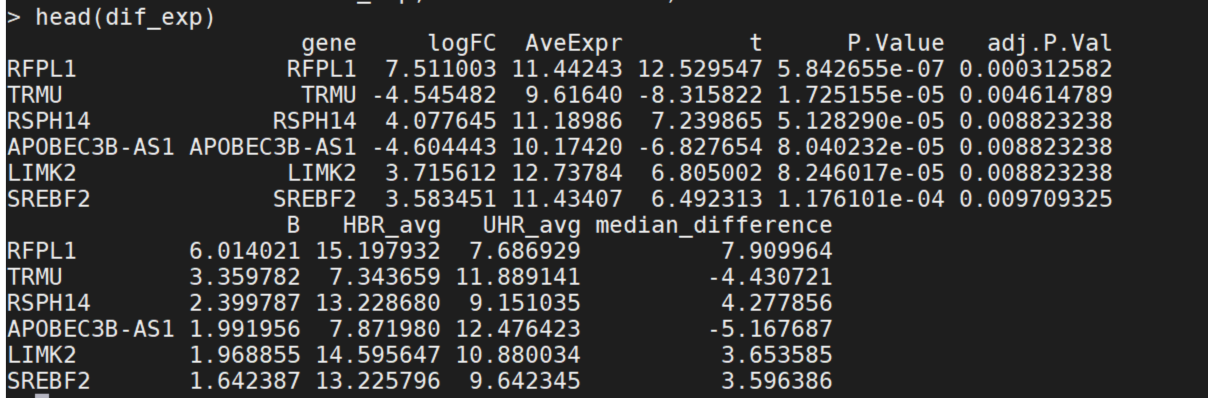
Question: what is statistical method we used to test the differentially expressed genes? What are the values in the result?
plot_volcano(dif_exp, myfilename=paste0(out_dir,"/deg.volcano.png"), adjust_p_cut=0.1,logFC_cut=0.58,p_cut=0.05,alpha=0.9, width=10,height=10)
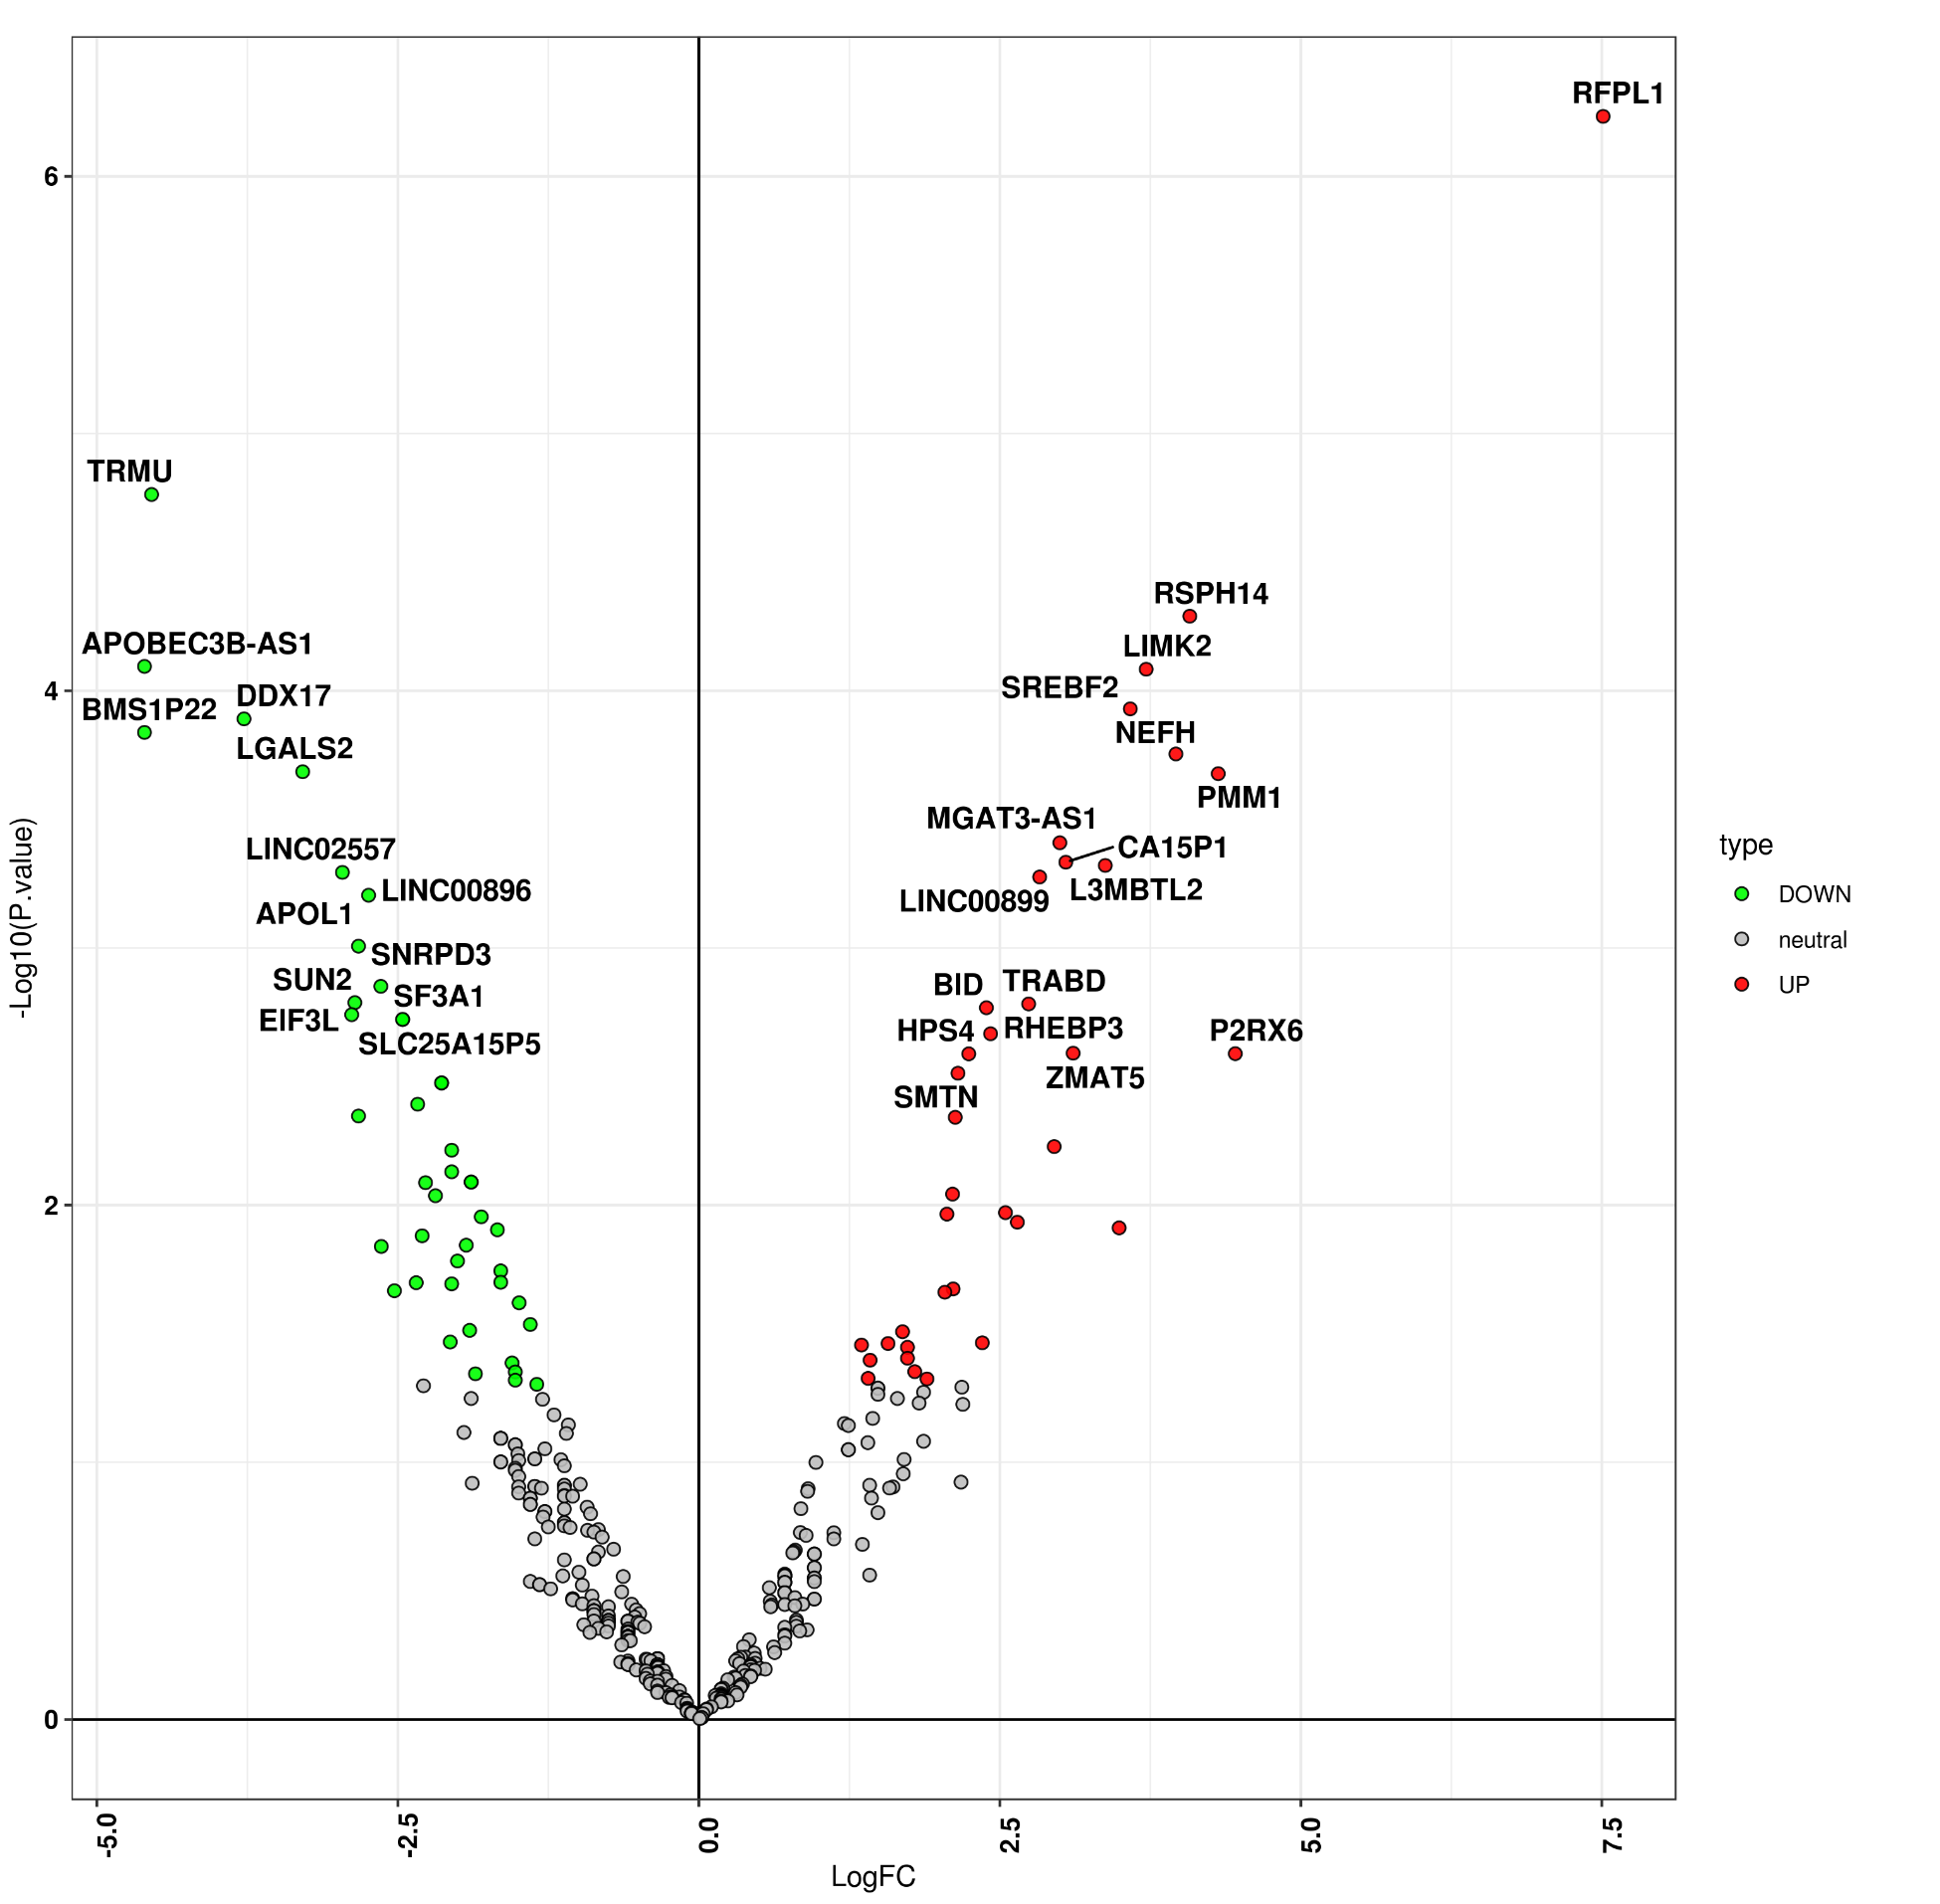
Question: what is cut-off to define up/down-regulated genes in this volcano plot?
ups<-unique(dif_exp[which((dif_exp$P.Value<0.05)&(dif_exp$logFC>0.58)),"symbol"])
downs<-unique(dif_exp[which((dif_exp$P.Value<0.05)&(dif_exp$logFC<(-0.58))),"symbol"])
ups;downs
upregulation_pathway<-function_enrichment(pathwaytype="gmt",ups,cut_pvalue=0.05, gmtfile="/home/ytong/reference/MSigDB/c2.cp.v7.4.symbols.gmt", max=NA,min=NA,qvalue=NA)
downregulation_pathway<-function_enrichment(pathwaytype="gmt",ups,cut_pvalue=0.05, gmtfile="/home/ytong/reference/MSigDB/c2.cp.v7.4.symbols.gmt", max=NA,min=NA,qvalue=NA)
if(nrow(upregulation_pathway)>0){upregulation_pathway$gene_type<-"up_regulation"}
if(nrow(downregulation_pathway)>0){downregulation_pathway$gene_type<-"down_regulation"}
head(upregulation_pathway)
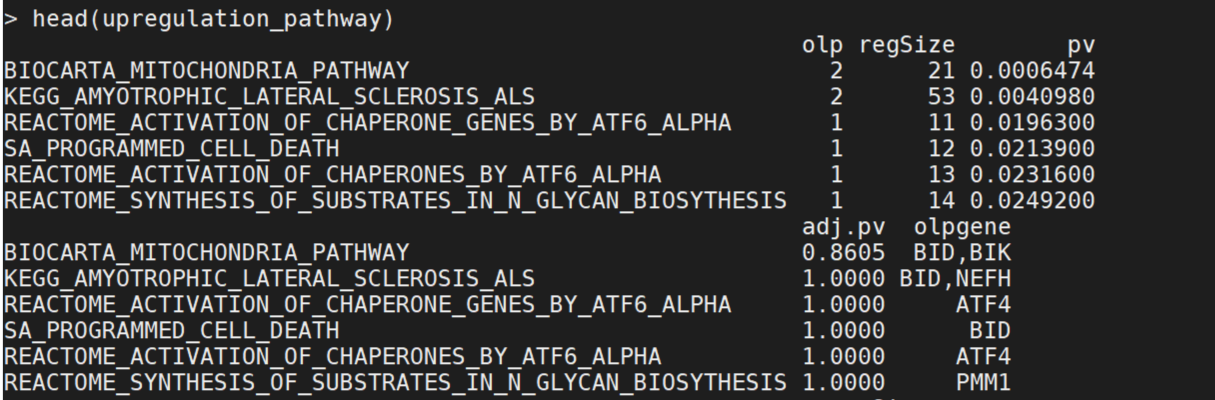
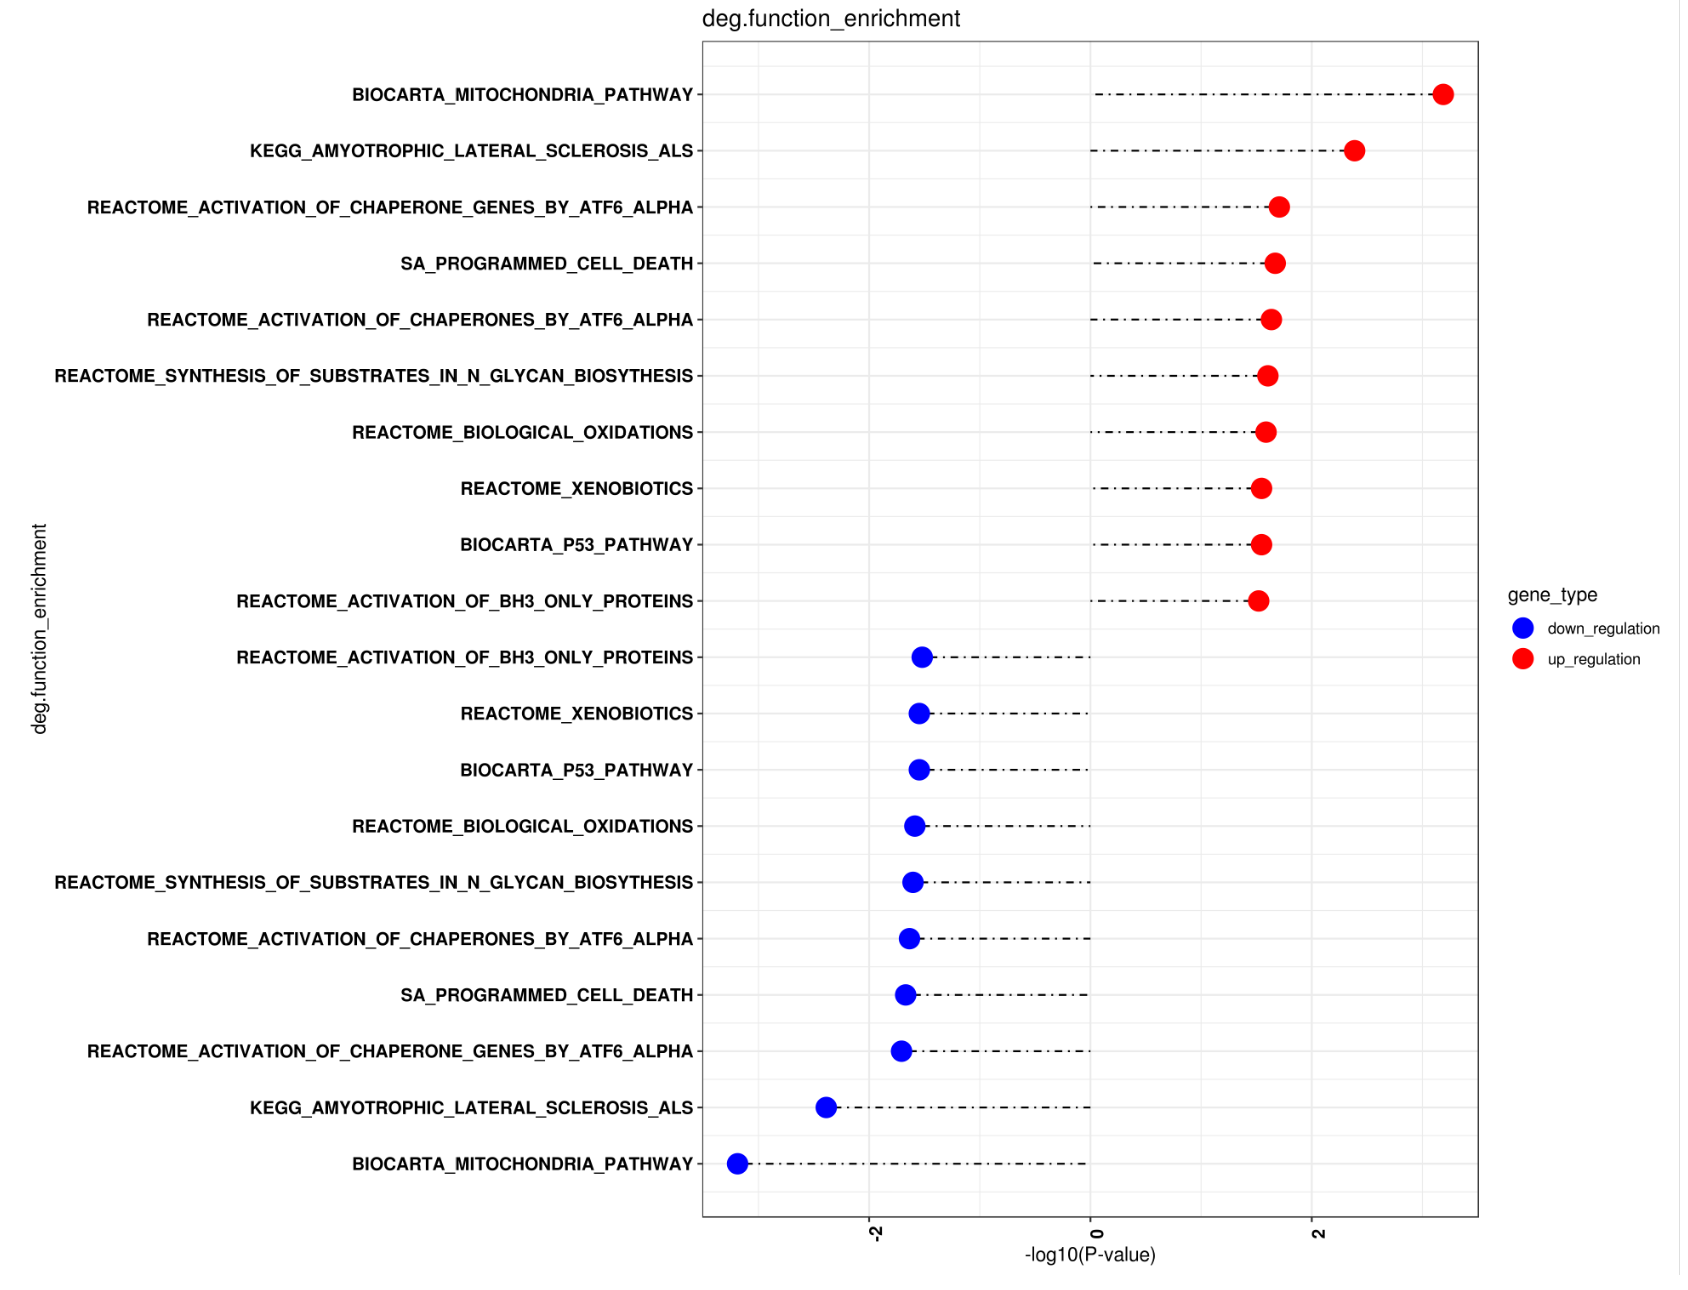
Question: what is statistic method to used to conduct the function enrichment analysis? What are the values in the result?
res<-rbind(upregulation_pathway,downregulation_pathway)
write.table(res,paste0(out_dir,"/deg.function_enrichment.txt"), sep="\t",quote=FALSE,row.names=FALSE)
res$term<-res$function_name
res<-get_tops(res,topn=20)
plot_enrichment_scatter(res,result_file= paste0(out_dir,"/deg.function_enrichment"),width=13,height=10)
Please return to the linux and R part if you have any problems in understand these codes: Tutorial
Tong Yin 5th-Feb 2021