Documentation
1 Regulon
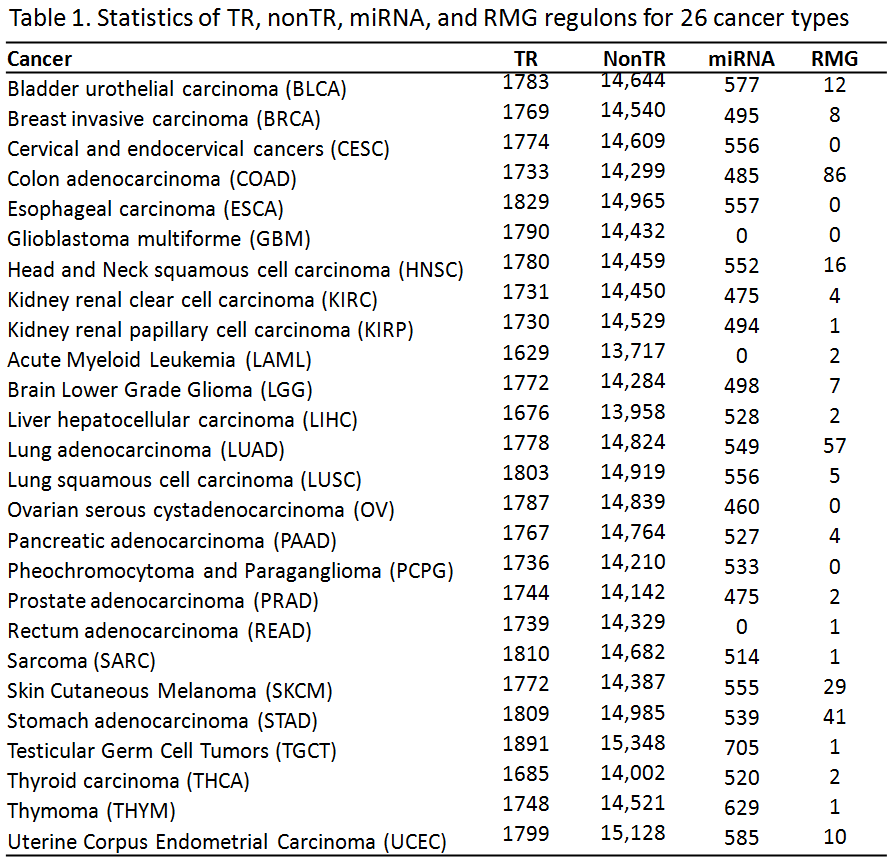
1.1 Cancer Specific Regulon (Table 1)
(1) Transcription Regulators (TRs), NonTR and miRNAs: Here, TRs contain transcription factors (TFs) and chromatin regulators (CRs), which are collected from FANTOM [1] and CR2Cancer [2] databases, respectively. NonTRs refer to other expressed protein-coding genes rather than TRs. The regulon of TFs was comprised of transcriptional targets derived from expression profile analysis. We used the ARACNe algorithm, which computes mutual information to estimate their dependence relationship [3]. It also further calculates data processing inequality (DPI) to reduce the number of indirect connections. Similar to TFs, CRs can modulate the structure of chromatin to regulate genome wide gene transcription while miRNAs can influence the stability of pre-mRNA transcripts at post-transcriptional level. As a natural extension, The targets of CRs and miRNAs were predicted with a similar strategy as TFs. Furthermore, this strategy as extended to nonTRs by using ARACNe to infer the regulons of nonTRs, which may be involved in a common biological process requiring coordinated expression. In another word, nonTRs might act as indirect regulators or coordinators of a group of genes at transcription level. Furthermore, each regulon was divided into two subsets based on positive or negative Spearman Correlation of the expression of the regulon genes and the MR.
(2) Recurrently Mutated Genes (RMGs): A gene was considered as a RMG if it has > 20 non-silent mutations in a cancer cohort. The regulon of a RMG contains genes that have significant change in correlation with the RMG between non- and mutated patients. The logic here is that mutations affecting the molecular function of protein can enhance or inhibit the connectivity between a RMG and its targets. Therefore, there would be significantly differential correlation of RMG-target after the RMG mutates. In details, all tumor samples were separated into two groups in which the RMG was mutated and not. The significance of differential correlation relationships between one RMG and genome-wide genes were quantified using the difference in z-scores by Fisher z-transformation. Standard normal distribution was applied to calculate the two-sided p-value. Subsequently, we adjusted these p-values using the Benjamini-Hochberg method and selected the differentially correlated genes (DCGs) with adjusted p-value < 0.05. Subsequently, a DCG was assigned to positive or negative regluon if its expression level was up- or down-regulated after the RMG mutates.

1.2 Noncancer Specific Regulon (Table 2)
(1) ChIP-Seq TF: targets were predicted from public ChIP-Seq data, which were downloaded from GEO database. We used BETA [4] to infer the putative target genes.
(2) PWM TF: targets were predicted using motif scan strategy (Position Weight Matrix, PWMs). Human TF motifs were downloaded from the ENCODE motif collection. The set of PWMs was then used to scan the human genome (hg19) to obtain candidate motif sites genome-wide using FIMO from the MEME Suite with options -max-strand -thresh 1e-5 [5].
(3) Signaling Protein (Kinase and Phosphatase): modification substrates extracted from database DEPOD [6] and PhosphoSitePlus [7], respectively.
(4) PPI-Hubs: first neighbors for one protein in a highly complete PPI network constructed based on Pathway Commons [8].

2 Workflow of MR4Cancer
MR4Cancer provides distinct methods for the identification of key MRs that can be applied to two scenarios. An overview of its workflow is presented in Fig. a.
Scenario 1: a user can input a list of unranked genes from a specific cancer or tissue type, e.g. DEGs between two groups of samples from a specific project. Optionally, the gene symbol can be followed by values that indicate their up- or down-regulation trend. Over-Representation Analysis (ORA) is used to evaluate the statistical significance of overlap between the input gene list and the predefined regulons based on hypergeometric test with cancer type matched with the input information. The output MRs from our server could be from the input gene list or outside of the list, dependent on if the regulon of the MR on test has a significant enrichment in the input gene list. If significantly enriched, the MR is assumed to orchestrate the expression of this group of input genes.
Scenario 2: users can upload a matrix that contains genome-wide gene expression values, wherein the samples belong to two groups, e.g. disease and normal, or treatment and control. As the first step, differential expression analysis between the two groups will be carried out. Subsequently, users can choose either the top differentially expressed genes for ORA analysis (same as Scenario 1) or the genome-wide ranked gene list for Gene Set Enrichment Analysis (GSEA). In contrast to ORA, GSEA considers the complete ranked list of genes to avoid the arbitrary gene selection step in ORA. In details, if the regulon of a MR tend to distribute at the ends of the list (i.e., the direction of DEGs), the MR is more likely to be the key regulator that lead to the difference of the input expression matrix of two states.
Regulatory Mode: To determine MR modes (activated or repressed), two runs of enrichment analyses (r1 and r2) are carried out for both ORA and GSEA method (Fig. b). Of note, a cancer-specific regulon is comprised of two subsets (positive and negative targets, respectively) while a noncancer-specific regluon dose not have. For a cancer-specific regulon, (r1) positive regulon in up-regulated genes and negative regulon in down-regulated genes; (r2) positive regulon in down-regulated genes and negative regulon in up-regulated genes. For a noncancer-specific regulon, (r1) regulon in up-regulated genes; (r2) regulon in down-regulated genes. Whichever of the two runs gives the more significant p-value is used as the final metrics, and the MR is predicted to be activated (r1 < r2) or repressed (r1 > r2). Of note, when the input gene list is regulation direction free (i.e., no values followed), only one run of ORA is conducted against regulon. Diamond: MR (red: activated; blue: repressed). Circle: regulon (red: positive; blue: negative; grey: undefined).

3 Candidate MRs whose expression were affected by genomic events
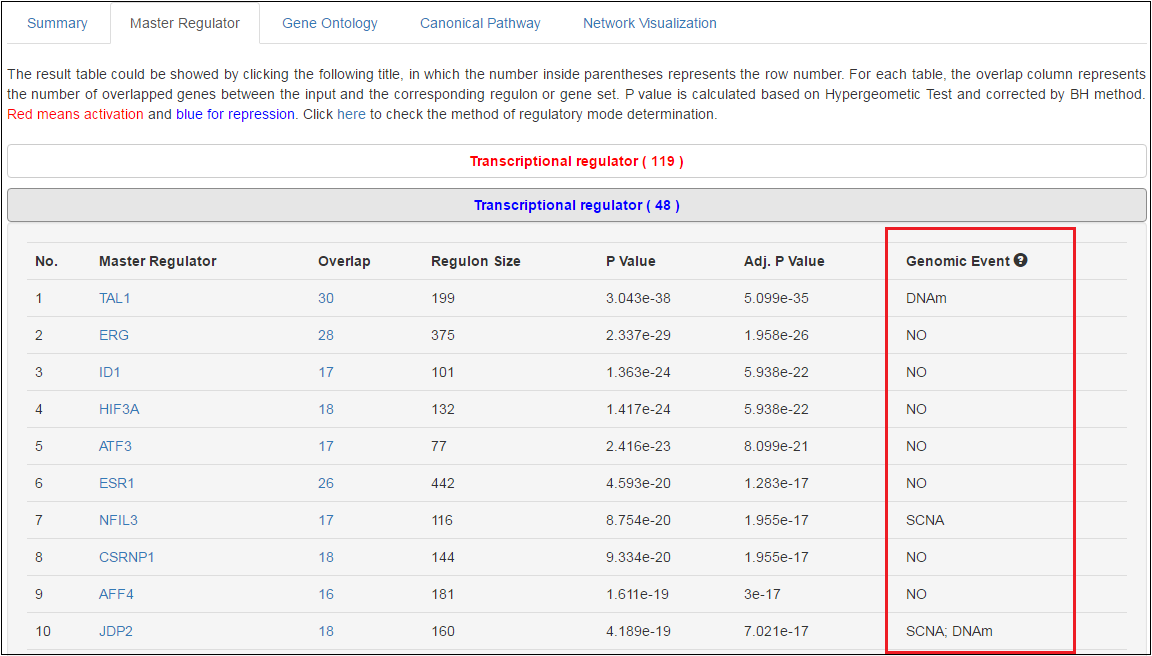
A candidate MR is more likely to source of tumorgenesis if the MR aberration is driven by its genomic alterations [9]. For the candidate master TRs and nonTRs, a single column indicates whether the aberrant expression of the MR in the selected cancer type is affected by genomic events.
A three-step procedure was designed to identify candidate MRs affected by somatic copy number alteration (SCNA) and promoter DNA methylation (DNAm) for each cancer type: (i) the gene is differentially expressed between tumor and normal samples (Fold Change > 1.5 or < -1.5 and adjusted P < 0.05); (ii) the dysregulated genes have strong correlations between its mRNA levels and the extent of genomic alterations (r > 0.3 for SCNA, r < -0.3 for DNAm, and P < 0.05); (iii) the genomic event follows these rules, i.e., either the gene has high frequency SCNA (loss or gain > 33% patients) or locates in focal chromosome regions, or its DNAm level is significantly different between tumor and normal samples (|delta beta value| > 0.2 and adjusted P < 0.05). Differential gene expression and methylation analyses were conducted with the limma package [10]. In a given cancer type, the percentage of patients with copy number loss, neutral and gain was subject to -1/2, 0 and +1/2 copy number threshold from GISTIC output. The promoter methylation level of one gene was represented by the probe in its promoter region, which had the least negative correlation coefficients (Spearman) with the mRNA expression.

References
[1] Abugessaisa, Imad, et al. FANTOM5 transcriptome catalog of cellular states based on Semantic MediaWiki. Database (2016): baw105.
[2] Ru, Beibei, et al. CR2Cancer: a database for chromatin regulators in human cancer. Nucleic acids research (2018): gkx877.
[3] Lachmann, Alexander, et al. ARACNe-AP: gene network reverse engineering through adaptive partitioning inference of mutual information. Bioinformatics (2016): btw216.
[4] Wang, Su, et al. Target analysis by integration of transcriptome and ChIP-seq data with BETA. Nature protocols 8.12 (2013): 2502-2515.
[5] Grant, Charles E., et al. FIMO: scanning for occurrences of a given motif. Bioinformatics 27.7 (2011): 1017-1018.
[6] Duan, Guangyou, et al. The human DEPhOsphorylation database DEPOD: a 2015 update. Nucleic acids research 43.D1 (2015): D531-D535.
[7] Hornbeck, Peter V., et al. PhosphoSitePlus, 2014: mutations, PTMs and recalibrations. Nucleic acids research 43.D1 (2015): D512-D520.
[8] Cerami, Ethan G., et al. Pathway Commons, a web resource for biological pathway data. Nucleic acids research 39.suppl 1 (2011): D685-D690.
[9] Eifert, Cheryl, et al. From cancer genomes to oncogenic drivers, tumour dependencies and therapeutic targets. Nature Reviews Cancer 12.8 (2012): 572.
[10] Ritchie, Matthew E., et al. limma powers differential expression analyses for RNA-sequencing and microarray studies. Nucleic acids research 43.7 (2015): e47-e47.