Tutorial
In order to identify candidate MRs, users just need to input either a gene list or an expression matrix. Furthermore, enrichment analysis of GO terms and pathways is conducted to elucidate the function of candidate MRs. MR4Cancer also provide visualization for above results, especially interactions between MRs and targets. The interactive panel allow users to customize their results, and save it as figures for publication. For more details about the usage and results interpretaion, please check the following two case studies.
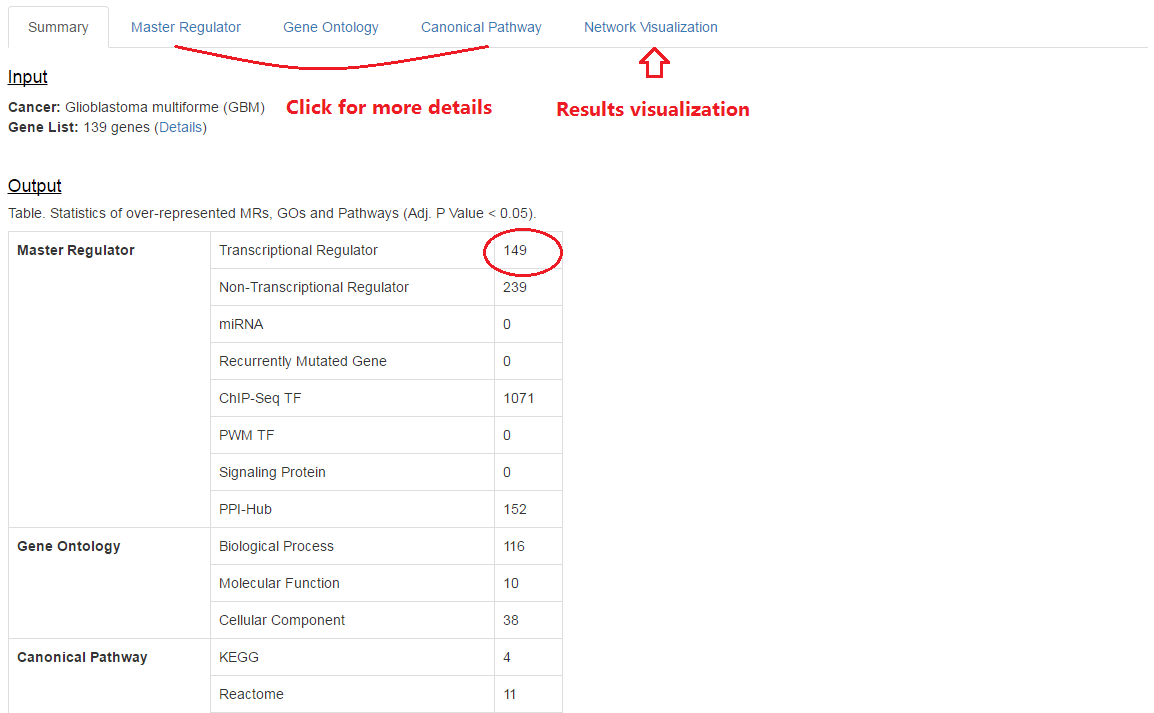
Carro et al used 76 gene expression profiles of glioblastoma multiforme (GBM) to establish a mesenchymal gene expression signature (MGES) and identified 53 MGES-specific master TFs [1]. We input this signature to MR4Cancer and obtained 149 ones, which are significantly overlapped with Carro's study.
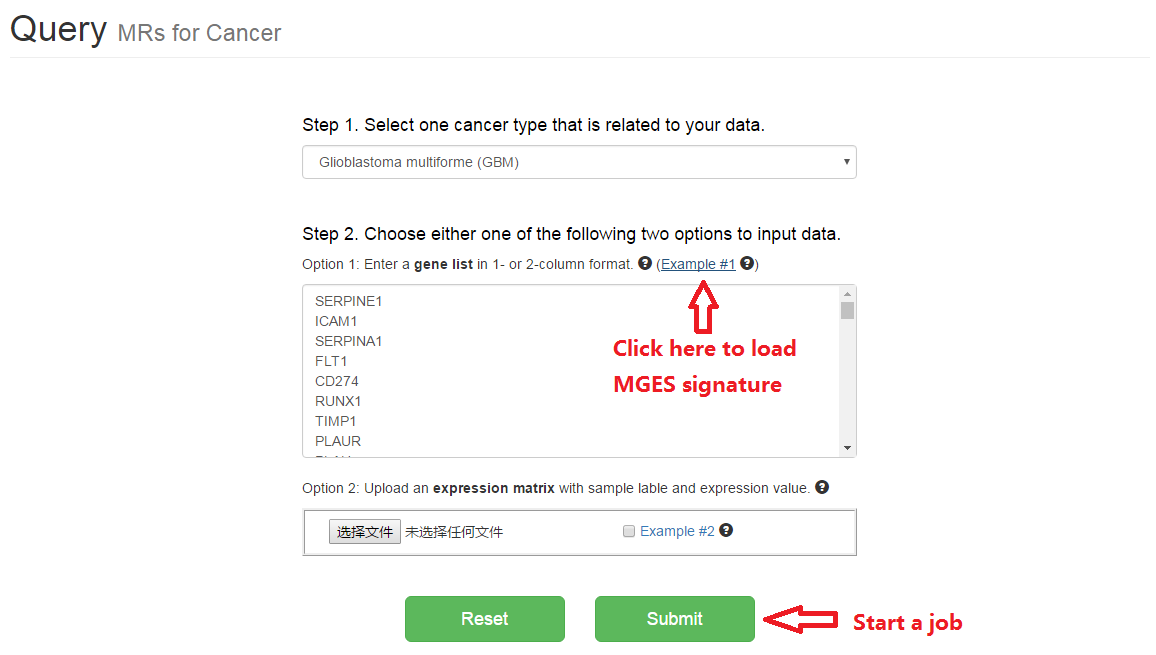
1. Load MGES signature in GBM
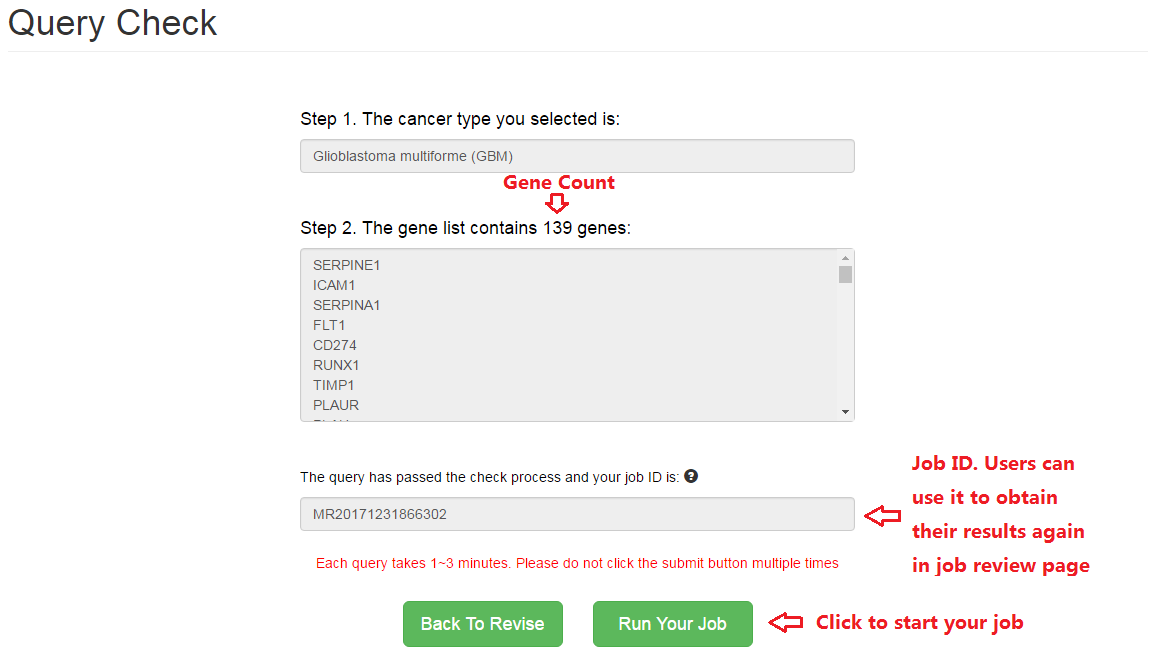
2. Start your job after passing the check process.
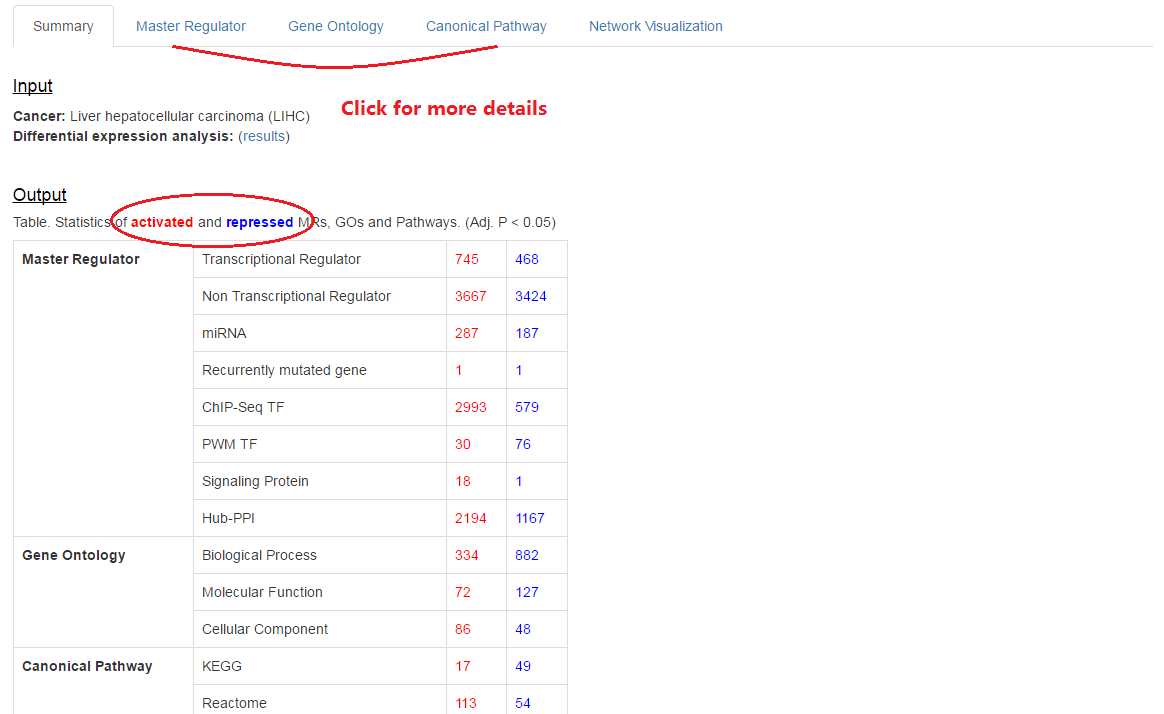
3. Summary for results
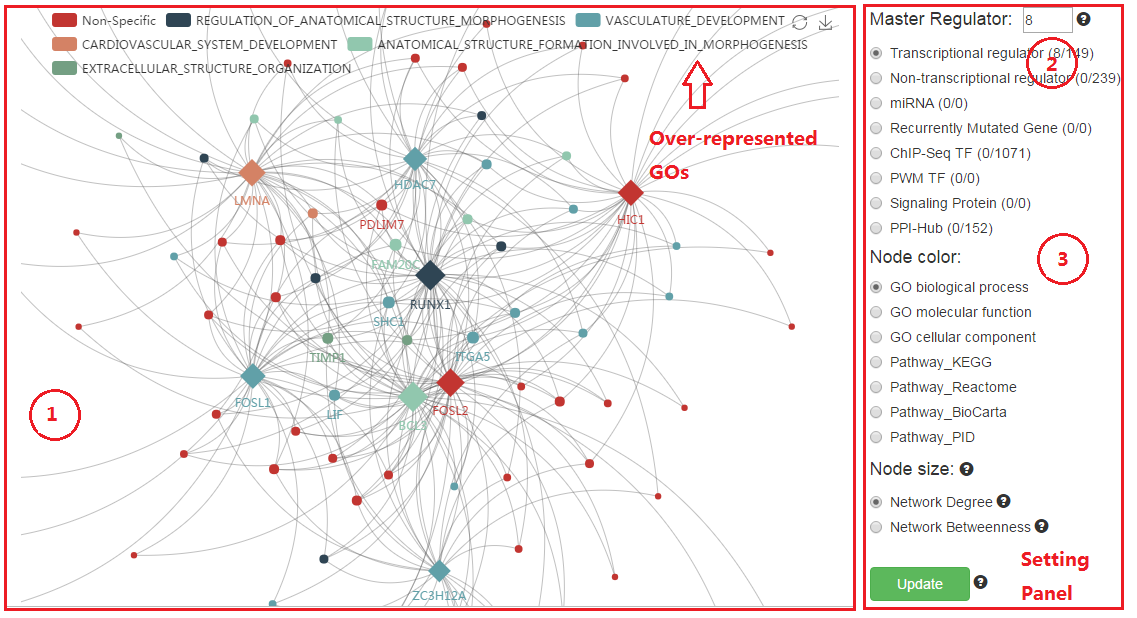
4. Network visualization
(1) The network could be moved and roomed in/out for more information.
(2) Adjust the maximum node number for each kind of MRs in the netwrok.
(3) For the fraction in parentheses, the denominator is the total number of over-represented MRs and the numerator is the number of MRs in the network.
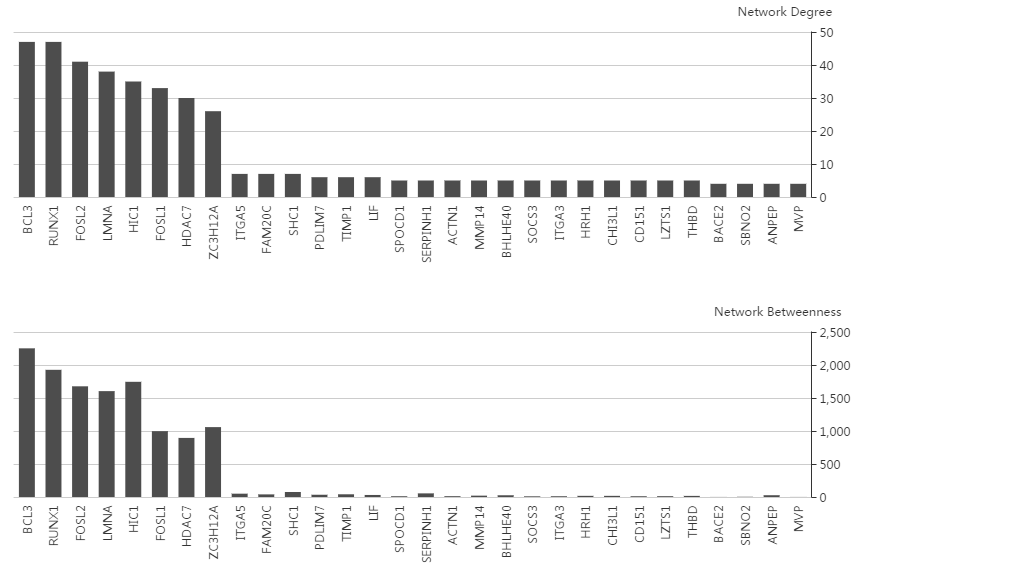
5. Network topology (degree and betweeness)
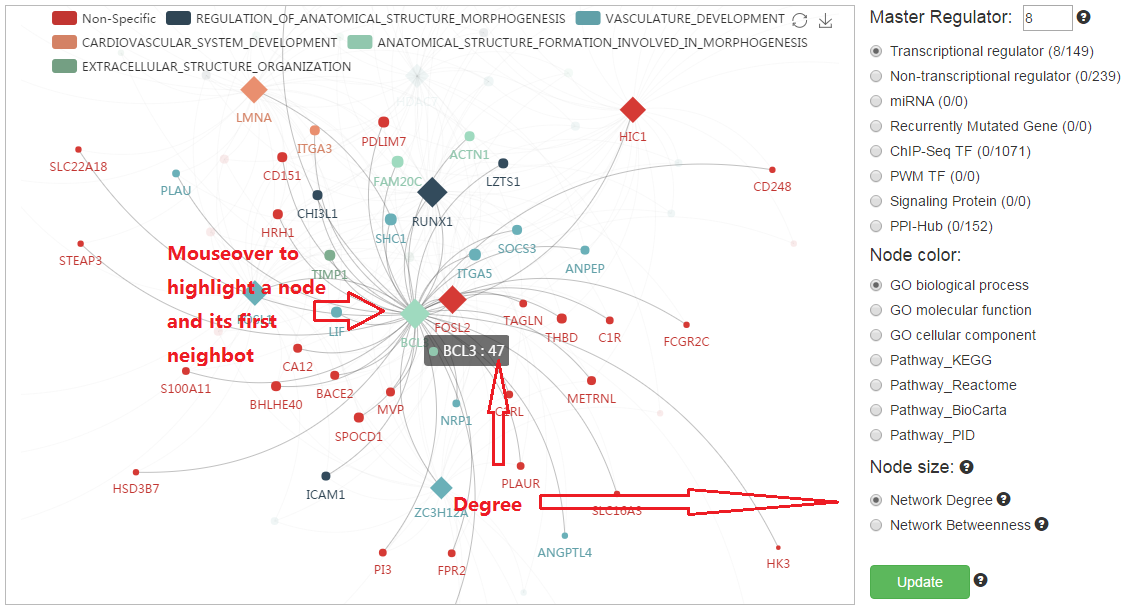
6. Highlight one node via mouseover
7. Find more details for MRs
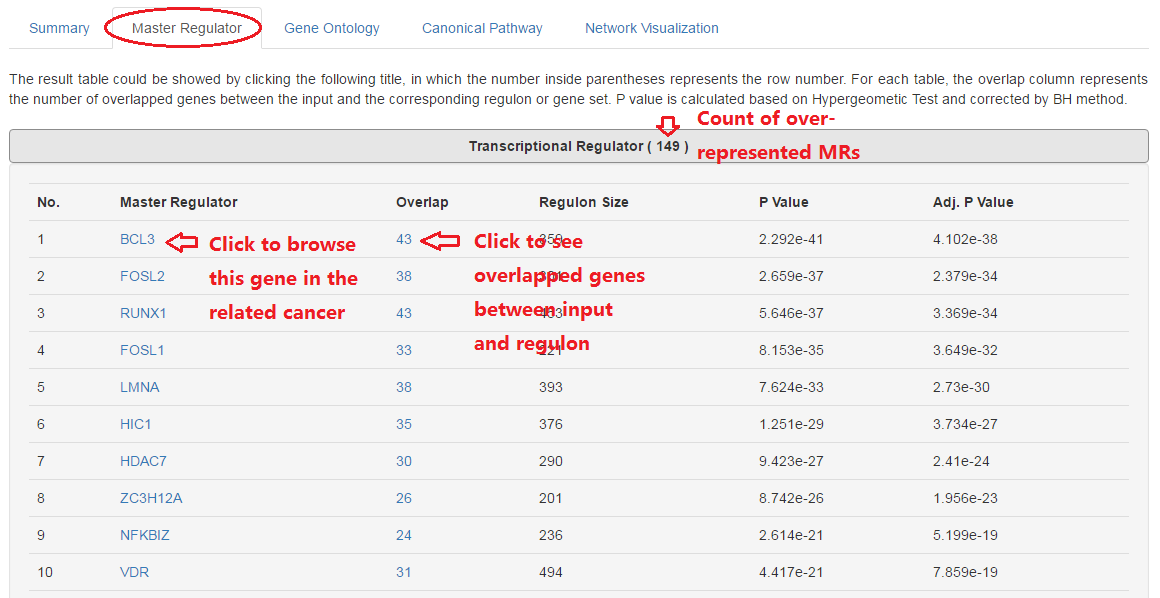
8. Overlap analysis
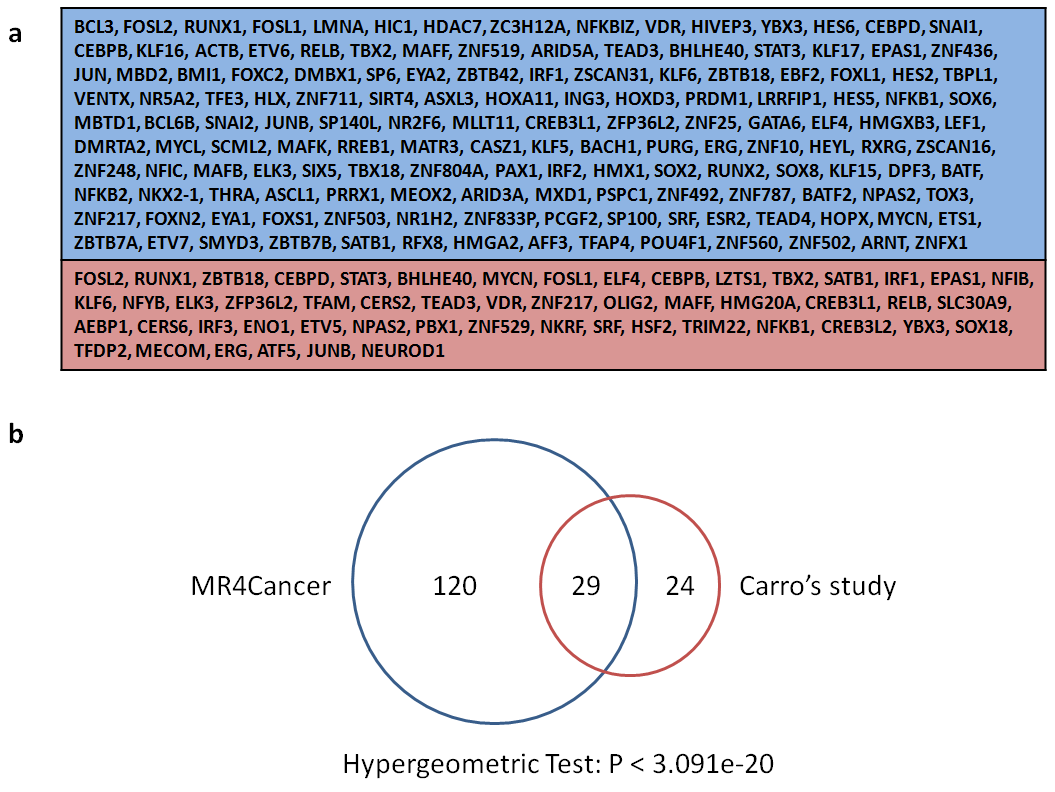
(a) MGES-specific master transcription regulators for MR4Cancer (149, upper) and Carro's study (53, lower), respectively.
(b) Overlap distribution between MR4Cancer and Carro's study.
[1] Carro, M.S., Lim, W.K., Alvarez, M.J., Bollo, R.J., Zhao, X.D., Snyder, E.Y., Sulman, E.P., Anne, S.L., Doetsch, F., Colman, H. et al. (2010) The transcriptional network for mesenchymal transformation of brain tumours. Nature, 463, 318.
In this case, the example file (paired liver cancer samples from TCGA) are used to conduct comprehensive query to prioritize master regulators by MR4Cancer.
1. Load expression file of liver cancer
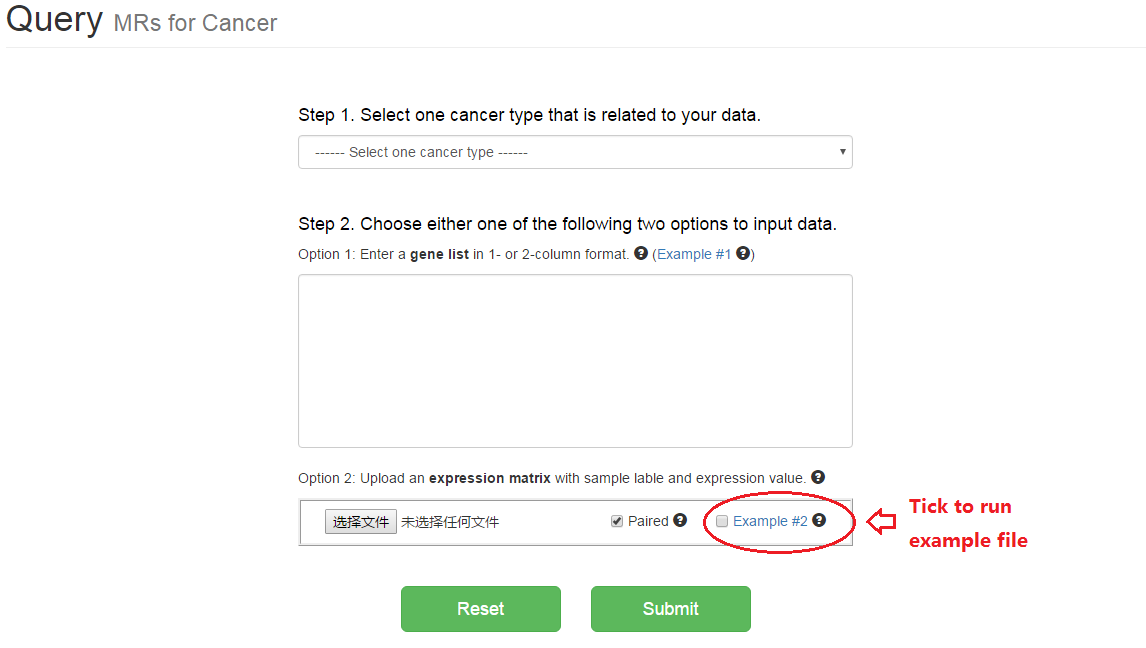
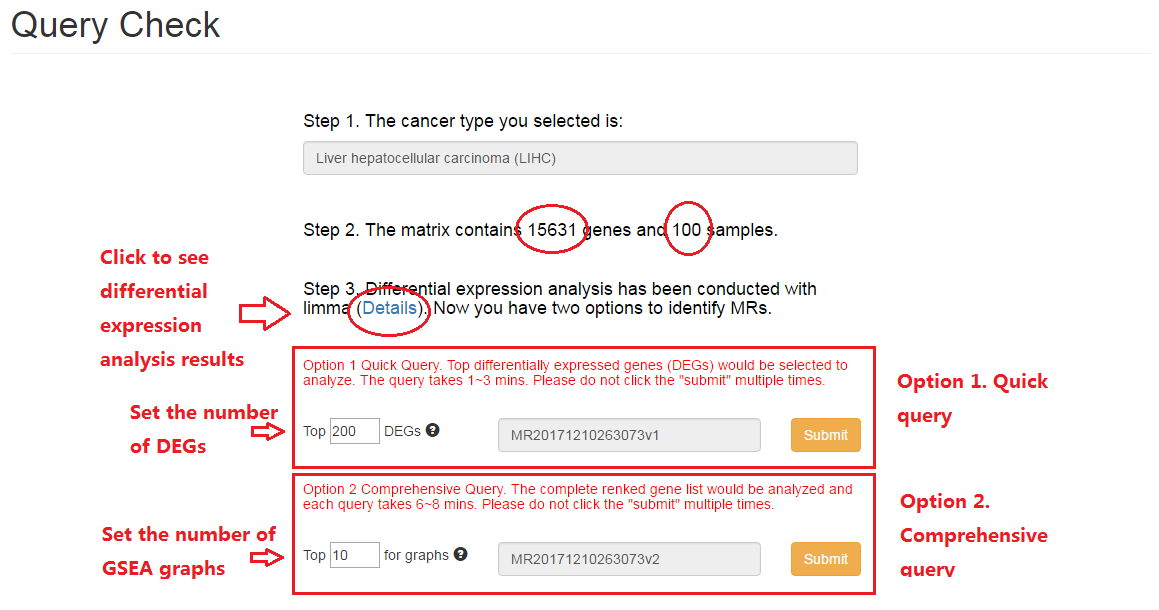
2. Choose quick or comprehensive query
3. Results for comprehensive query
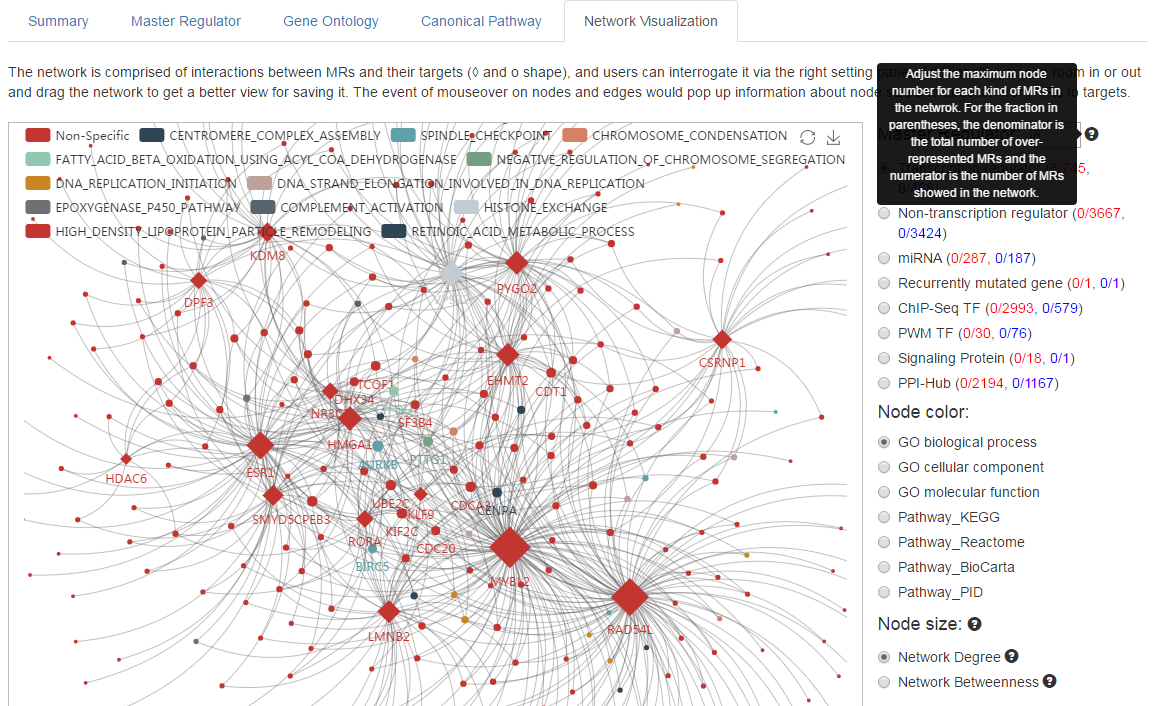
4. Network visualization
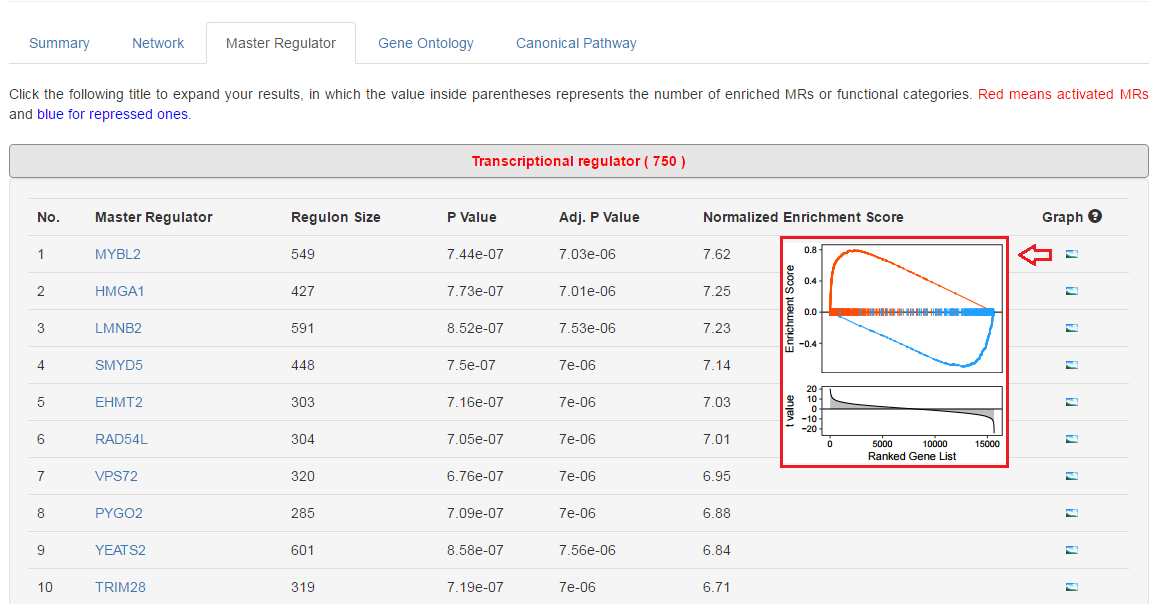
5. View more details for MRs
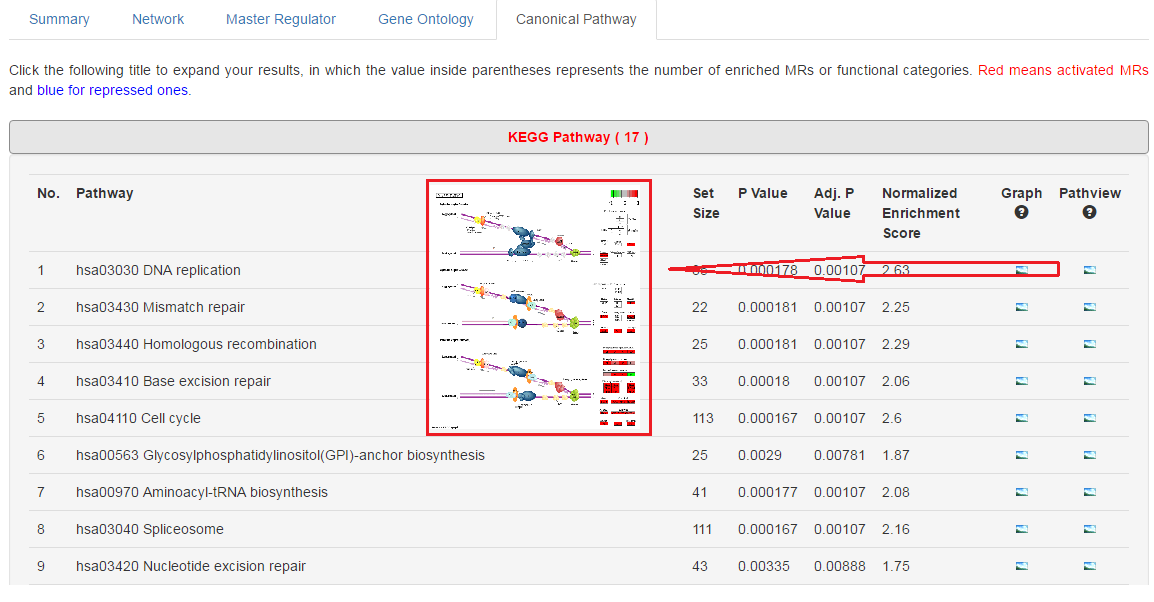
6. Visulize KEGG pathway
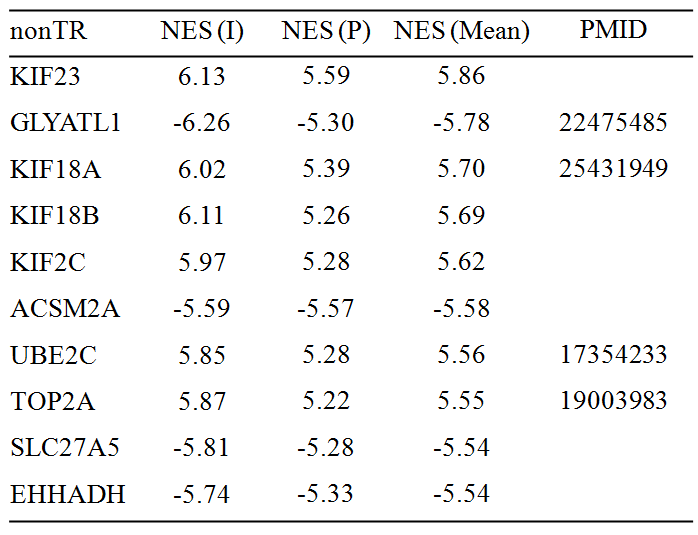
7. The following two tables show top 10 MRs which might be responsible for liver cancer initiation (paired normal versus tumor samples) and progression (late- versus early-stage of tumor samples). Of them, 5 TRs (Table 3) and 4 nonTRs have already been described in the context of liver cancer, respectively. Positive (negative) value of NES means activated (repressed). NES: normalized enrichment score; I: initiation; P: progression; PMID: Pubmed ID.
Table 1. Top 10 transcriptional regulators (TRs)
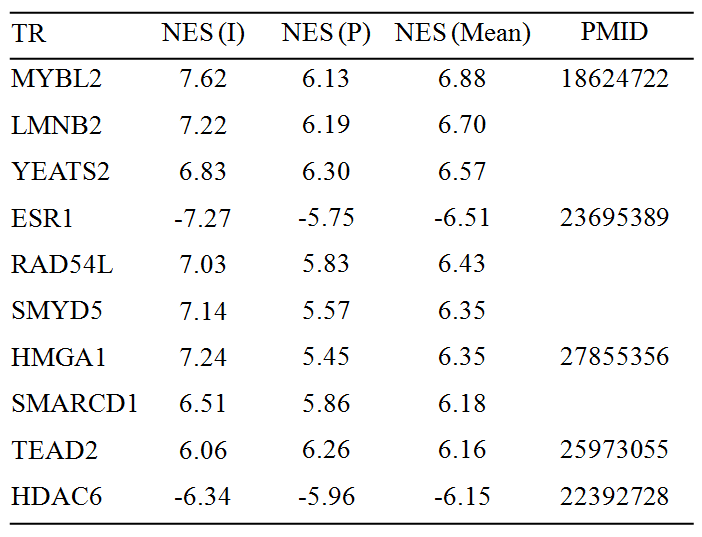
Table 2. Top 10 non-transcriptional regulators (nonTRs)
