Frequently asked questions
1. Why TISIDB?
The interaction between tumor and immune system plays a crucial role in cancer initiation, progression, and treatment. Although cancer immunotherapy (e.g. Immune checkpoint blockades) has been shown to improve survival in a subset of patients with various cancers, the response rate of treatment is still low. Therefore, elucidation of tumor and immune cell interplay would assist to both the prediction of immunotherapy responses and the development of novel immunotherapy targets. To our knowledge, TISIDB is the most comprehensive database for tumor and immune system interactions. In TISIDB, users can cross check the gene of interest through knowledge from different platforms and obtain high quality visualization results for their publications. We believe that TISIDB will significantly improve our understanding of tumor and immune system interactions and has the potential to be a timely and valuable resource for cancer immunology research.
2. What's in TISIDB?
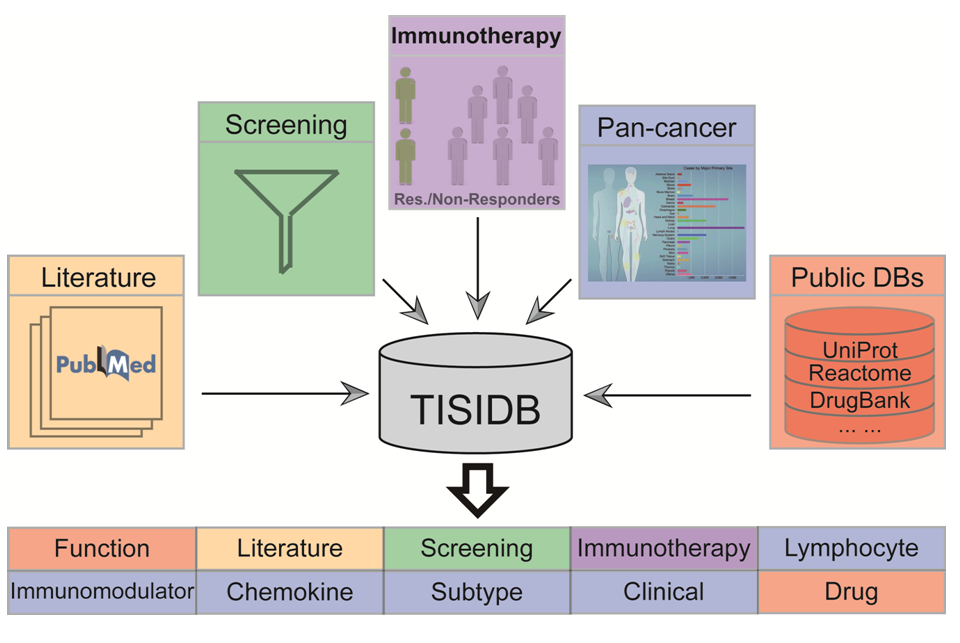
TISIDB is a central portal for tumor and immune system interactions, which integrates multiple heterogeneous data types (see the following workflow). They pertain to: (1) Literature mining results from PubMed database, including manually curated 4176 records from 2530 papers, which reported 988 genes involved in anti-tumor immunity. (2) High throughput screening data (e.g. CRISPR-Cas9, shRNA and RNAi), which can indicate whether a gene is related to resistance or sensitivity of tumor cells to T cell-mediated killing. (3) RNA and exome sequencing data sets of patient cohorts with immunotherapy, which show the expression and mutation difference of a gene between responders and non-responders. (4) Genomics, transcriptomics and clinical data of 30 non-hematologic cancer types from The Cancer Genome Atlas (TCGA), which can tell whether a gene is associated with the abundance of tumor infiltrating lymphocytes (TILs), immunomodulator, chemokine, and clinical features. (5) Public databases for more related information, including UniProt, GO, DrugBank etc. These data are integrated into ten categories of information for each gene. Click here for more details.
3. What is the procedure of literature mining?
Literature mining is comprised of three steps: (1) download all abstracts from PubMed database with keywords "cancer" AND ("immune response", "immune surveillance", "immune editing", "immune infiltration", "immune destruction", "immune escape", "immune suppression", "immune tolerance", "immune resistance", "immunosuppression", "immunoresistance", "immunotherapy"); (2) split the abstract into single sentences and filter them based on a dictionary of human gene names; (3) read these sentences and manually curate genes involved in anti-tumor immunity.
4. Why include screening data?
High-throughput screening techniques (e.g. CRISPR-Cas9, shRNA and RNAi) have been used to identify mechanisms of tumor cell resistance (e.g., PTPN2 [1]) and sensitivity (e.g., APLNR [2]) to killing by cytotoxic T cells, the central effectors of anti-tumor immunity. After comprehensively searching, 8 groups of screening data sets were collected in the current database. Based on them, users can check whether their selected genes cause resistance or increase sensitivity to T cell-mediated killing in various data sets.
5. Why include immunotherapy data?
Transcriptomic and genomic data of patients with immunotherapy are used to identify signatures and mechanisms of response to checkpoint blockade (e.g., anti-PDL1 and anti-PD1). One example is that mutations in the gene PBRM1 benefit clinical survival of patients with clear cell renal cell carcinoma [3]. After comprehensively searching, we collected 5 and 6 of transcriptomic and genomic data sets, respectively. In this tab, users can check whether their selected genes have significant difference of expression or mutation between responders and non-responders in various data sets.
6. How do you normalize RNA-Seq data from TCGA?
After downloading the row counts of RNA-Seq data, genes were retained for downstream analysis if they had more than one count per million mapped reads in at least 5% samples. Voom method was used to convert the read counts to log2CPM [4].
7. How do you assign methylation level for each gene?
Spearman correlation coefficients between expression and methylation level of CpG sites in the promoter region (TSS1500, TSS200, 5'UTR and 1st exon) were calculated for each gene. Then, we assigned the beta value of the CpG site with the least rho value as promoter methylation level of the gene.
8. Which method do you use to calculate the abundance of tumour infiltrating lymphocytes (TILs)?
We selected immune-related signatures of 28 immune cell types from Charoentong's study [5]. For each cancer type, gene set variation analysis (GSVA) package [6] was used to infer the relative abundance of TILs using gene expression profile of patients.
References
[1] Manguso RT, et al. In vivo CRISPR screening identifies Ptpn2 as a cancer immunotherapy target. Nature 547.7664 (2017): 413.
[2] Patel SJ, et al. Identification of essential genes for cancer immunotherapy. Nature 548.7669 (2017): 537.
[3] Miao D, et al. Genomic correlates of response to immune checkpoint therapies in clear cell renal cell carcinoma. Science (2018): eaan5951.
[4] Law CW, et al. Voom: precision weights unlock linear model analysis tools for RNA-seq read counts. Genome biology 15.2 (2014): R29.
[5] Charoentong P, et al. Pan-cancer immunogenomic analyses reveal genotype-immunophenotype relationships and predictors of response to checkpoint blockade. Cell reports 18.1 (2017): 248-262.
[6] Hanzelmann S, et al. GSVA: gene set variation analysis for microarray and RNA-seq data. BMC bioinformatics 14.1 (2013): 7.