Documentation: updates, tutorial, data statistics
Updating:
- 20181127
- Network colors have been adjusted to intensify the performance of distinct functional annotation.
- 20180816
- To facilitate the user's customization to visualize the regulatory network, more options have been added to the control panel. Specially, the node colors now can be customized by selected gene functions.
- 20180719
- Gravity between network nodes now can be controlled to improve the presentation.
- Circular layout has been applied in the network presentation, when setting the nodes gravity.
- 20180718
- Fixed the ID mapping bugs.
- Font sizes and node sizes in the network has been adjusted to improve the presentation.
- 20180711
- Duplicated symbols in user's uploading matrix will report error
- 20180630
- Modified the control panel
Tutorial
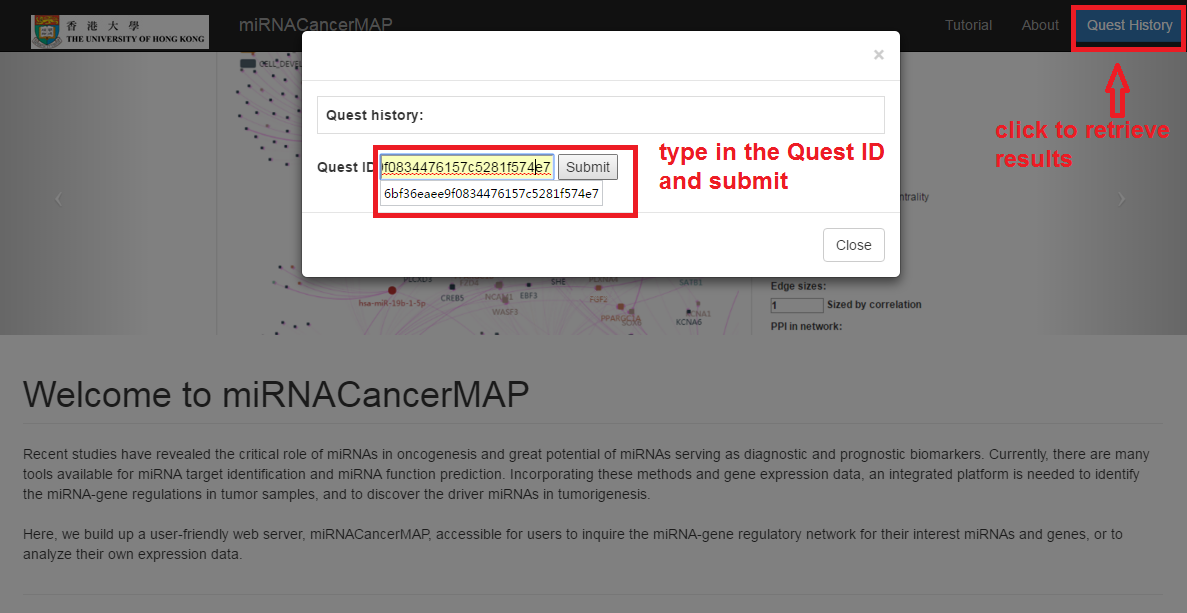
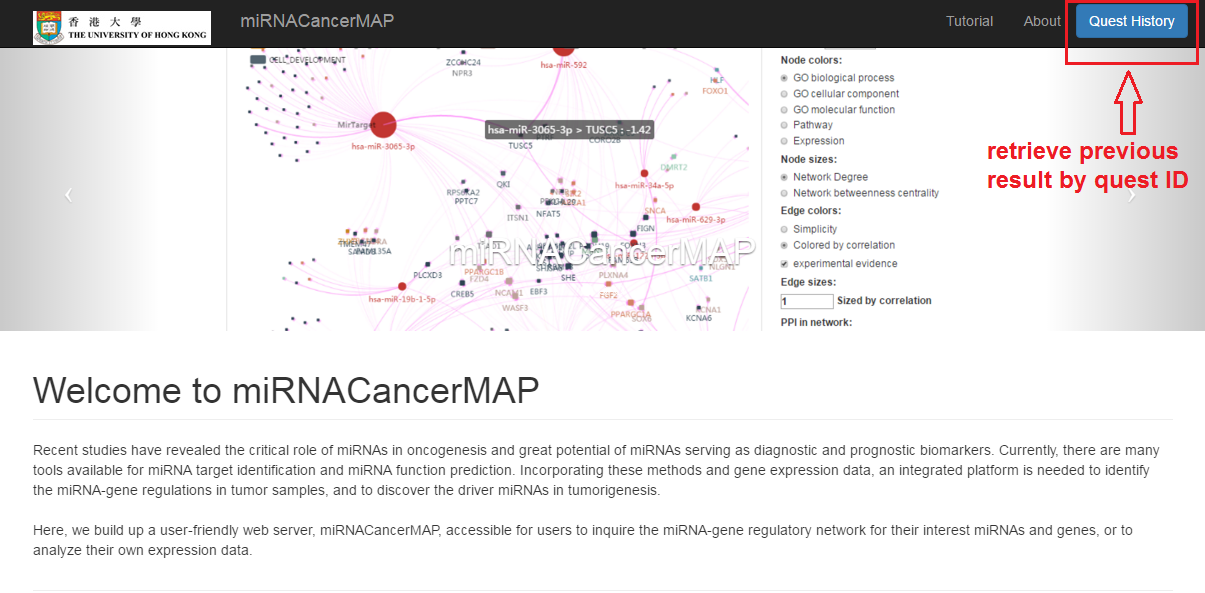
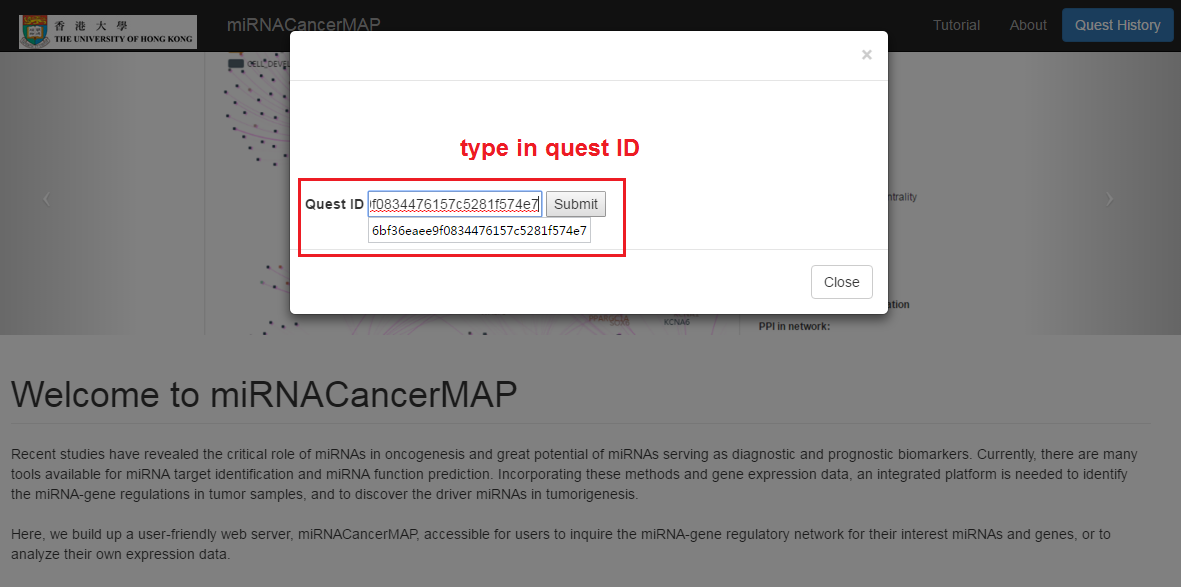
Retrieve previous network by quest ID
- Click on "Quest History" button
- Type in (paste in) your history quest ID (for example "ba2bc7f926b89c0ec078a1eaa6af64cb") and click on submit
- This example ("ba2bc7f926b89c0ec078a1eaa6af64cb") miRNA regulatory network is constructed for genes of Epithelial Mesenchymal Transition from TCGA breast cancer dataset
Click on "Quick Search"

Input the miRNA and click "Search"
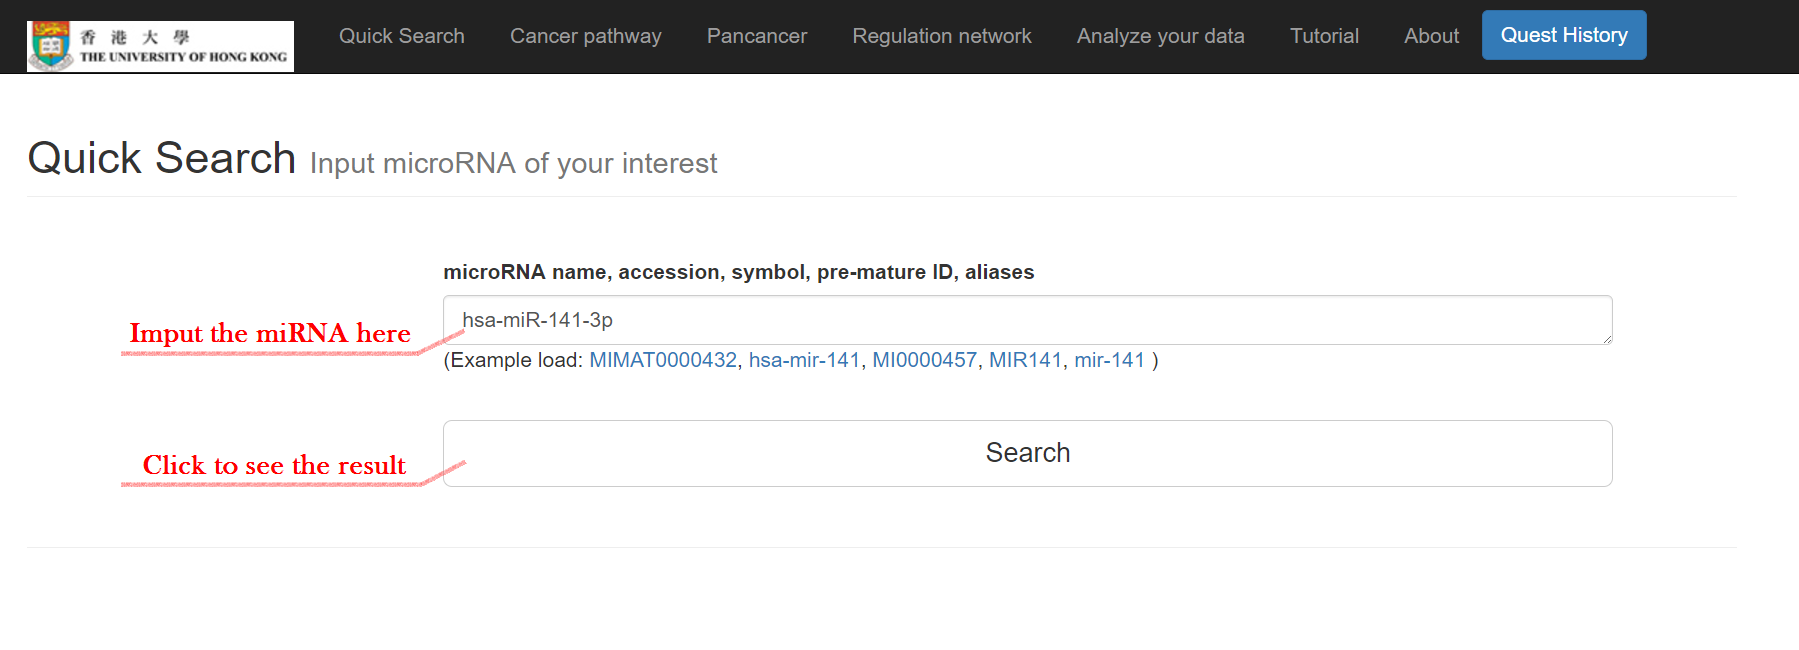
The basic information of the miRNA will then show
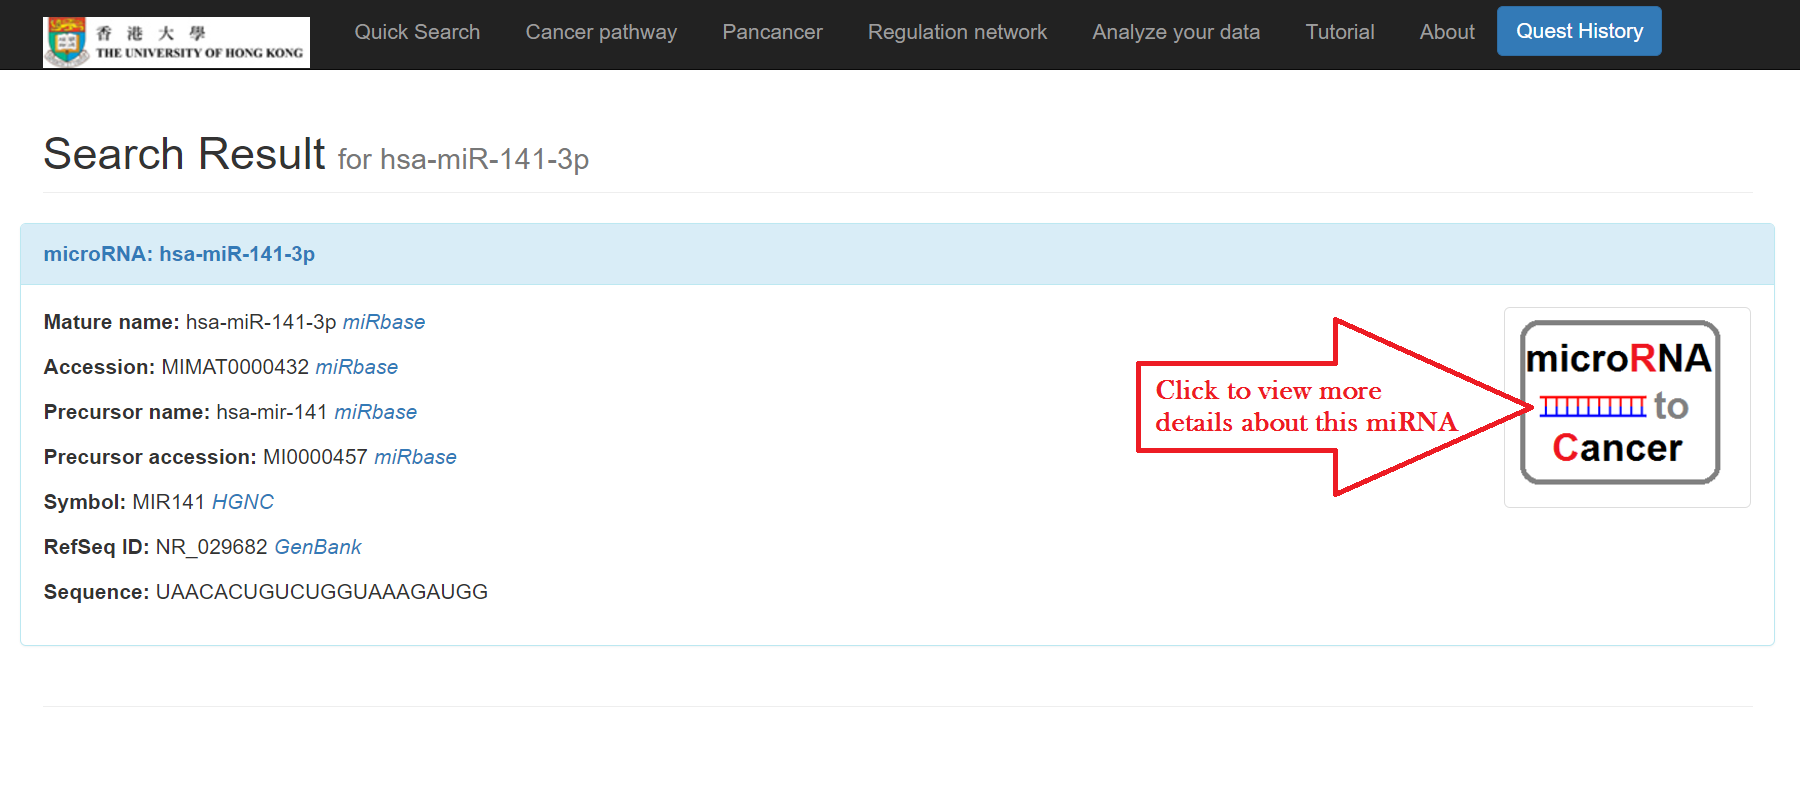
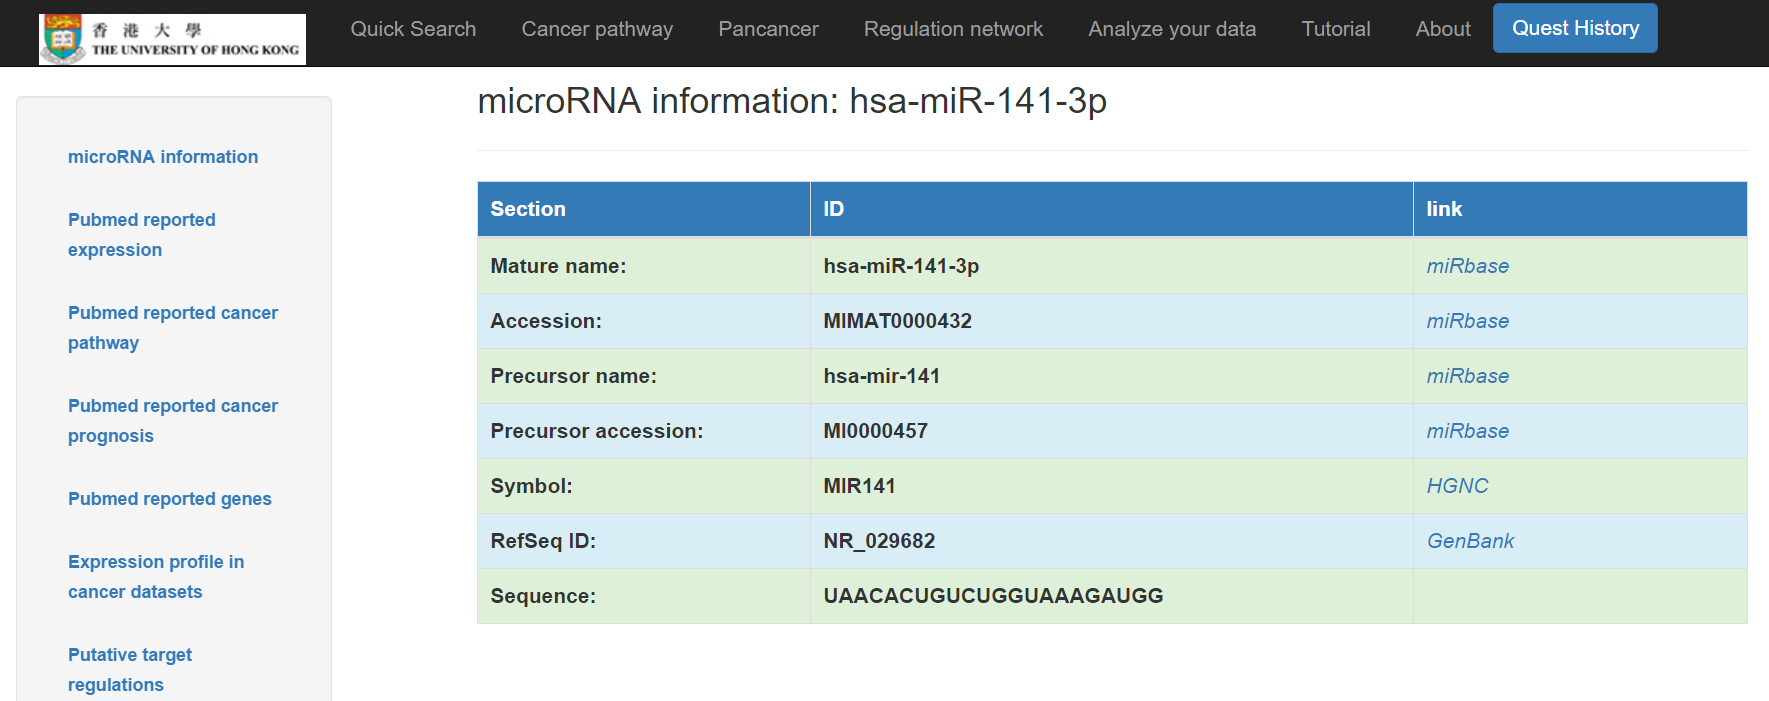
Click the symbol on the right for more details including:
- Basic information: mature name, accession, precursor name, precursor accession, symbol, RefSeq ID, and sequence of the miRNA are included with links respectively
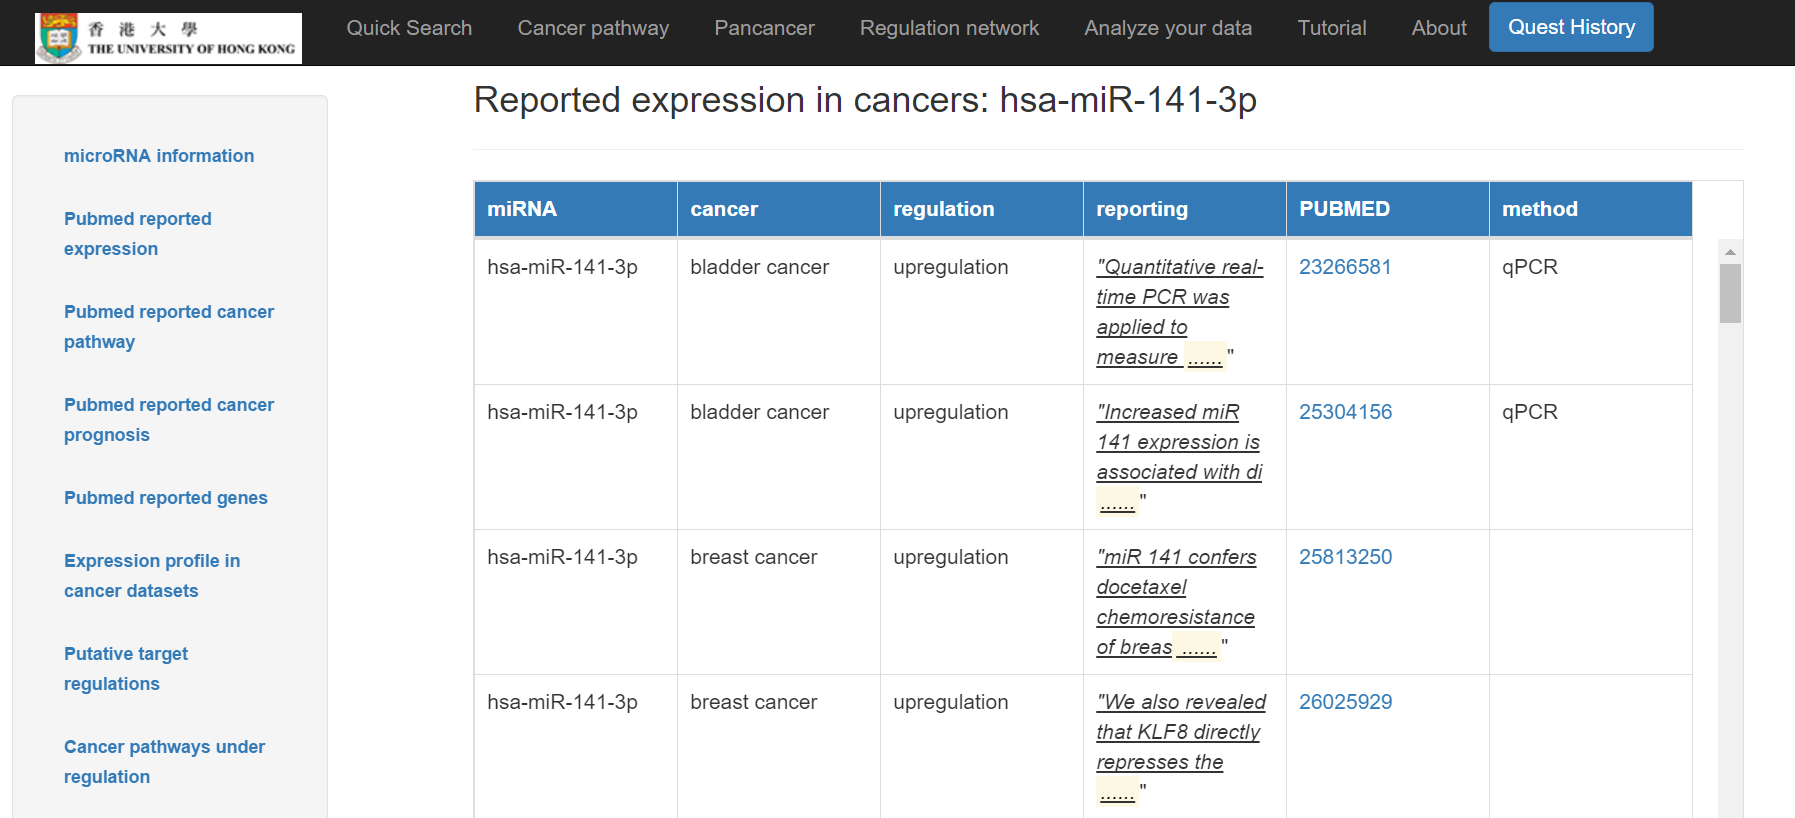
- The miRNA's reported expression in cancers: cancers with Pubmed reported expression of the miRNA and the regulation with Pubmed links respectively
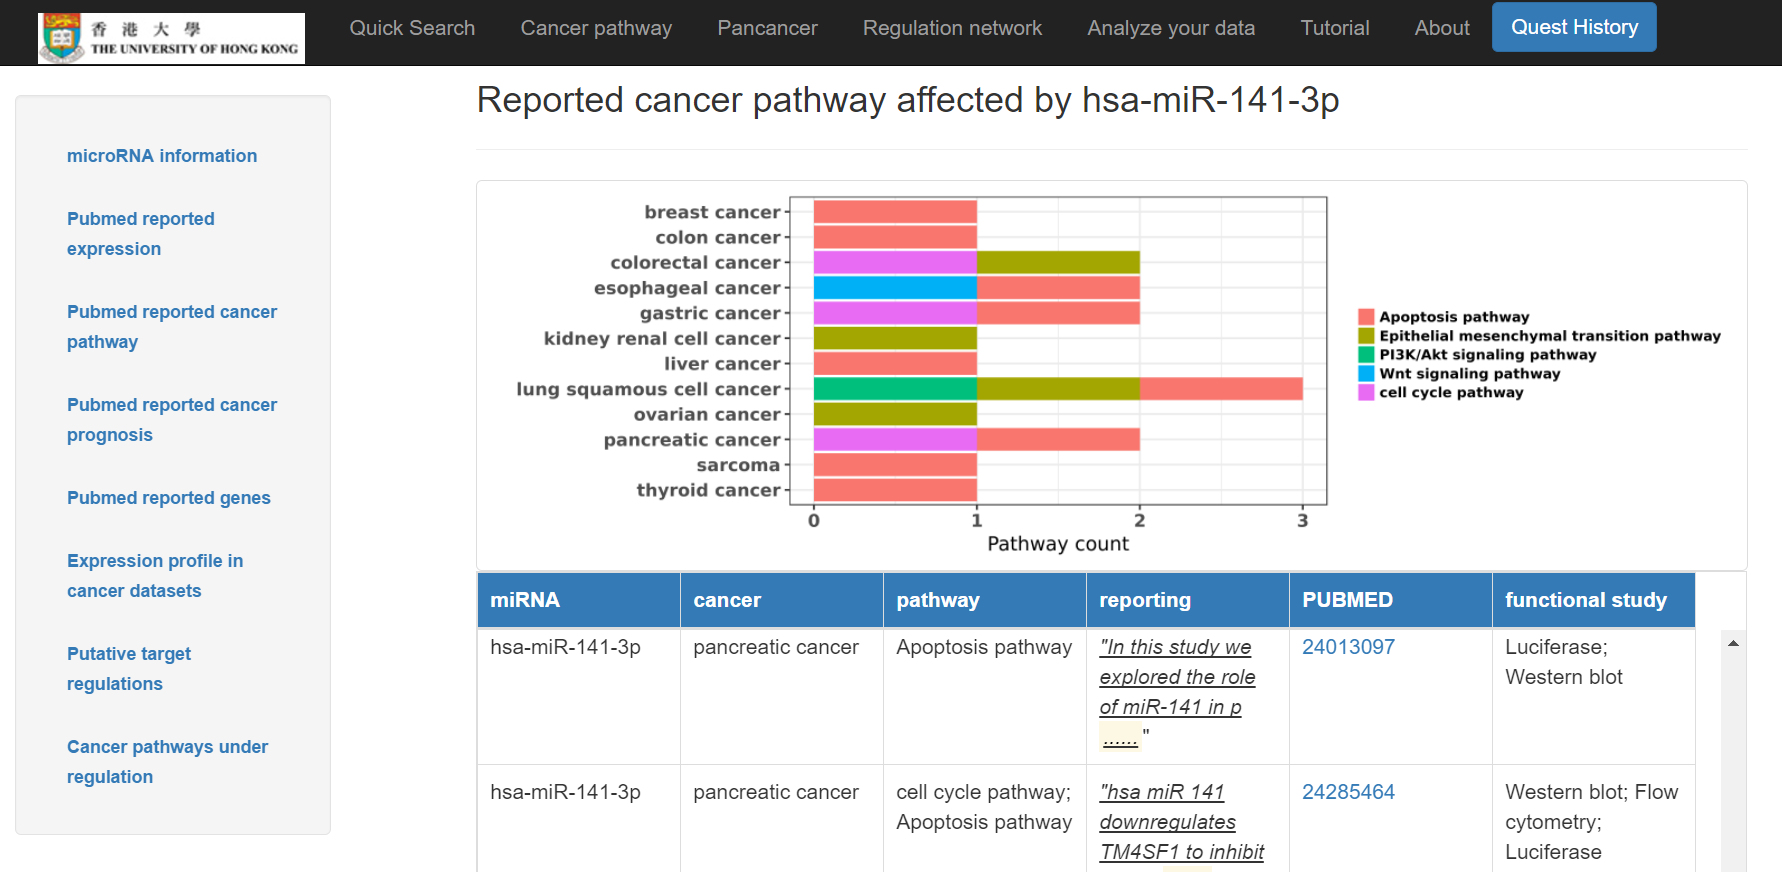
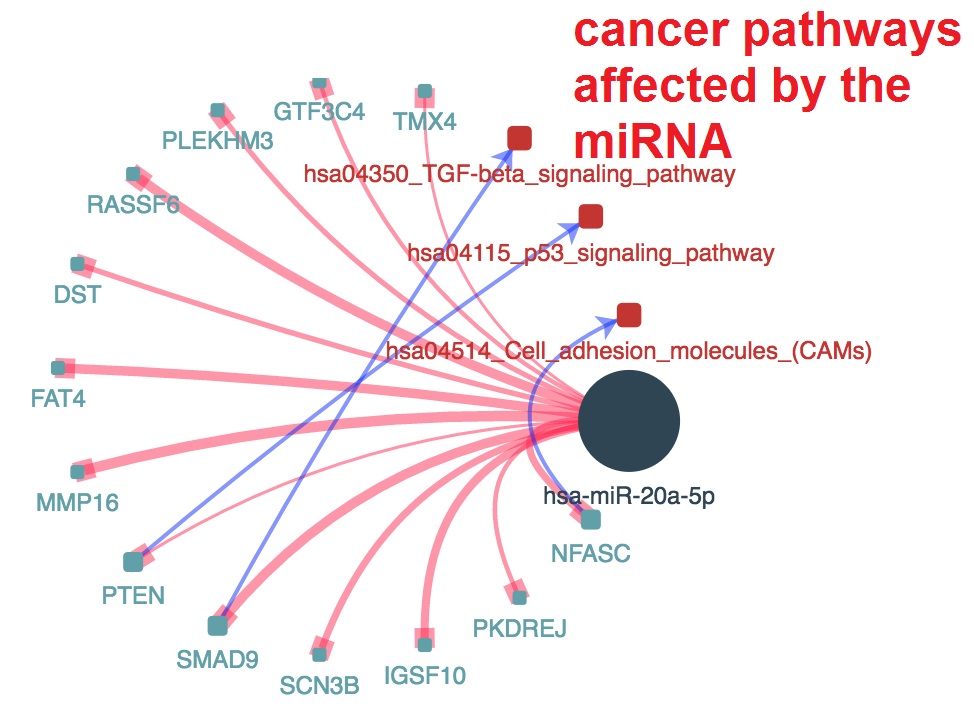
- Reported cancer pathways affected by the miRNA shown in a chart and a table below with Pubmed links
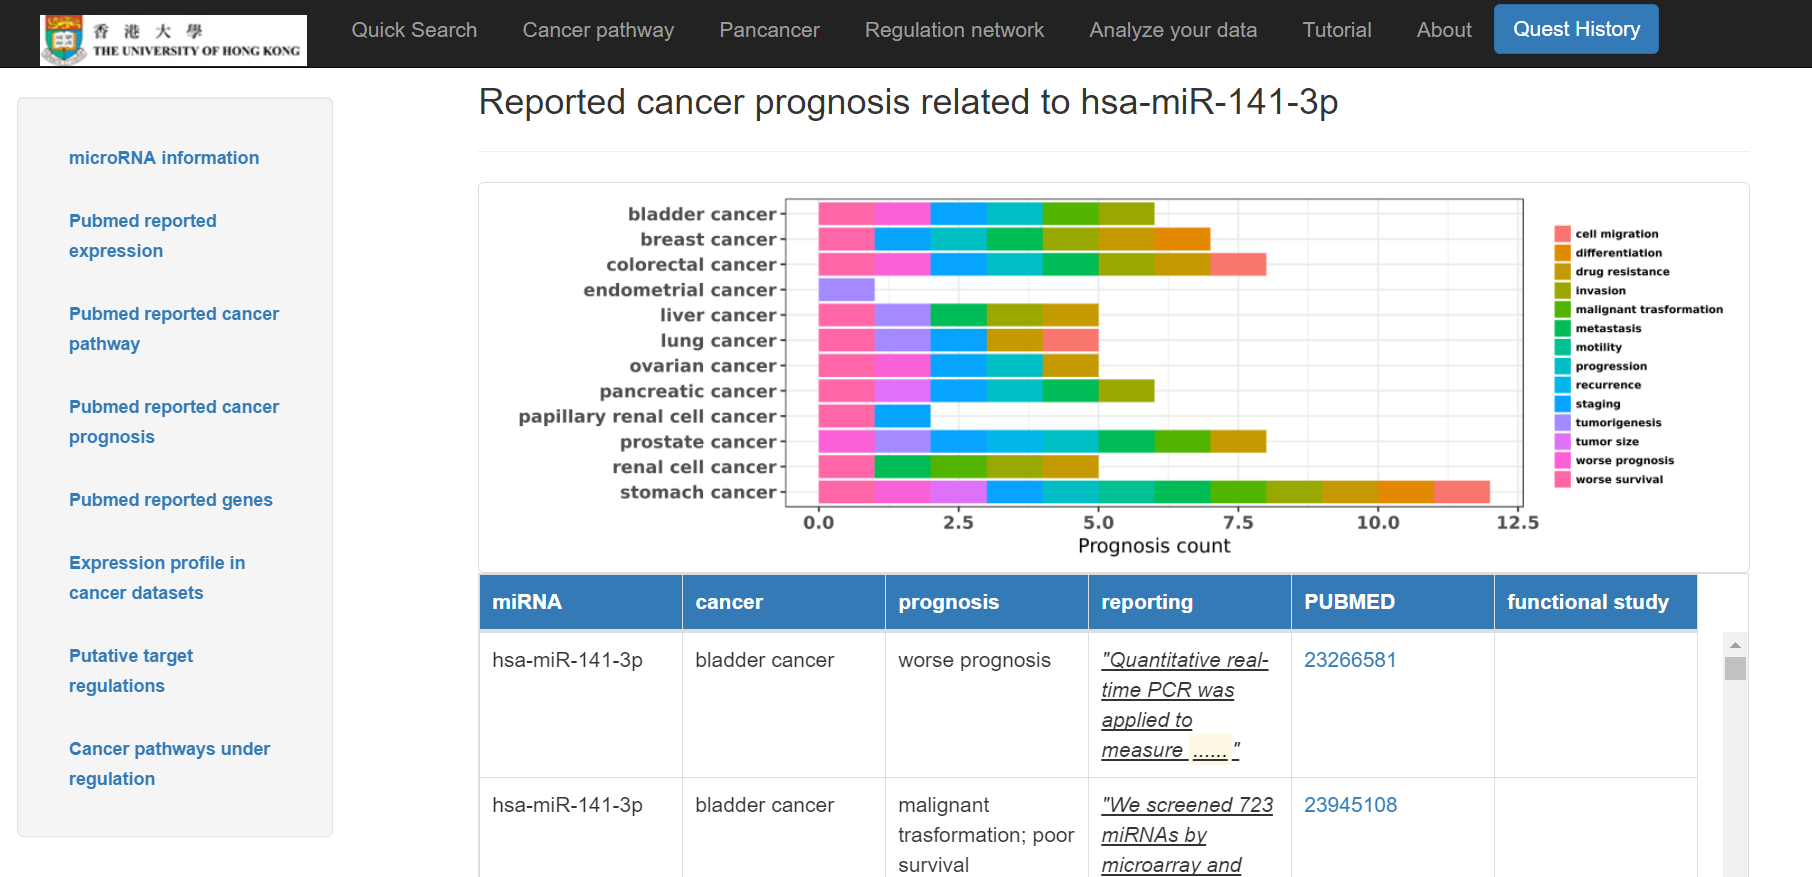
- Reported cancer prognosis related to the miRNA in distinct types of cancer shown in a chart and a table below with Pubmed links
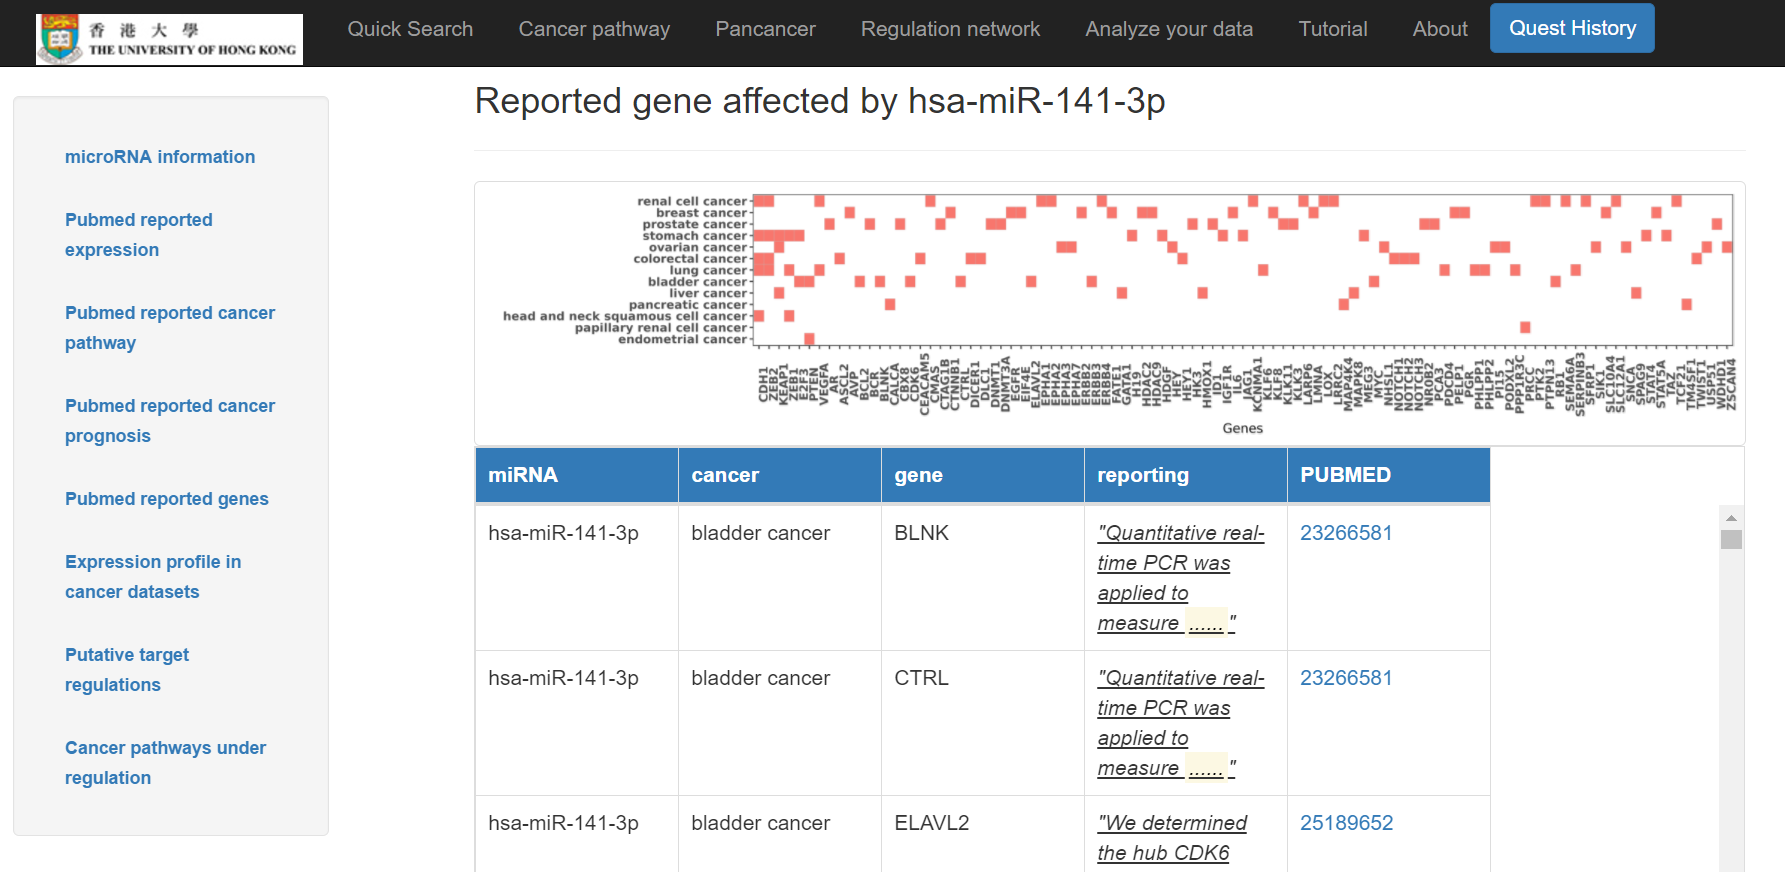
- Reported genes affected by this miRNA shown in a chart and a table with Pubmed links
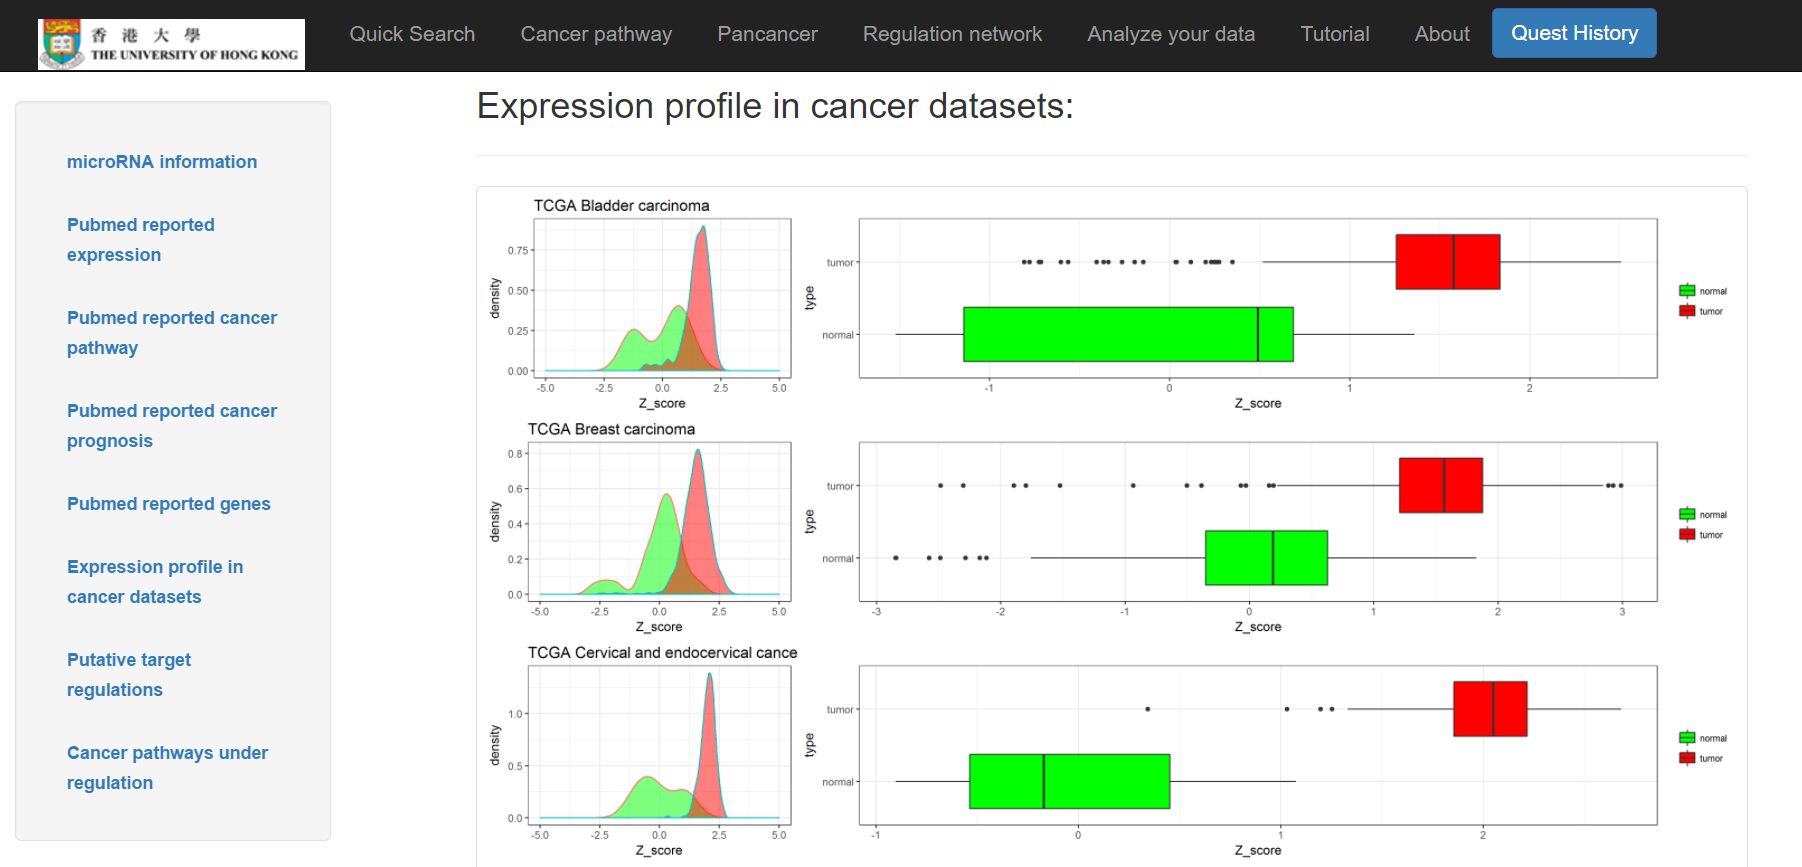
- Expression profile of distinct cancer types in cancer datasets
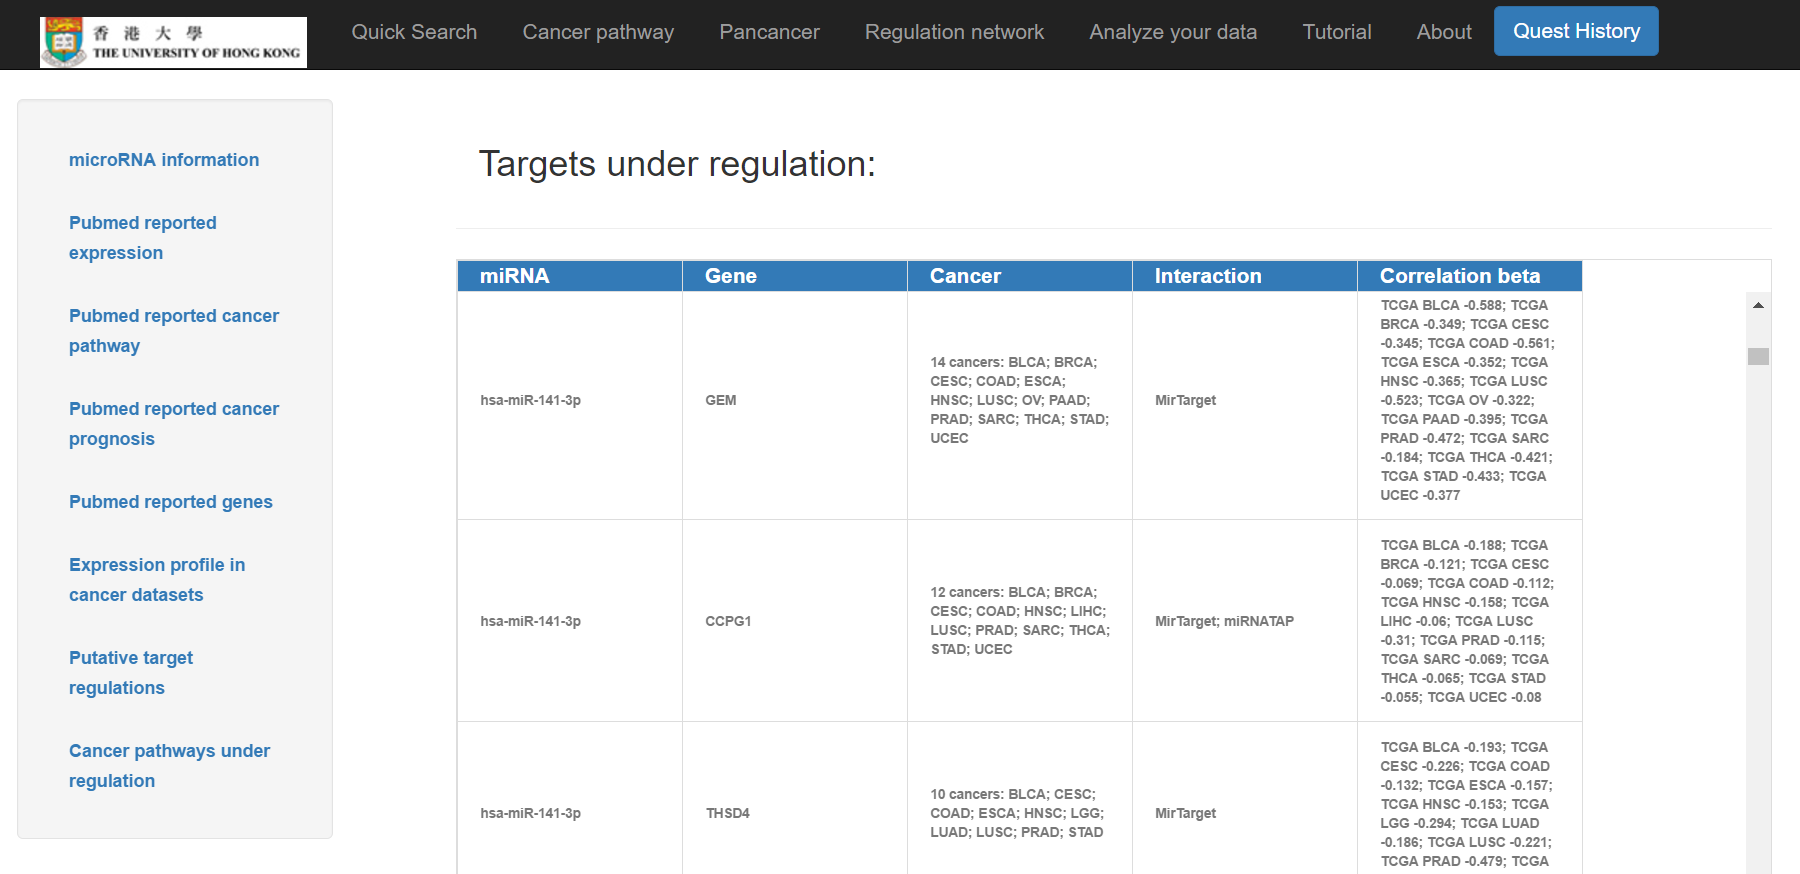
- Putative target regulations, including genes, cancer types and the interaction
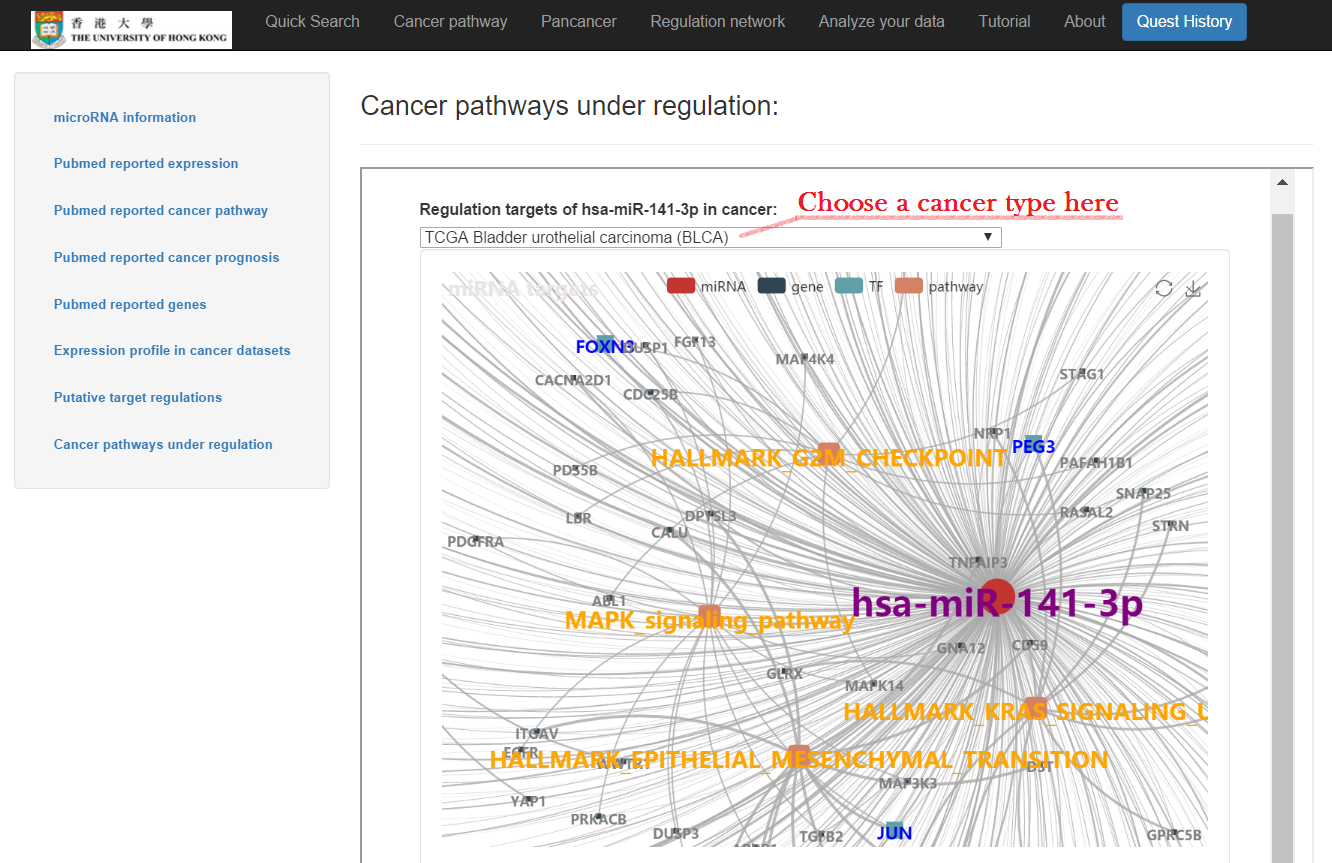
- Cancer pathways under regulation: a network of regulation targets, and a table with enriched pathways and genes under regulation included
Click on "Cancer pathway"

Select the pathway and click "Search"
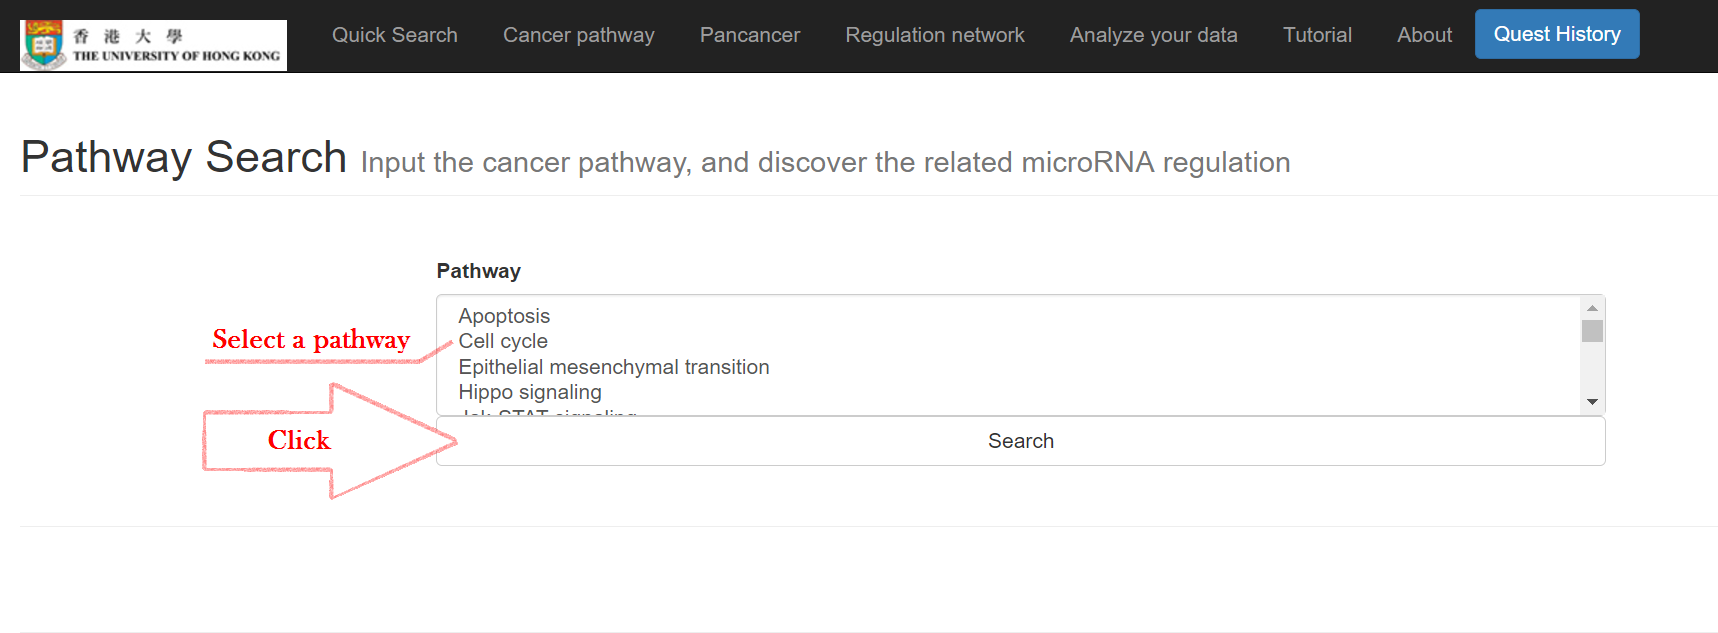
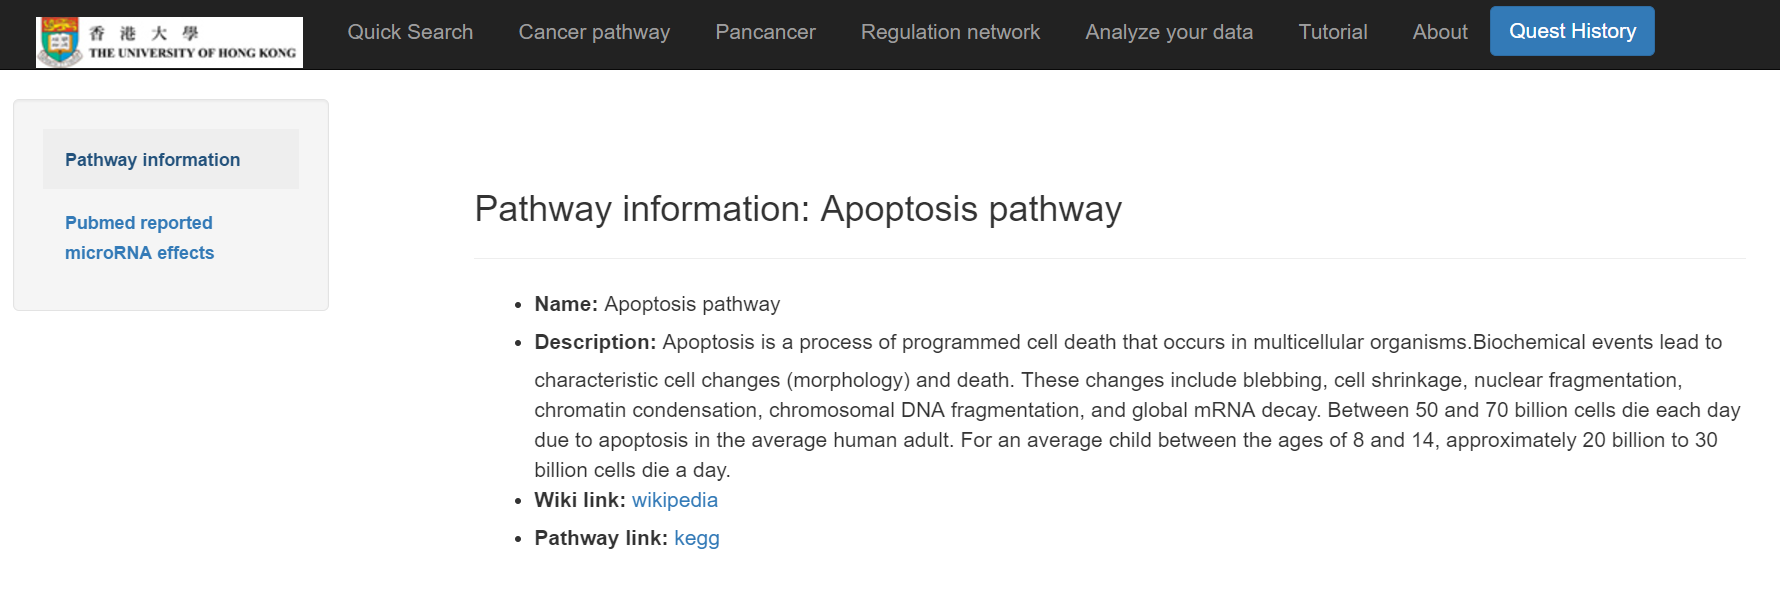
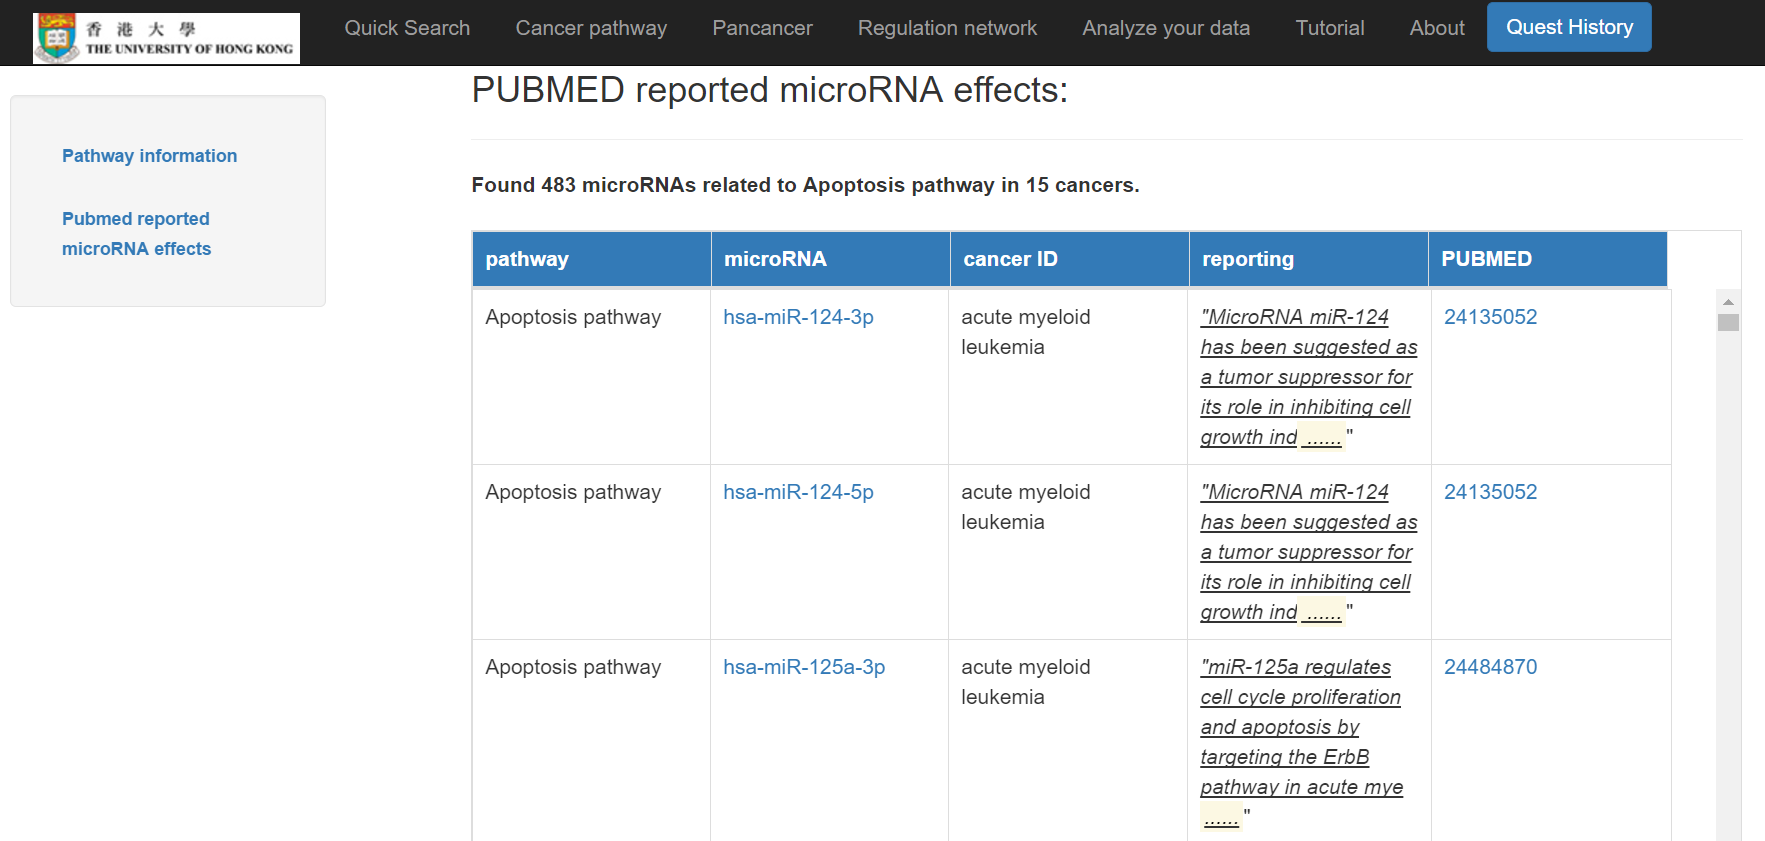
The information of the cancer pathway and its miRNA effects will then show
Click on "Pan-cancer"

Input miRNAs and click "Submit"
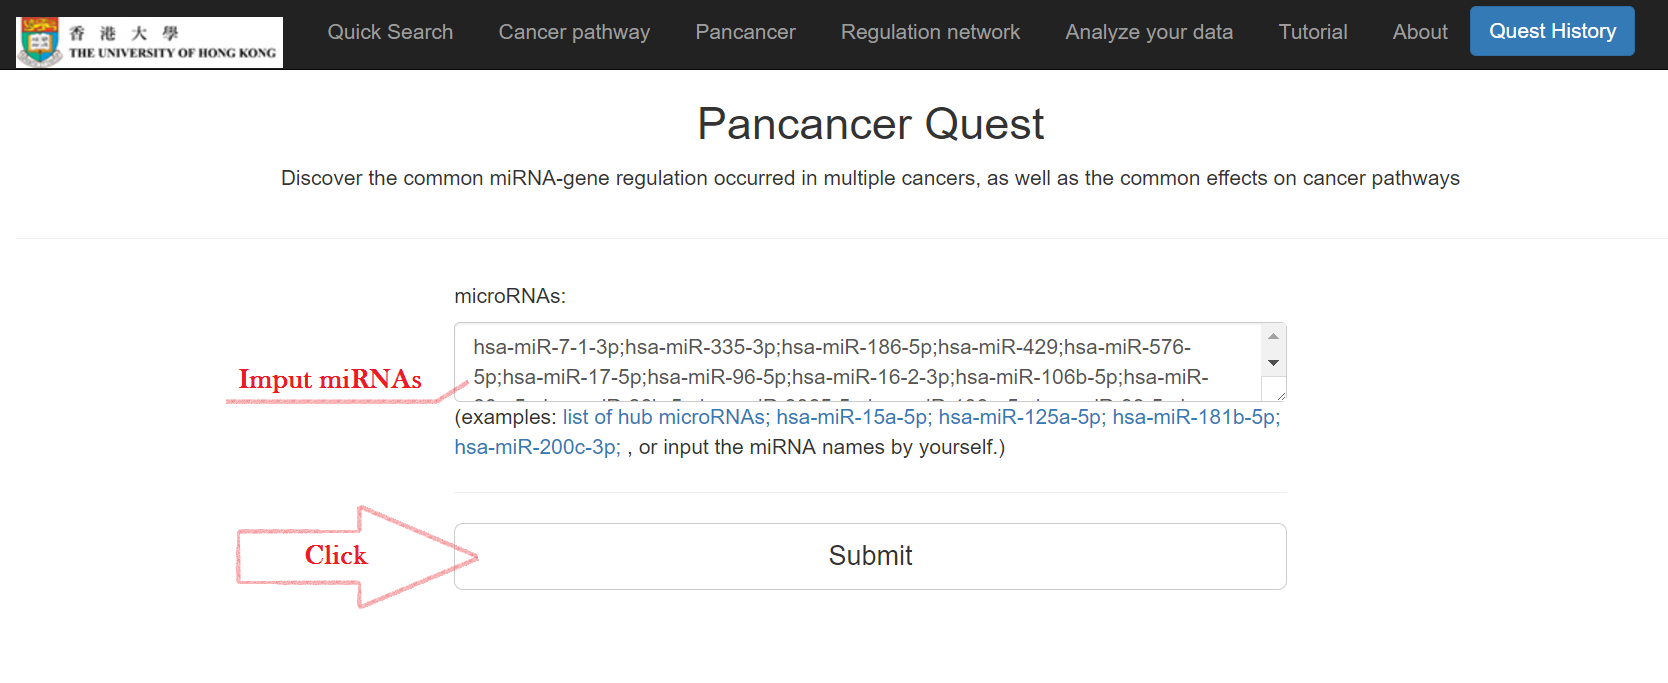
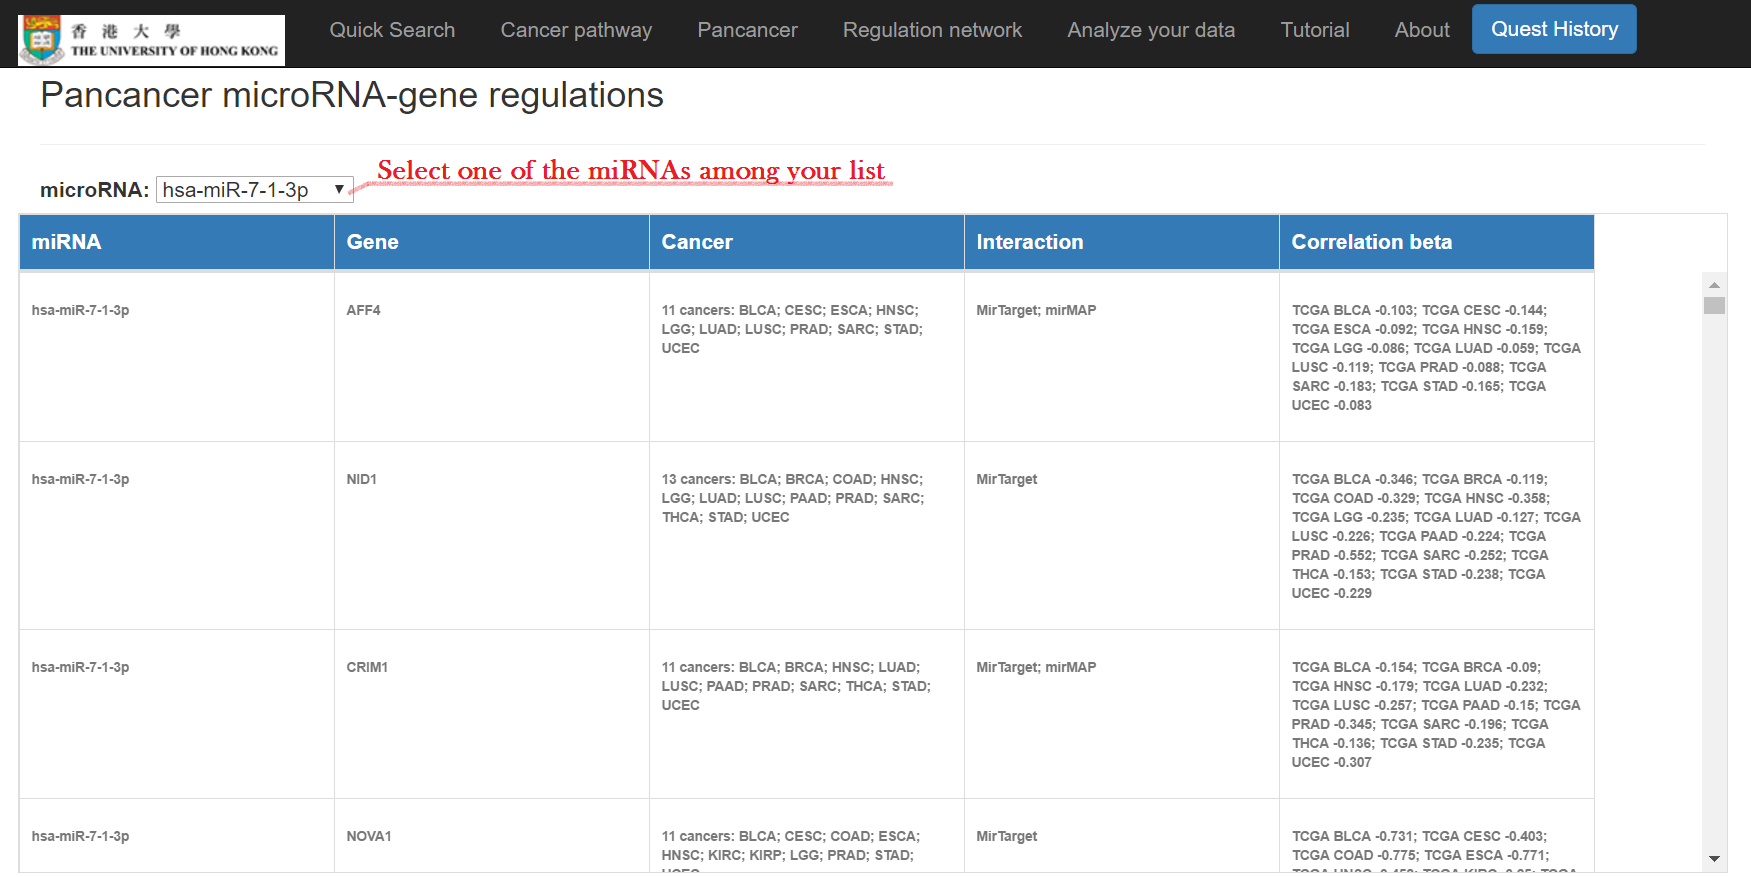
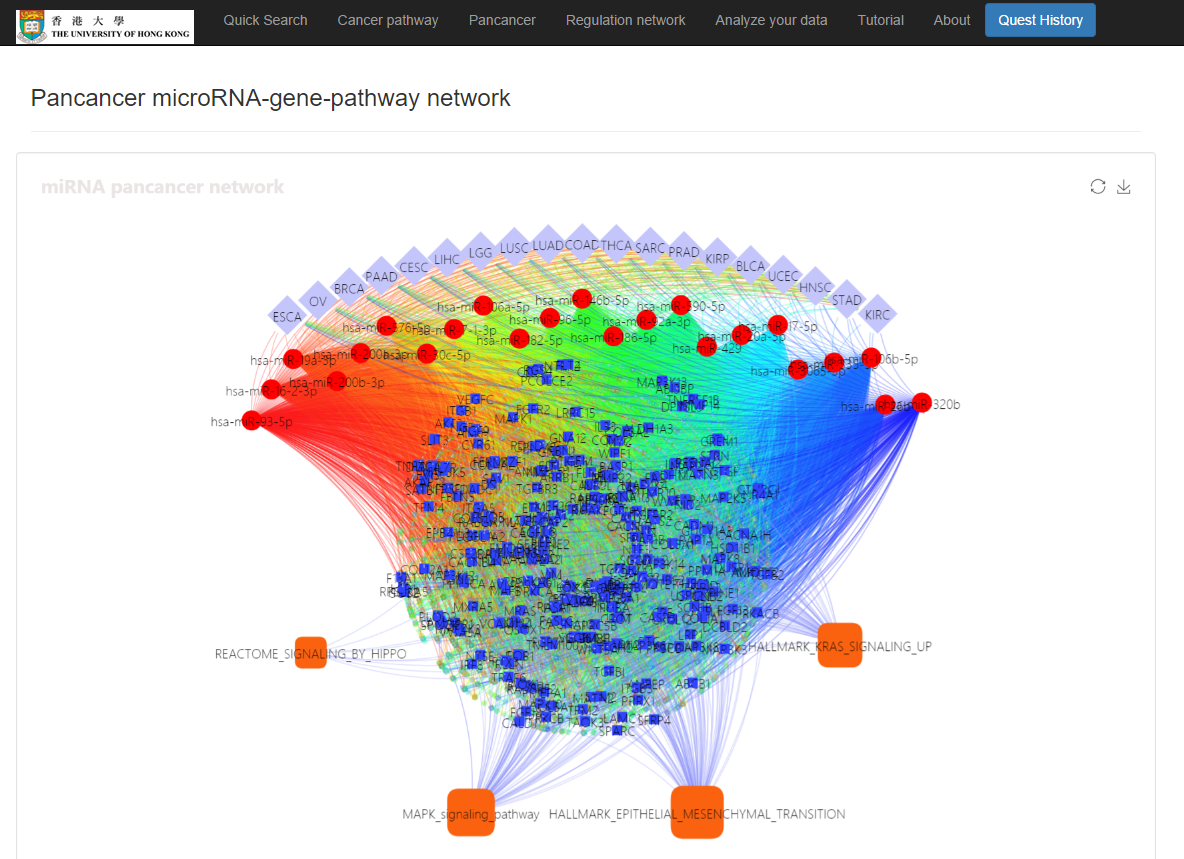
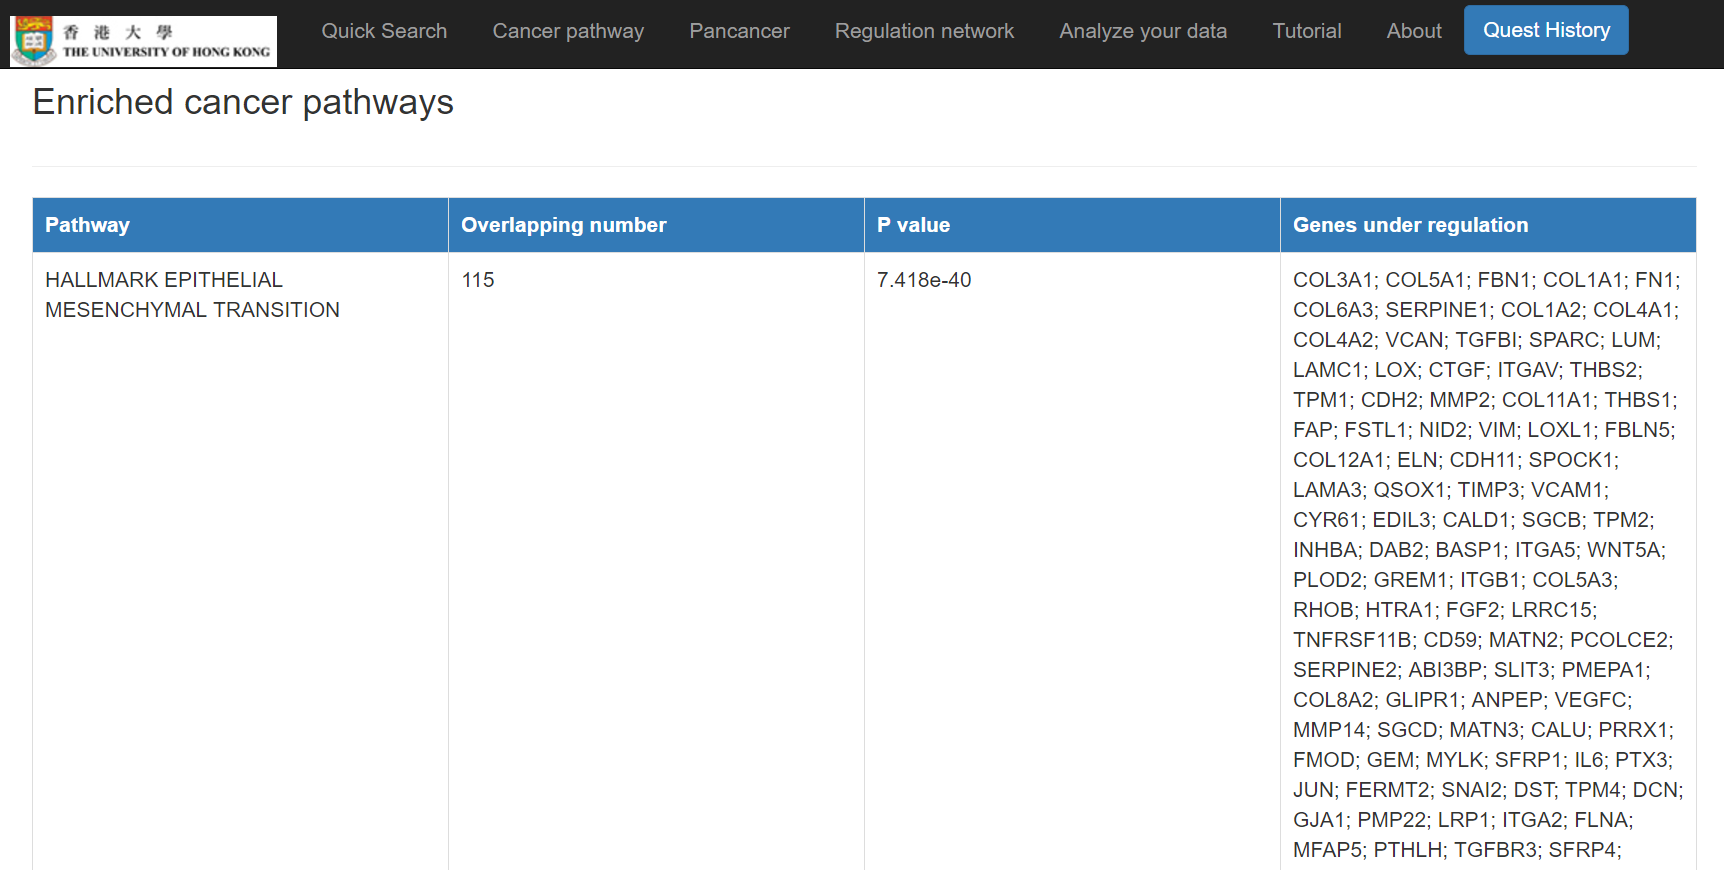
Pan-cancer miRNA-gene regulations, a miRNA-gene-pathway network, and enriched cancer pathways will show
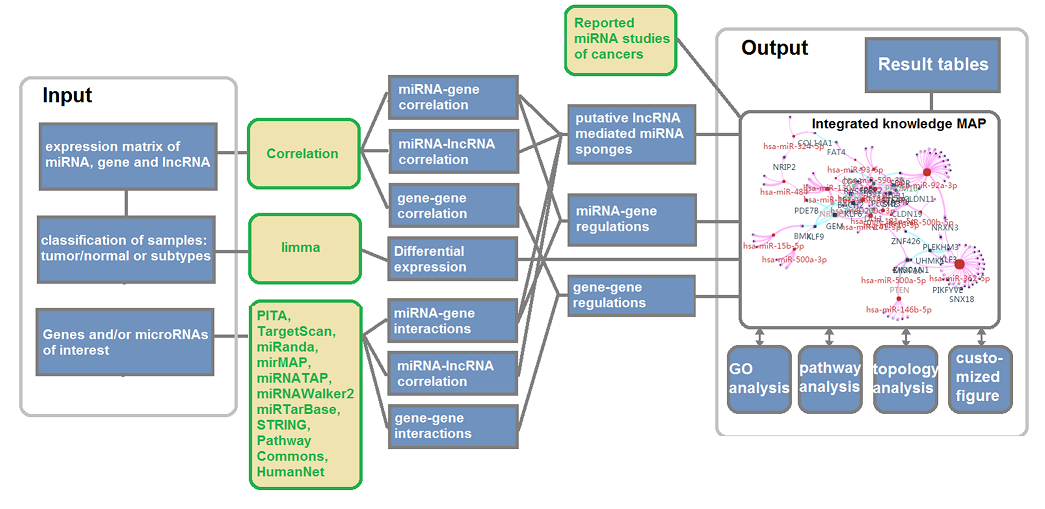
Input your mRNA list and/or miRNA list and discover the miRNA-mRNA regulations and regulatory network. The miRNA-mRNA regulations will be inferred from both interactions and expression correlations. The designated methods (e.g. MirTarget, PITA, and/or TargetSCAN) will be used to infer the miRNA-mRNA interactions. And the public data of selected cancer type will be used in learning the correlation between miRNAs and mRNAs, and in constructing the regulatory network. TCGA RNA-seq data has been applied in this work so far.
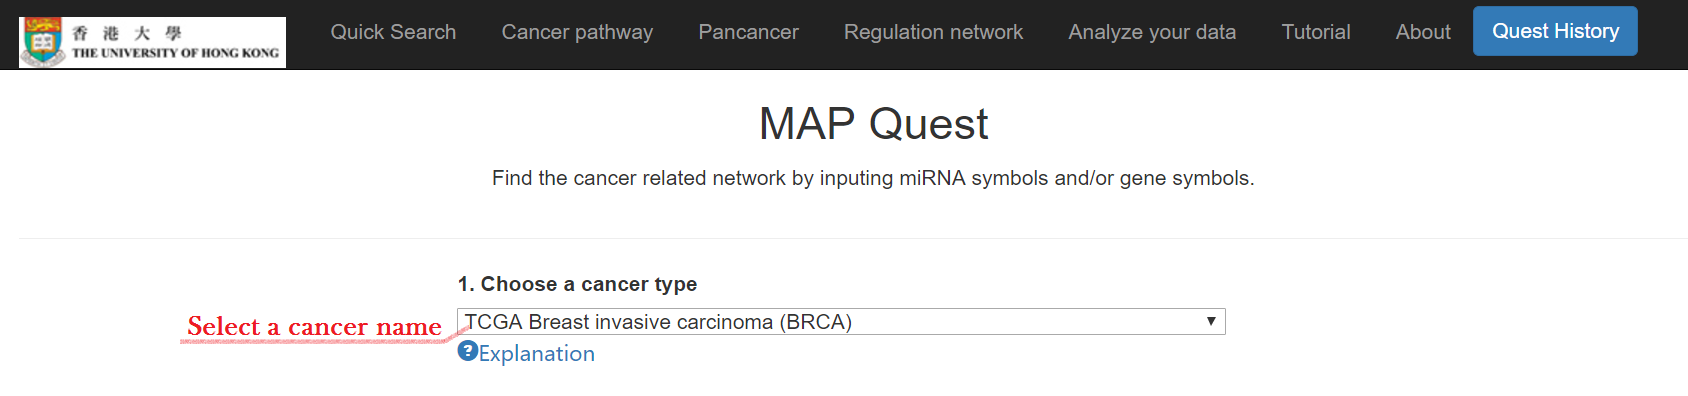
Click "Regulation network"

Select your interest cancer
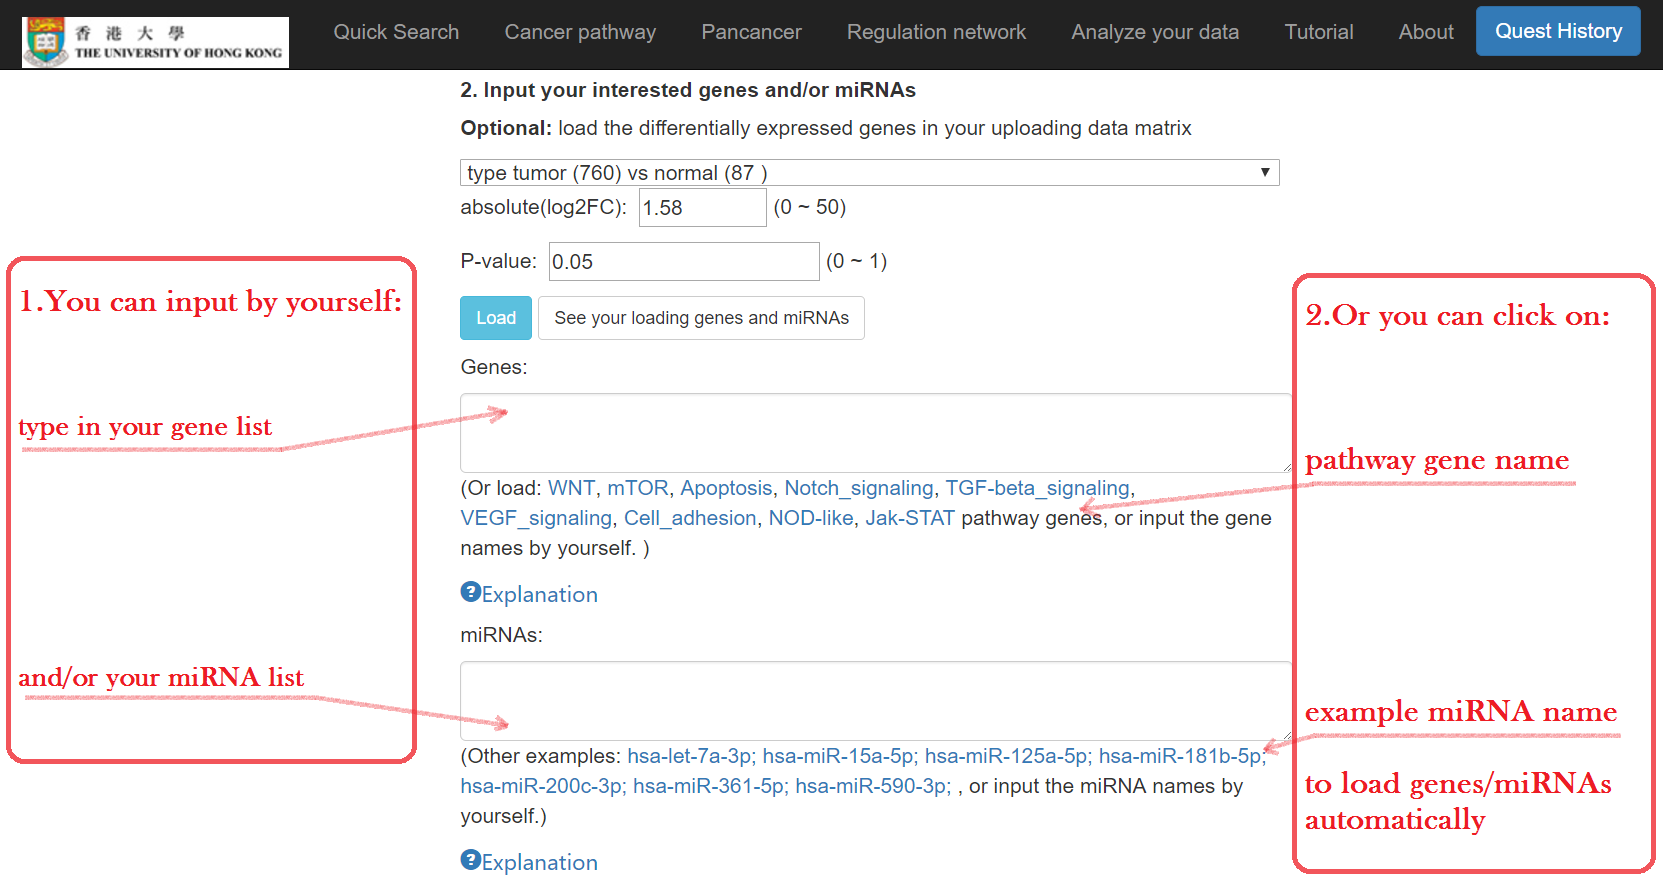
Type in your mRNA and/or miRNA symbols
- OR click and load the example mRNA list
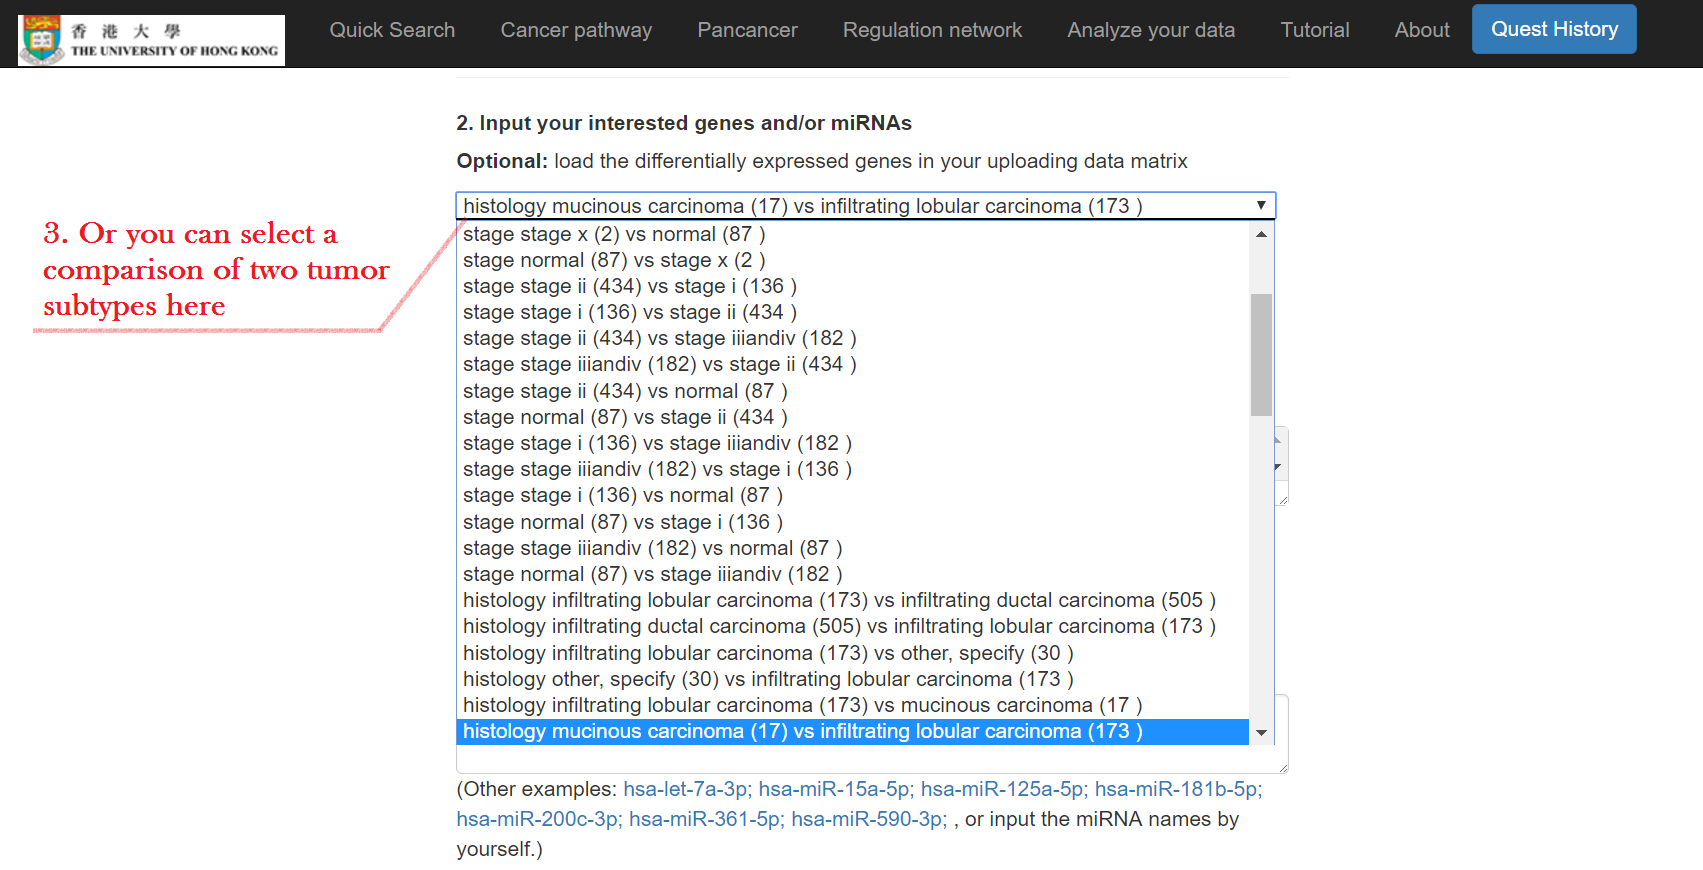
- OR select a comparison group of tumor subtypes to load the list
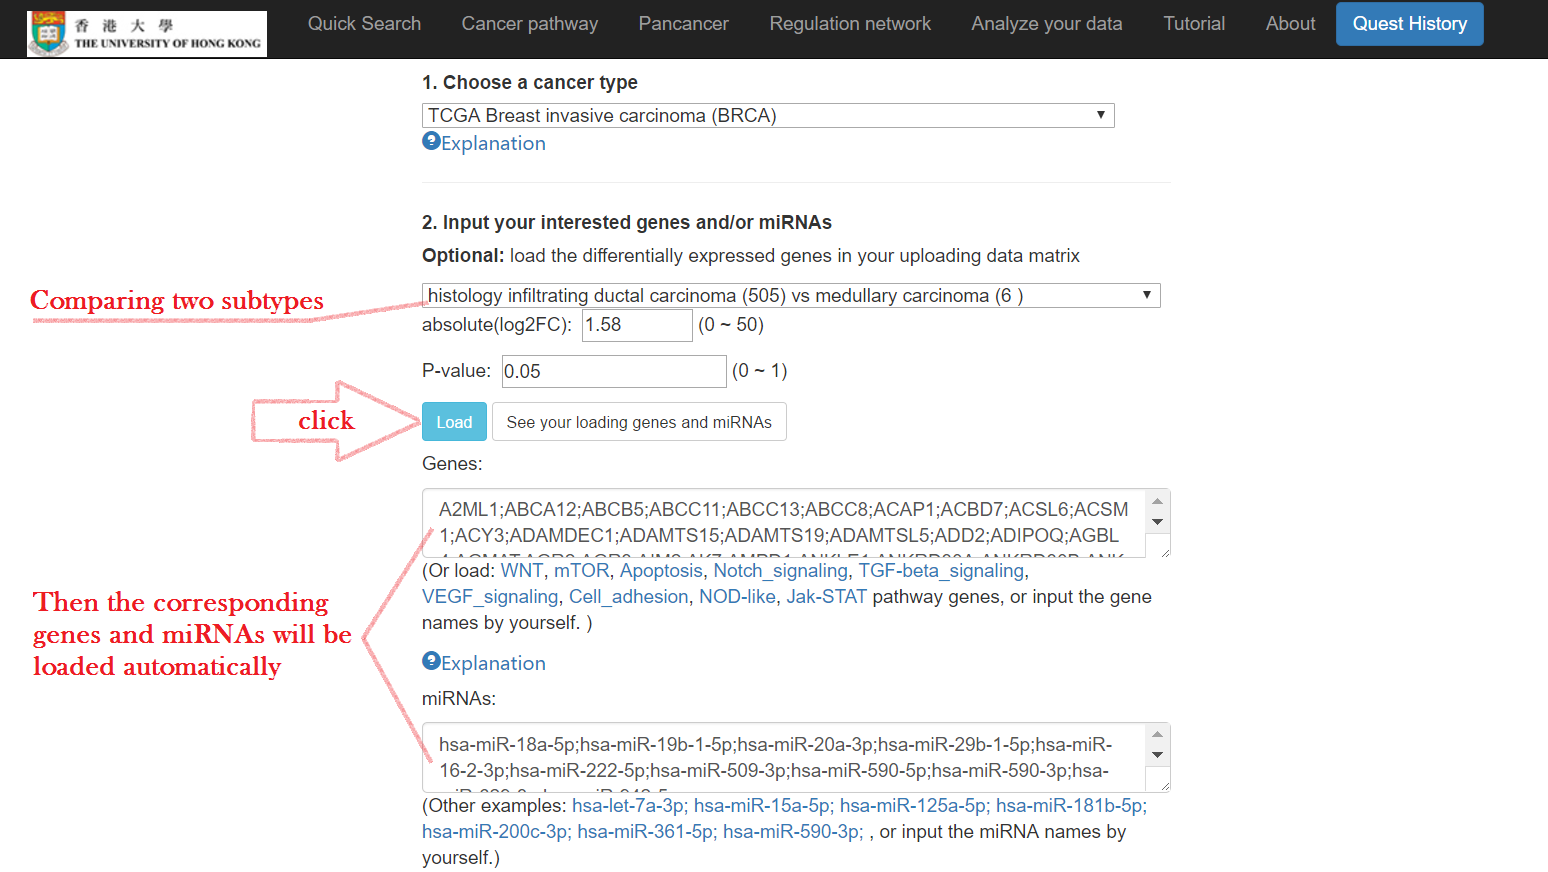
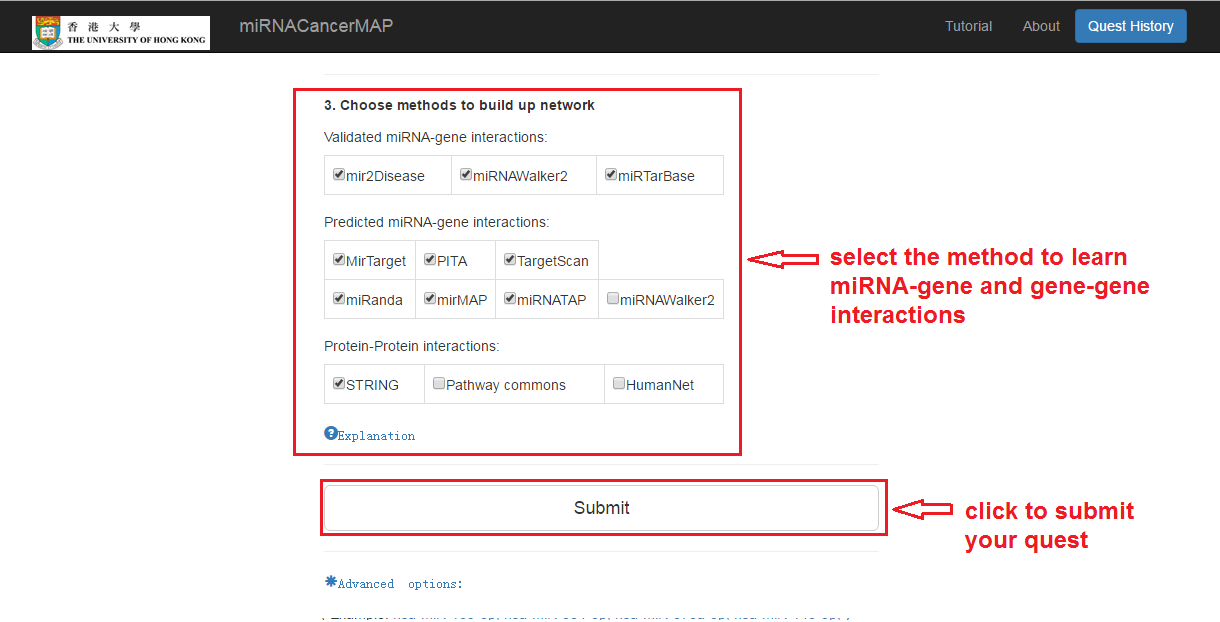
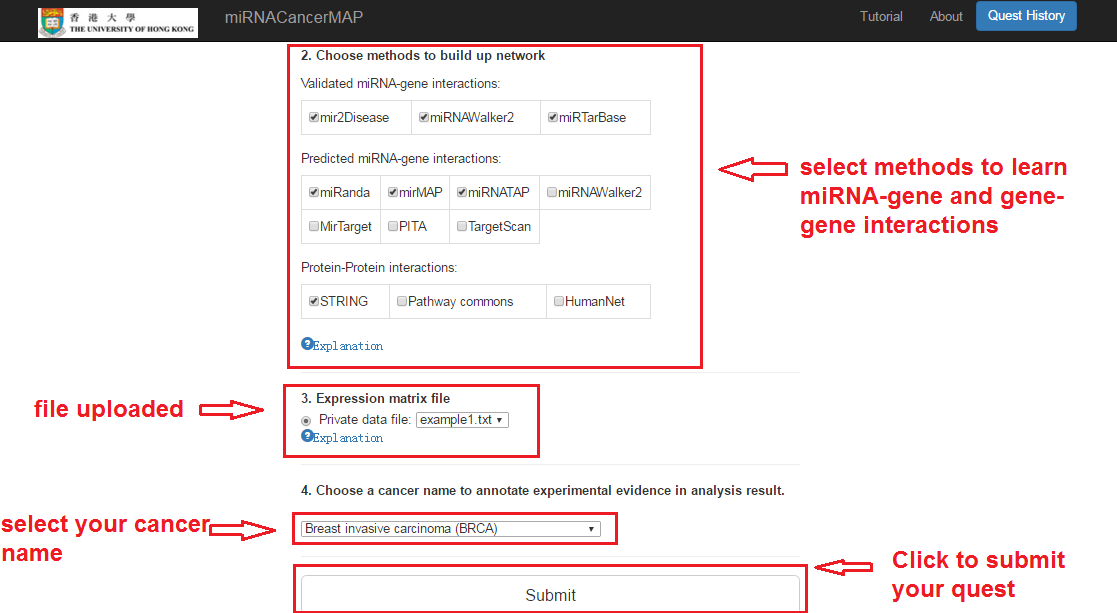
Choose methods to find miRNA-mRNA interactions
Submit your quest
Waiting for several seconds (10s~30s)
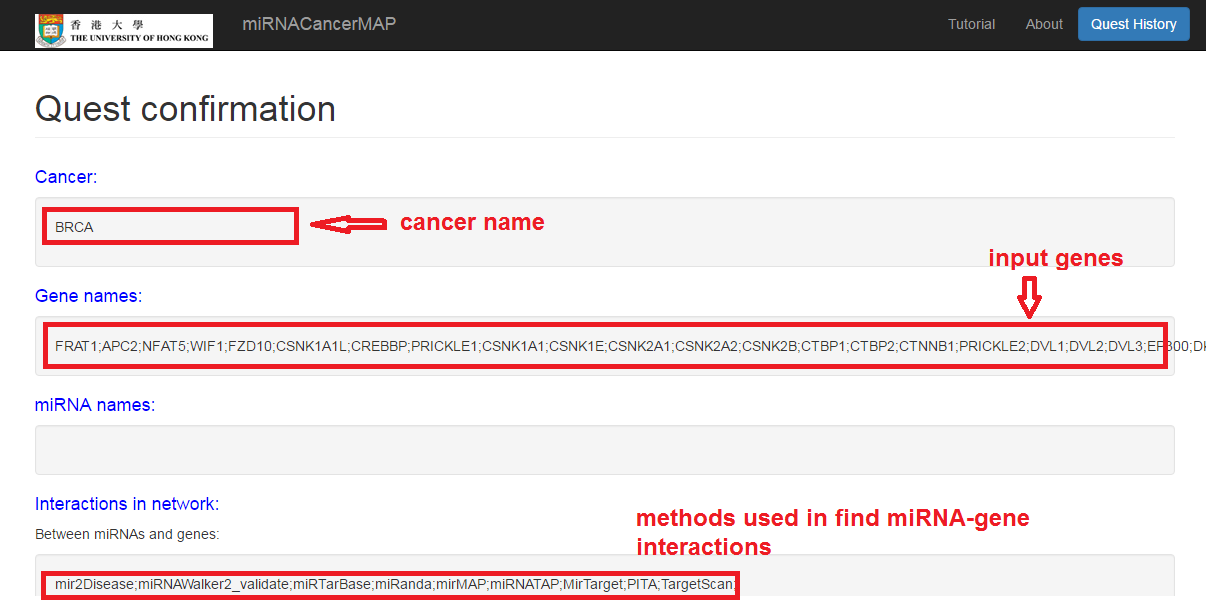
Check your quest details
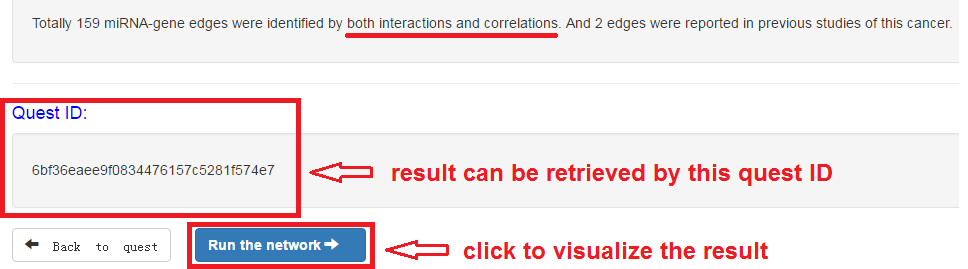
Check the quest result and visualize the network
- Result can be retrieved by quest ID
- Click to visualize the network
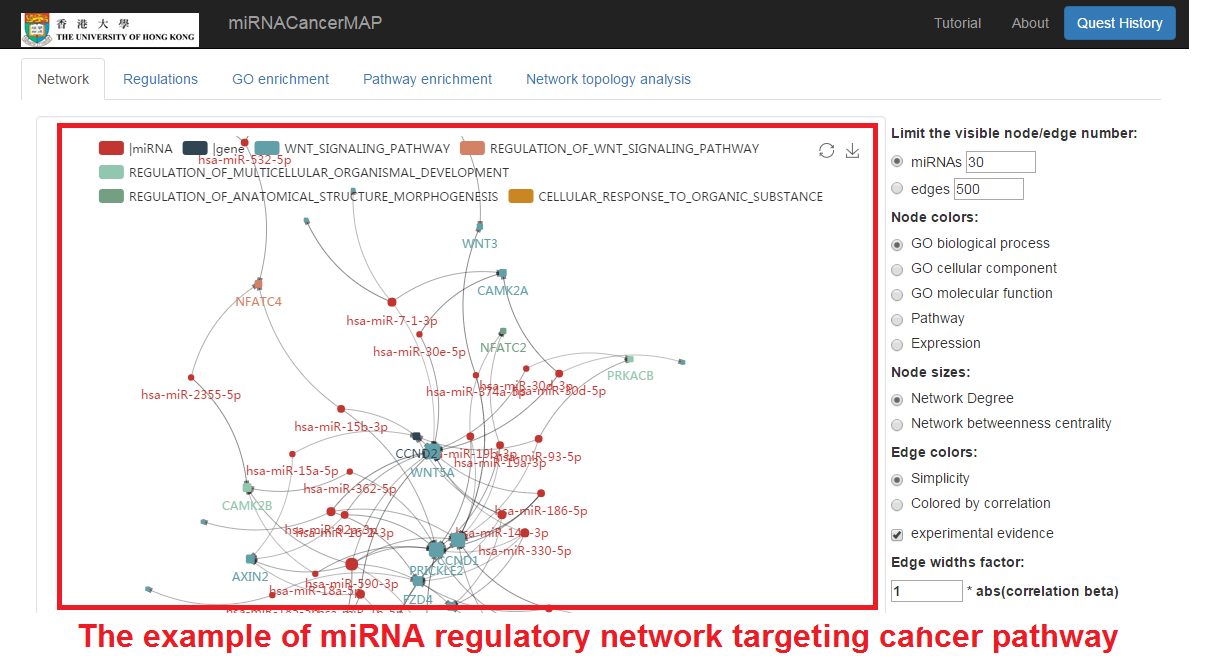
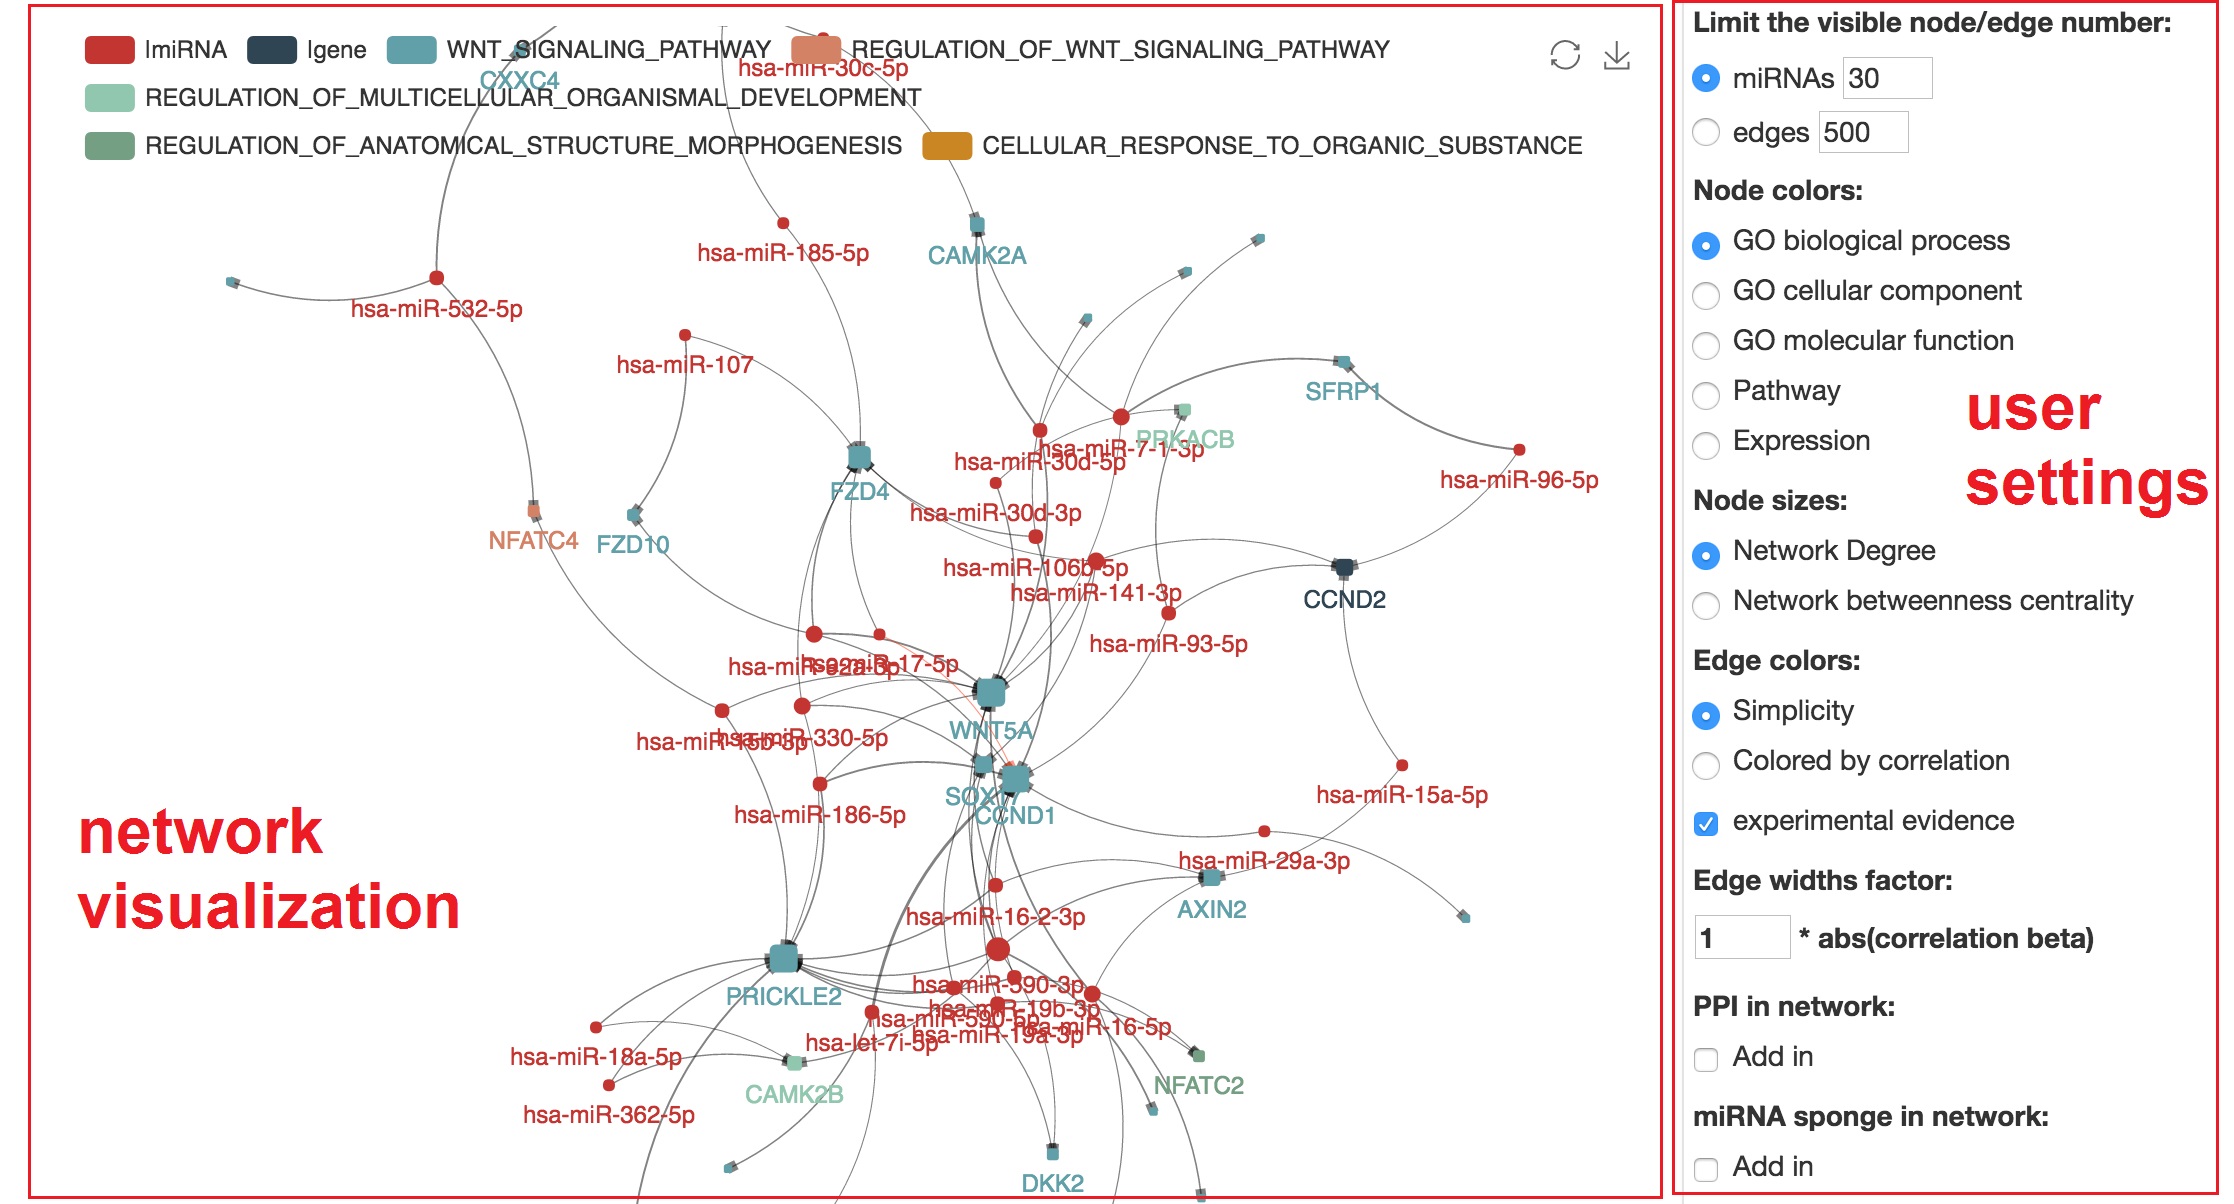
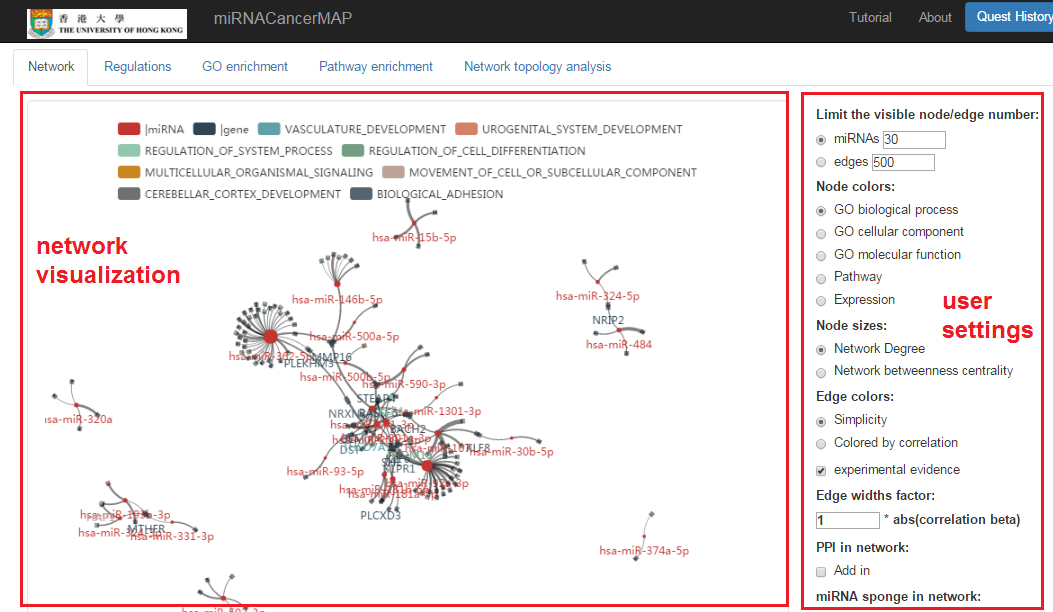
miRNA-mRNA regulatory network visualization
- In network visualization panel, we can zoom-in/out and drag the network
- In user's setting panel, we can adjust network appearance by personal customization
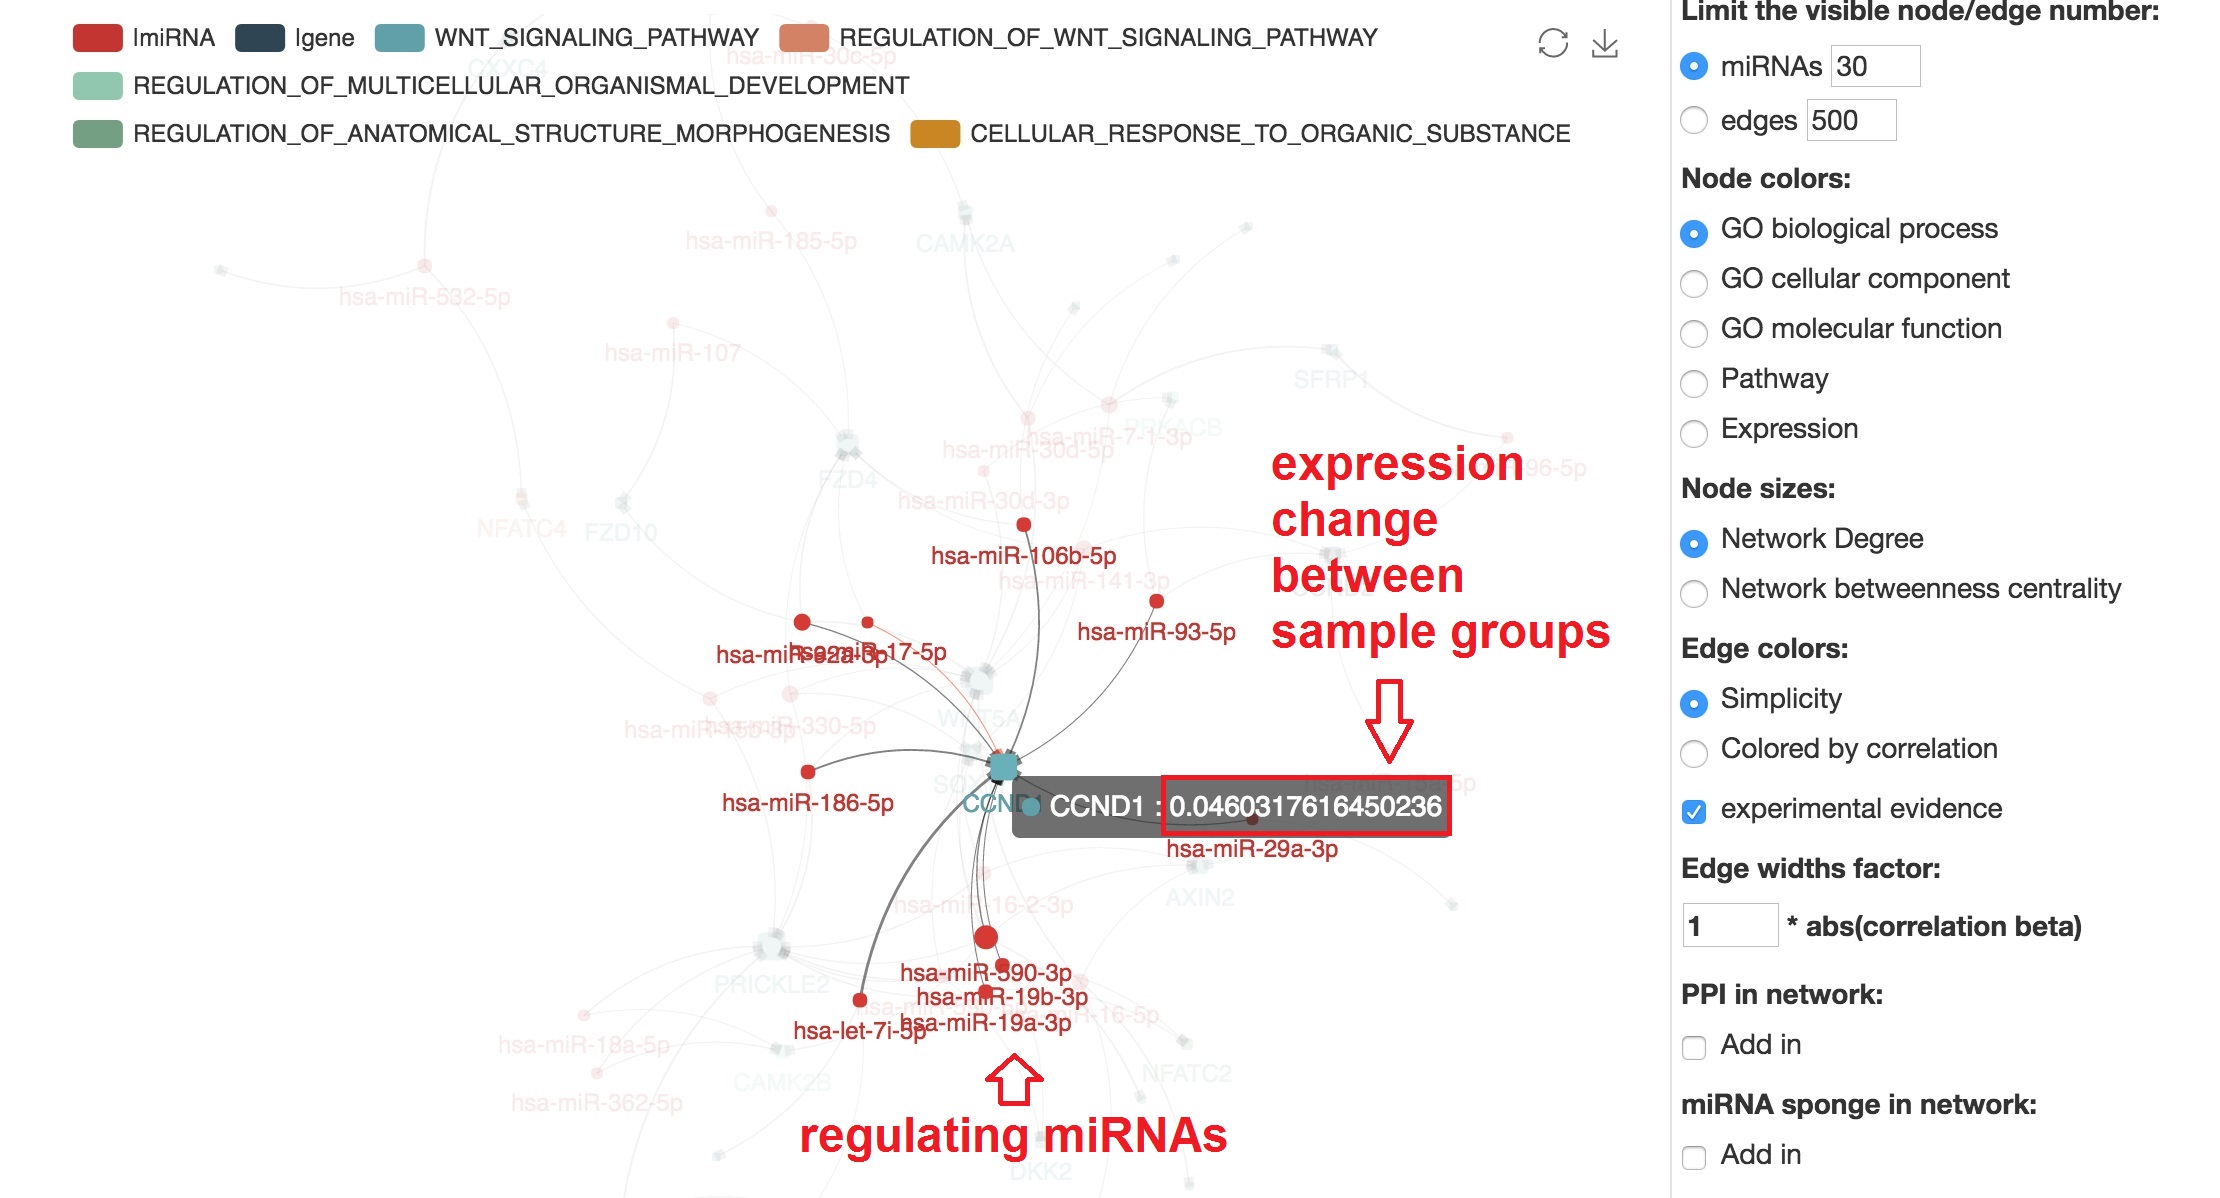
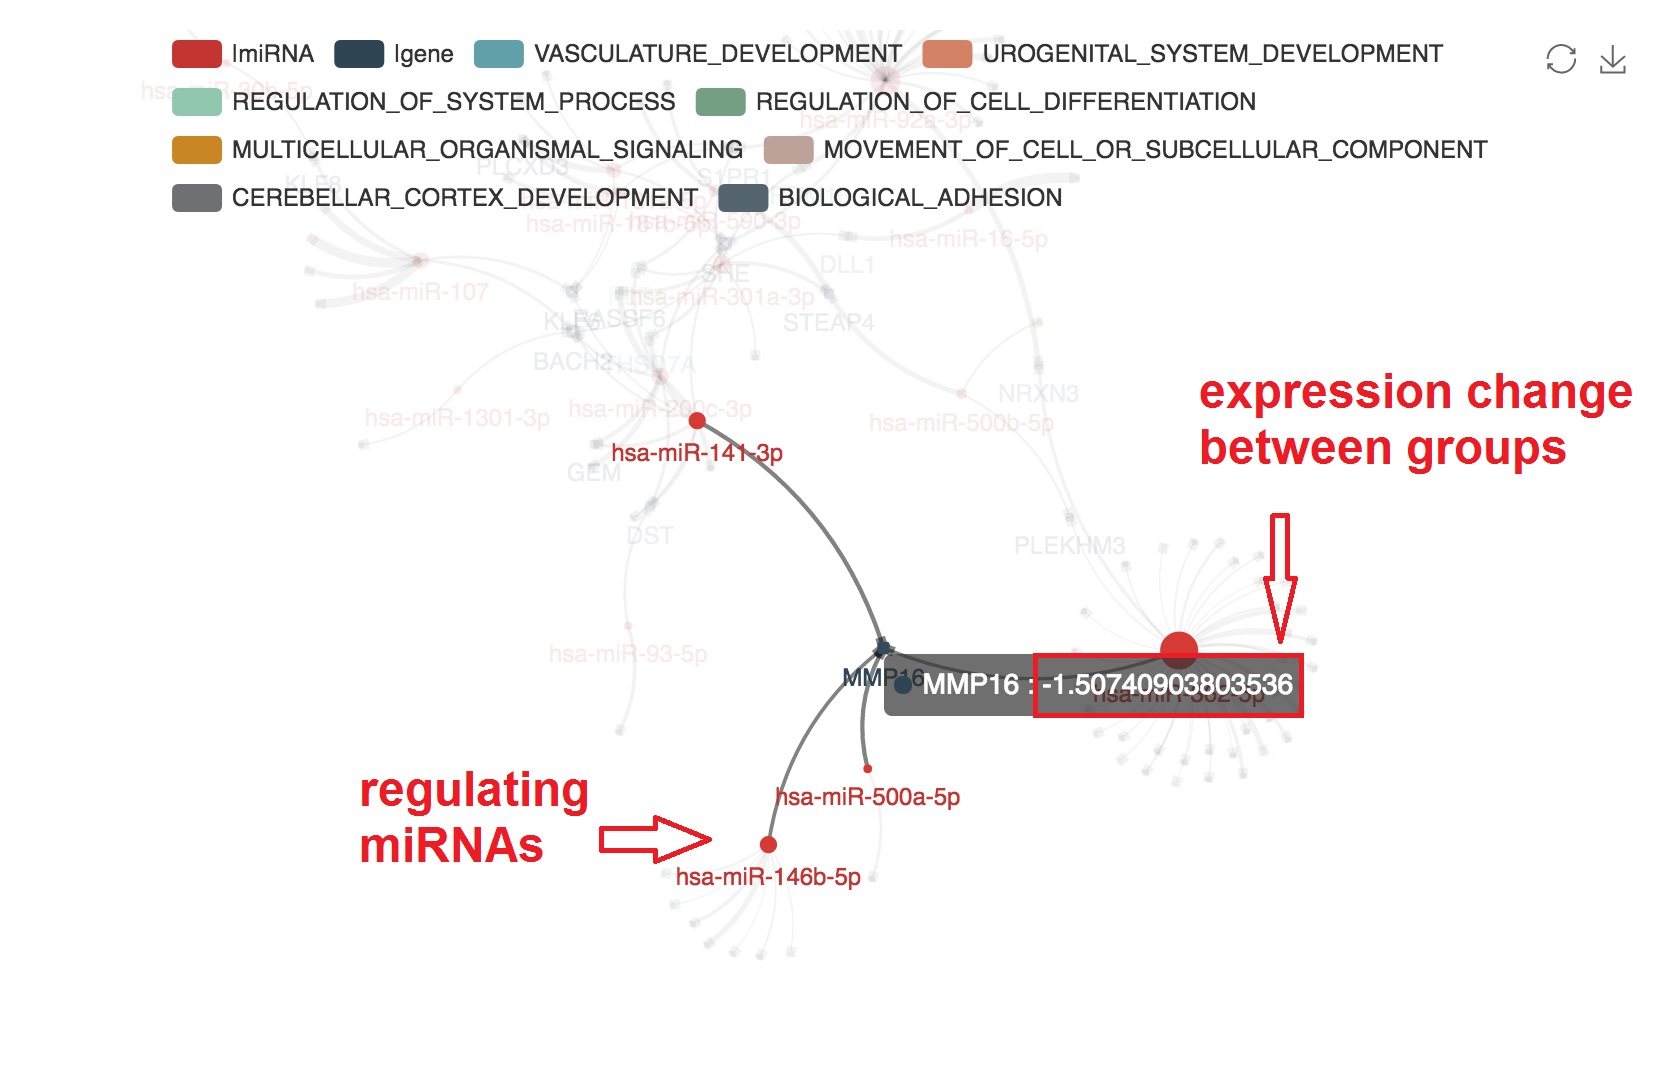
Focus on specified mRNA and show the miRNAs
- We can highlight the regulating miRNAs of target mRNA by "mouseover"
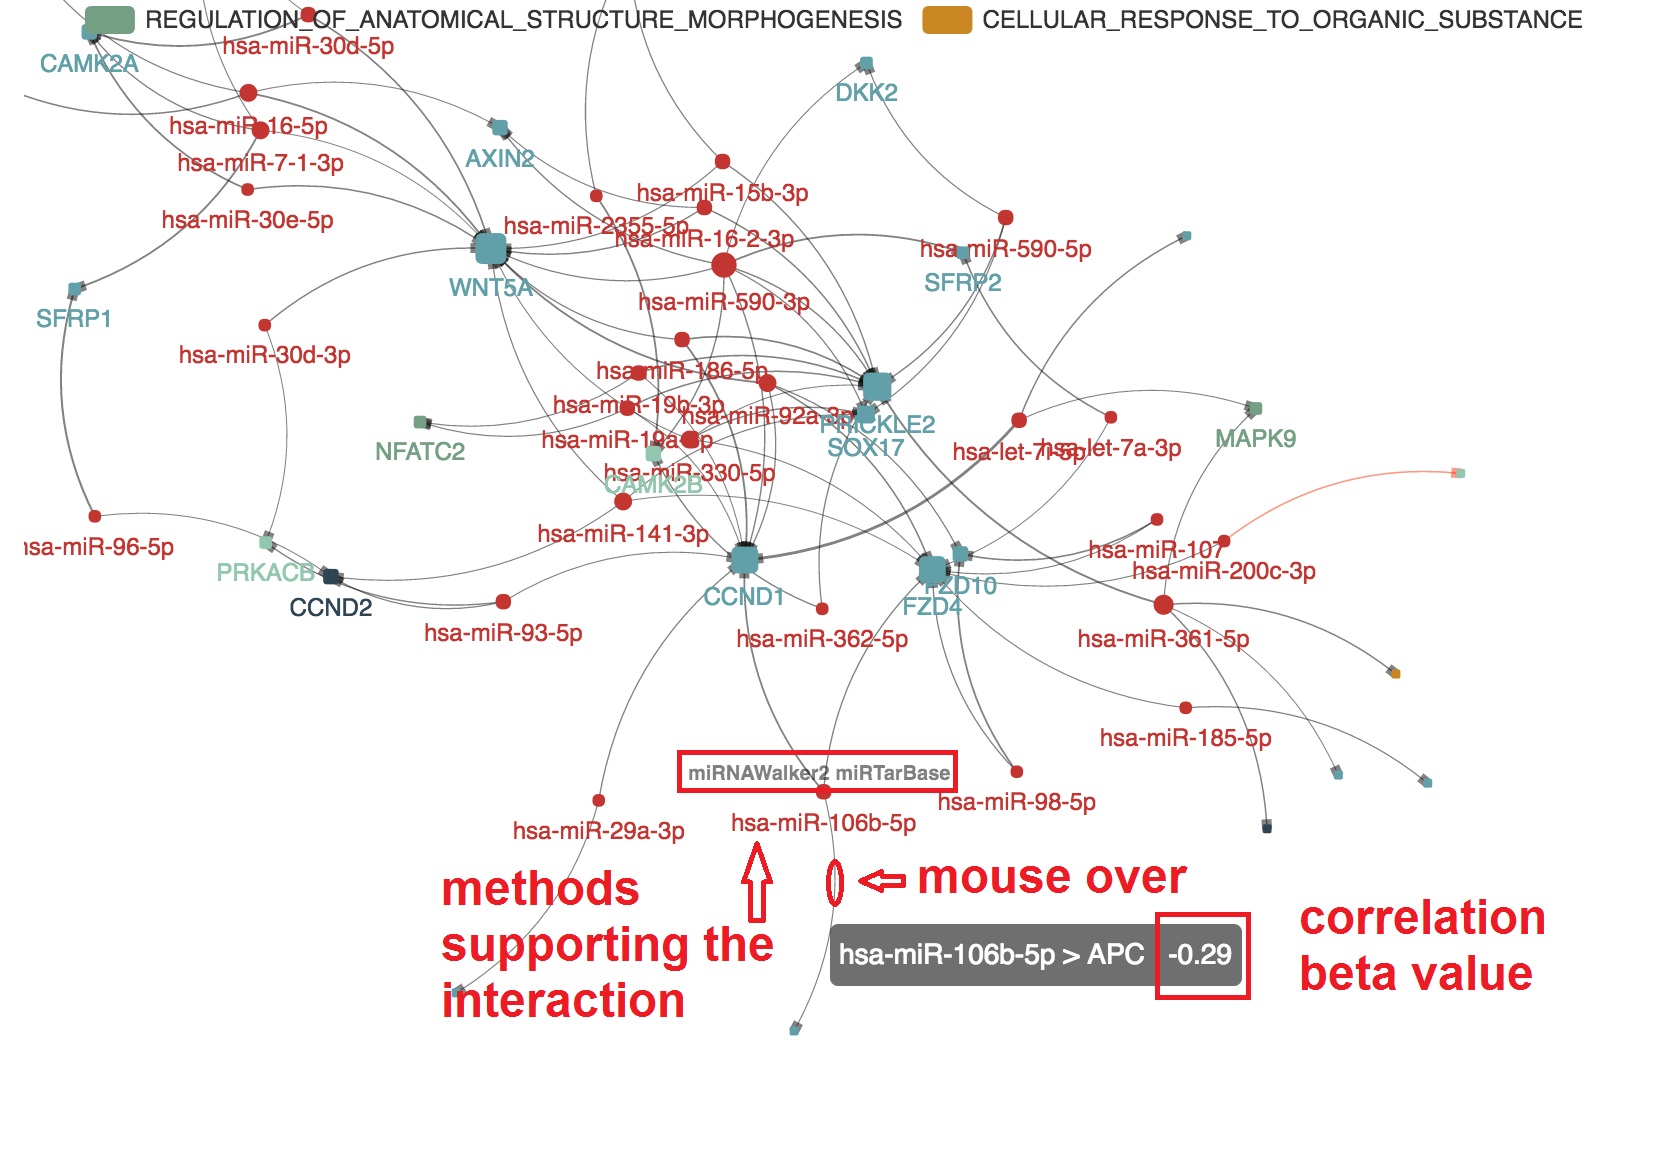
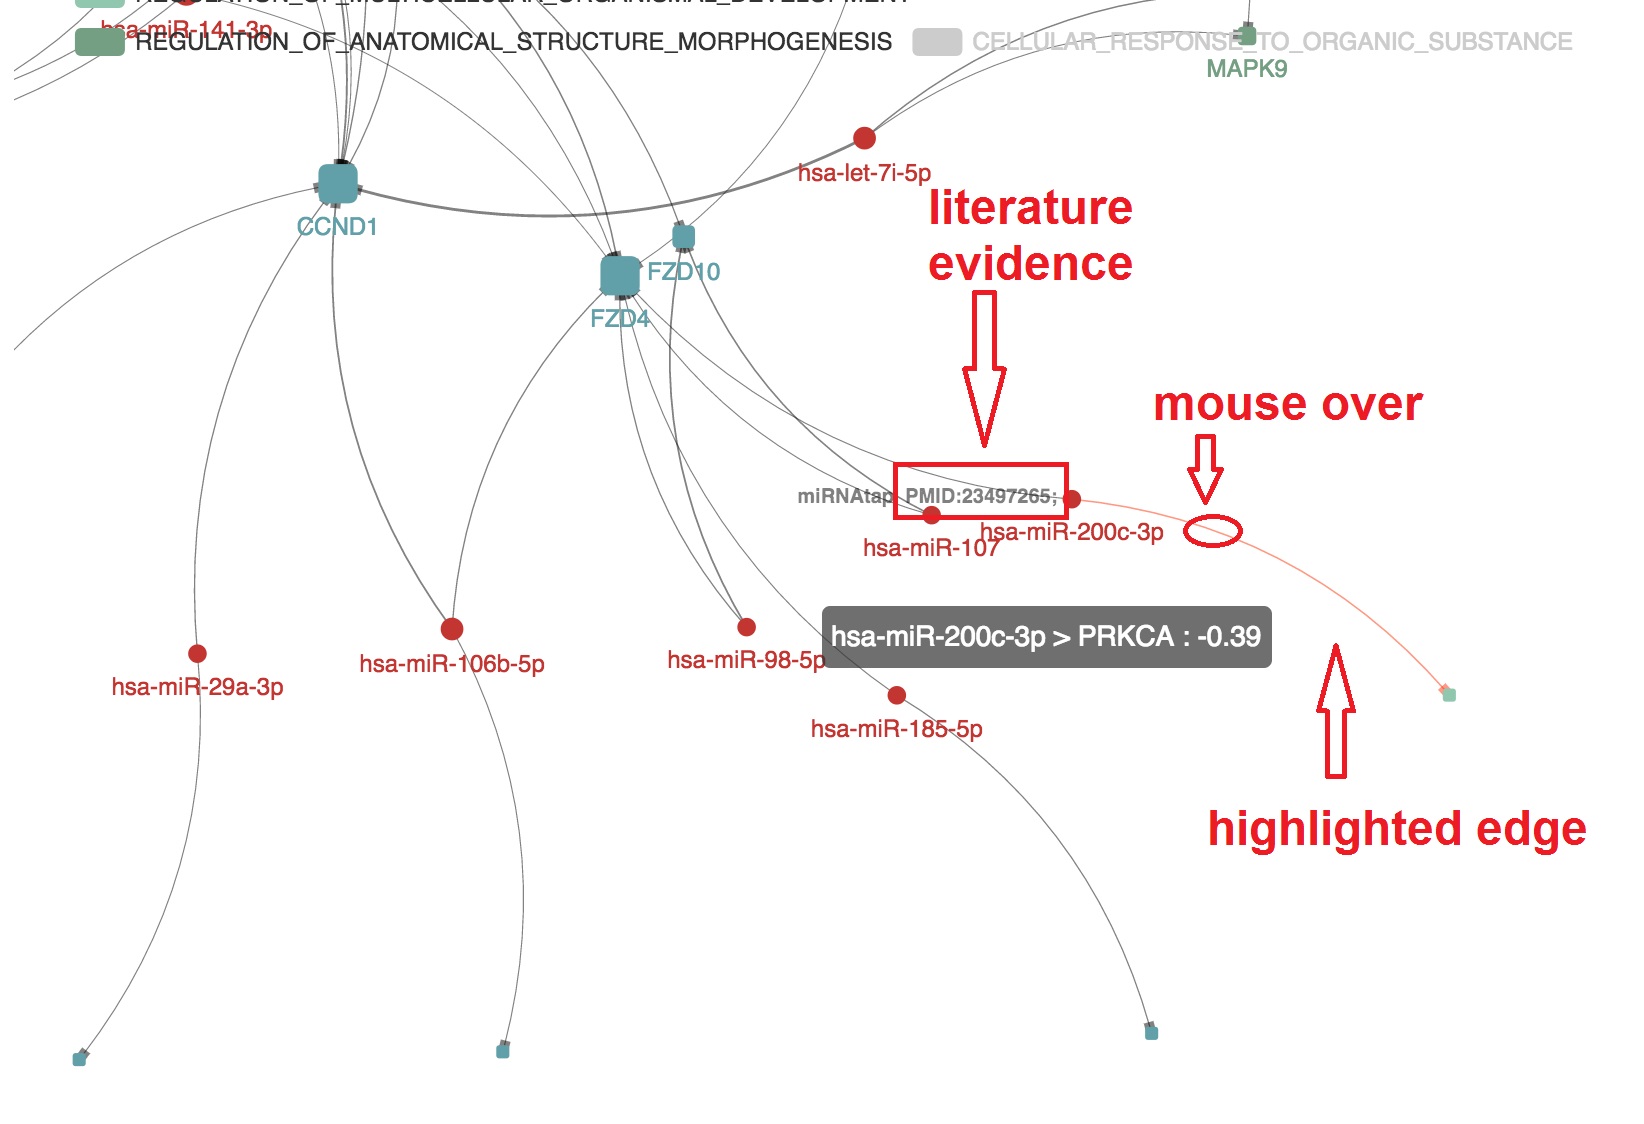
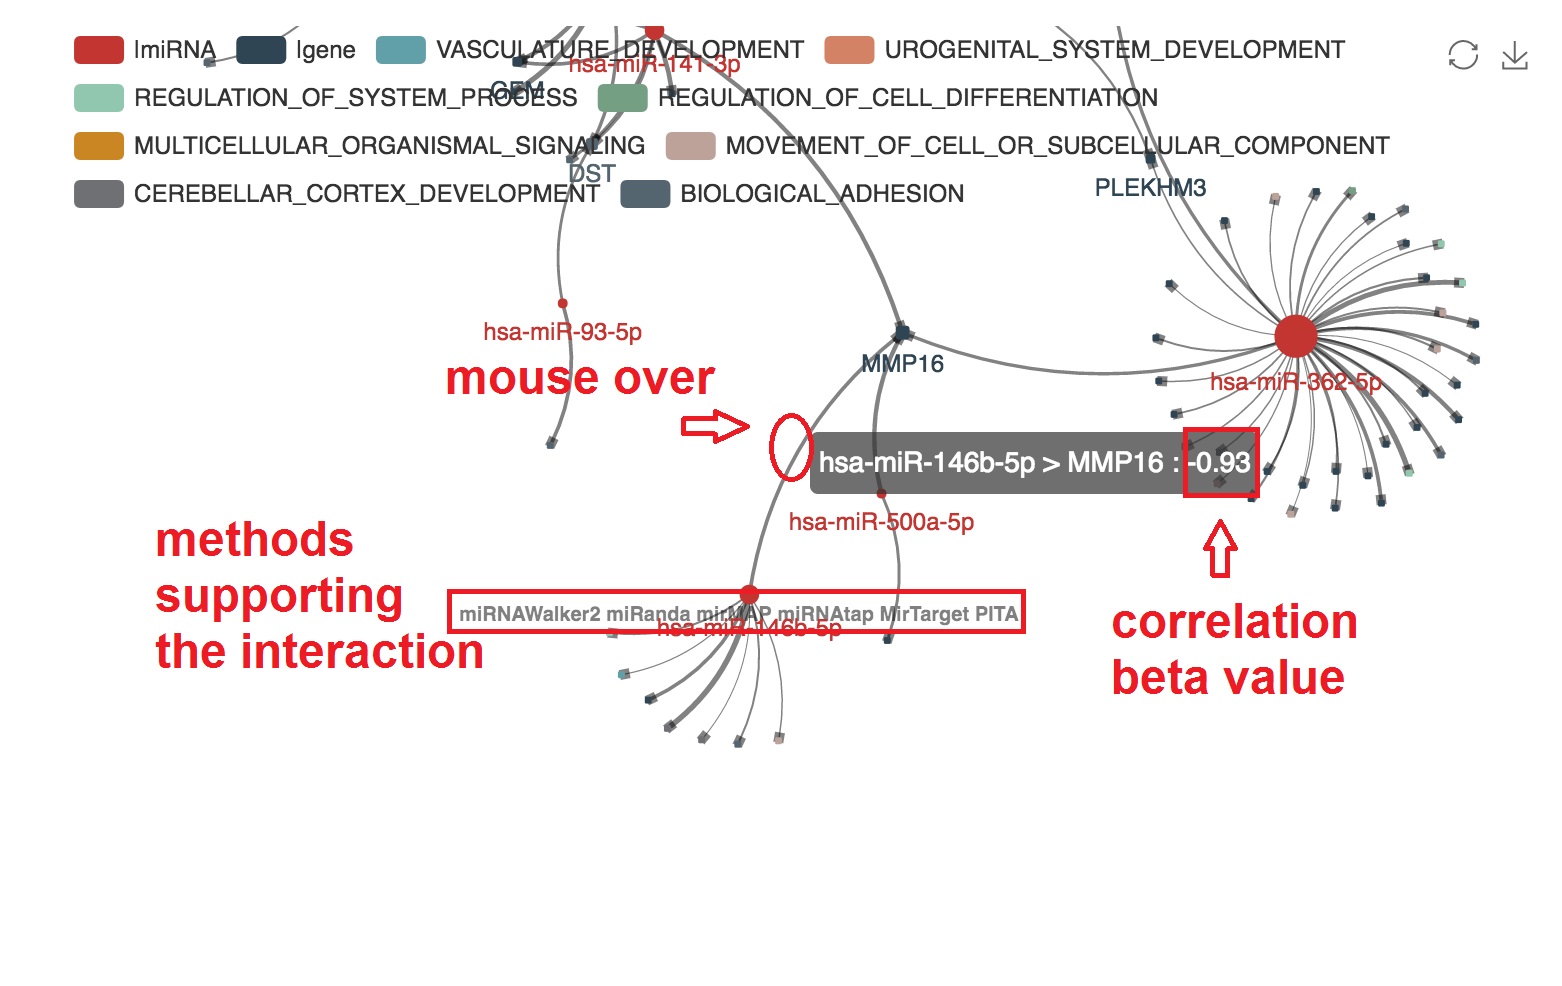
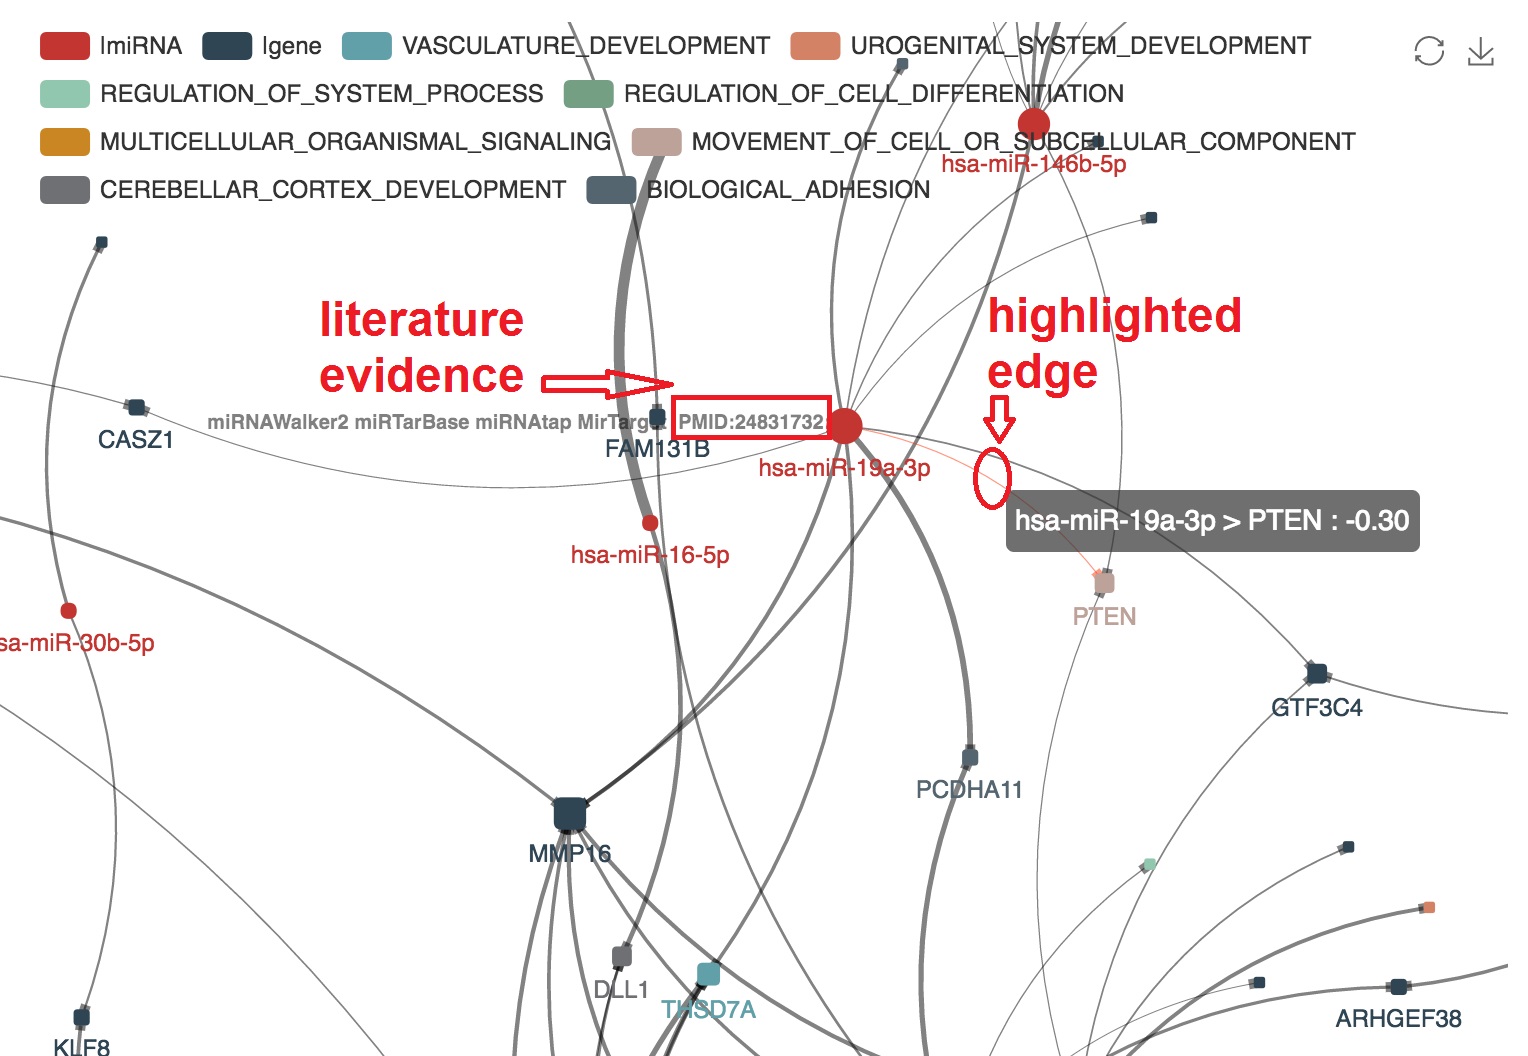
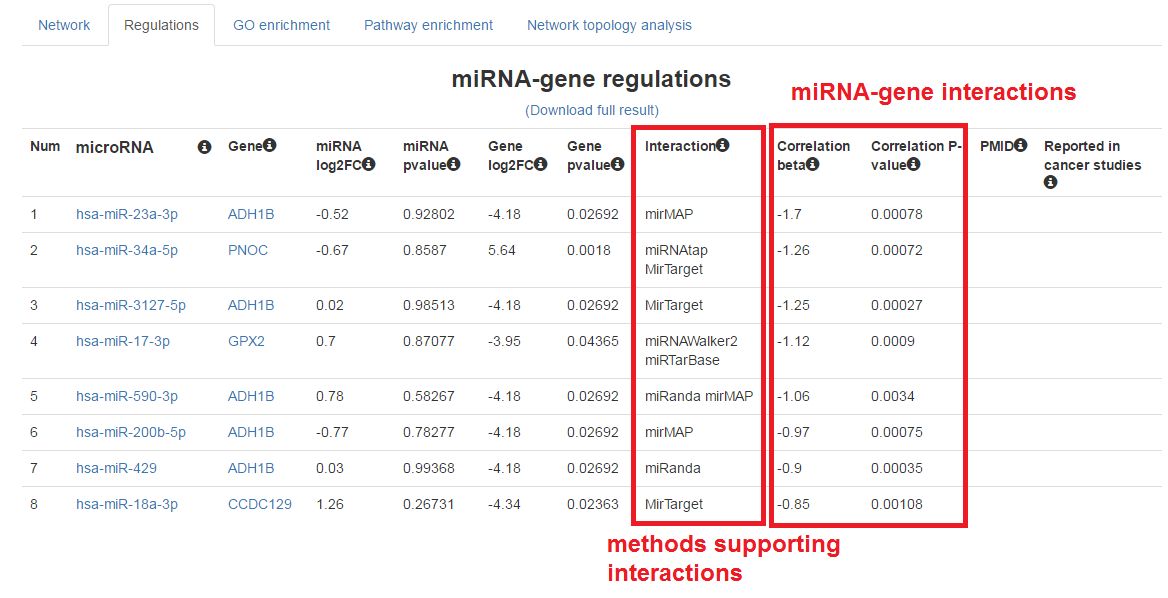
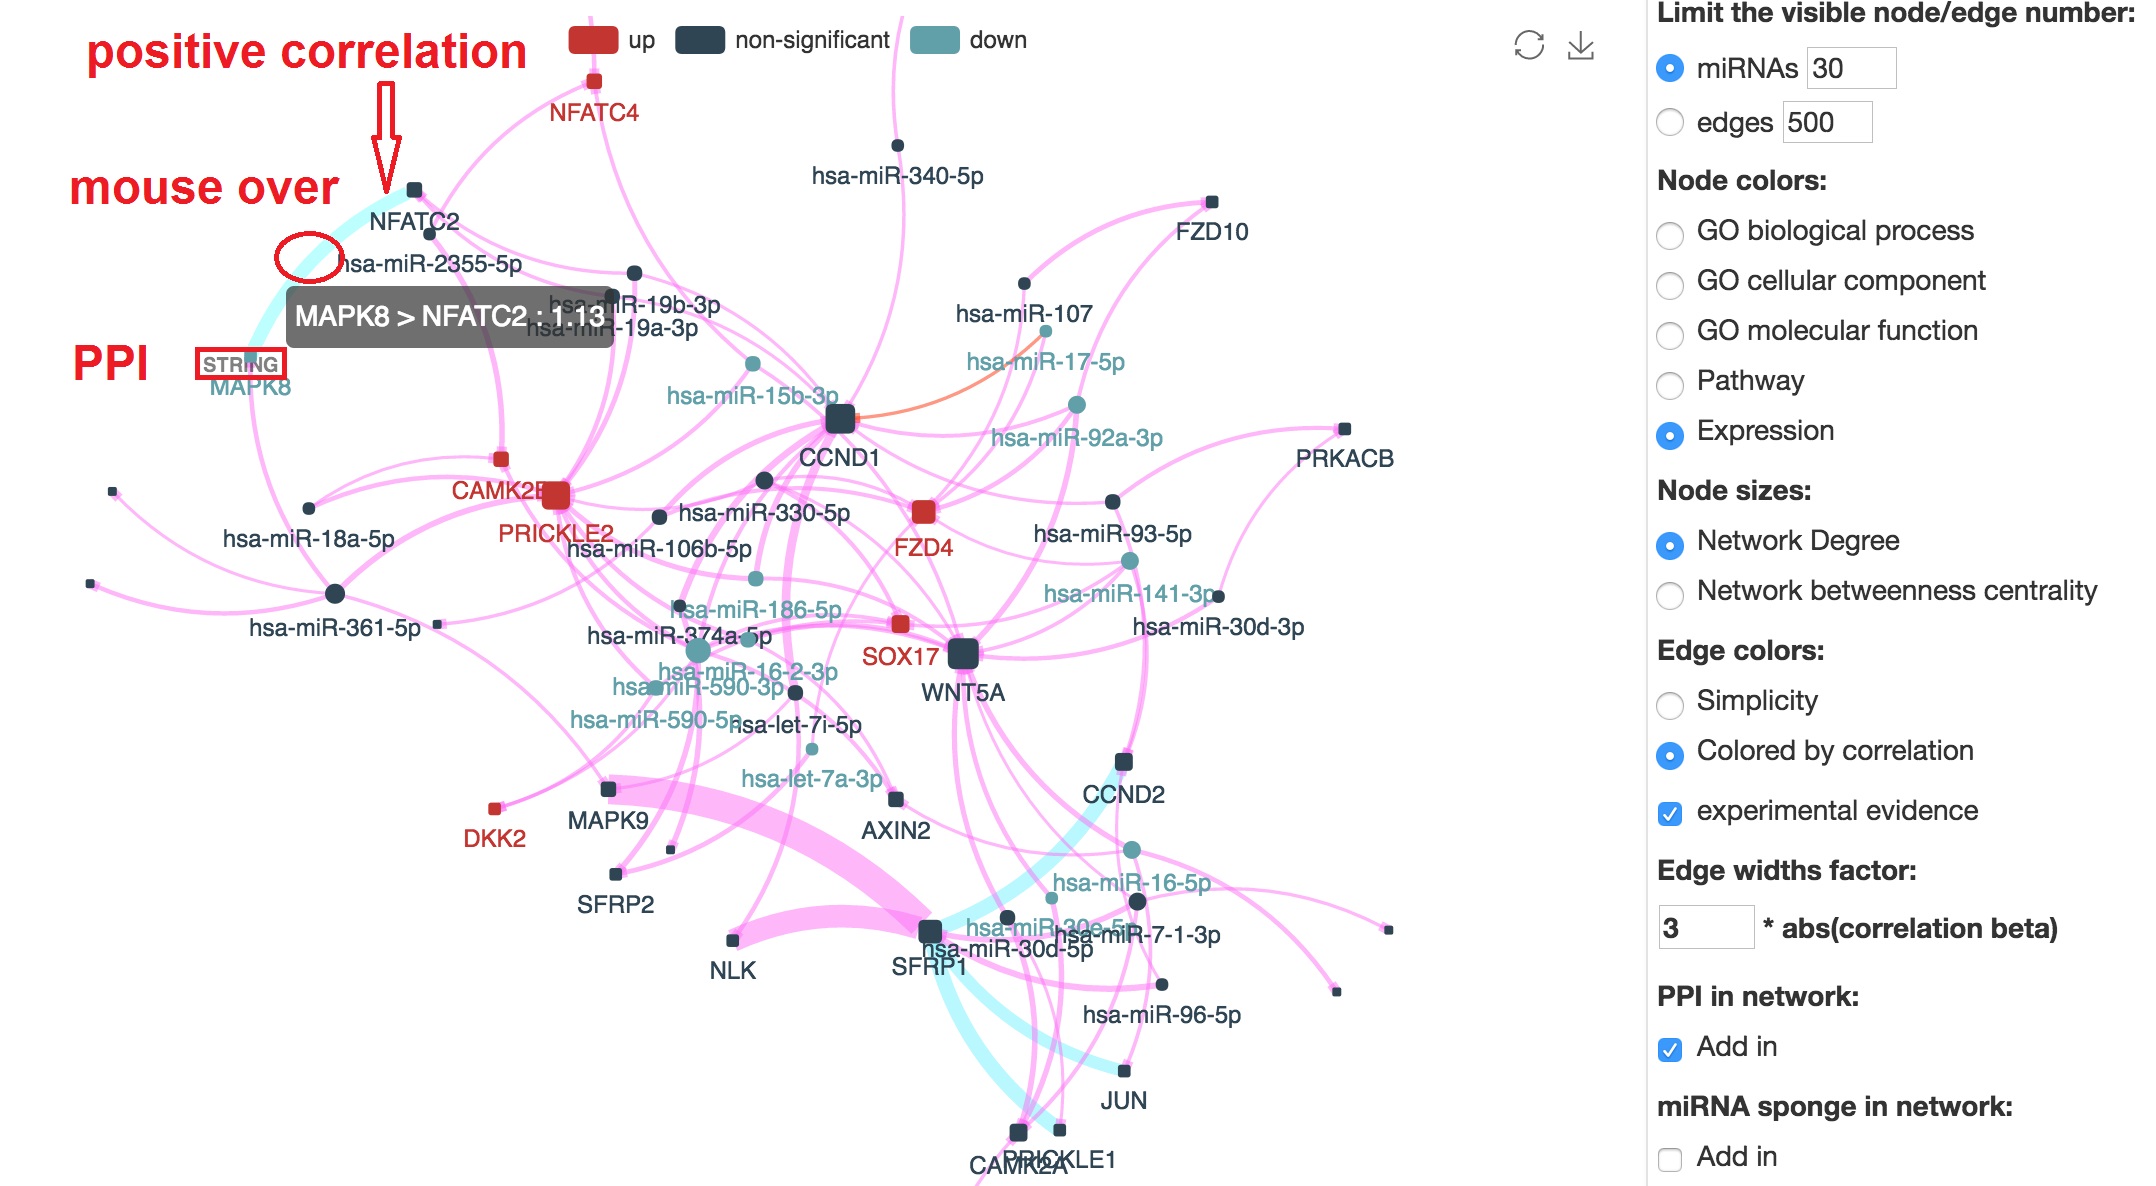
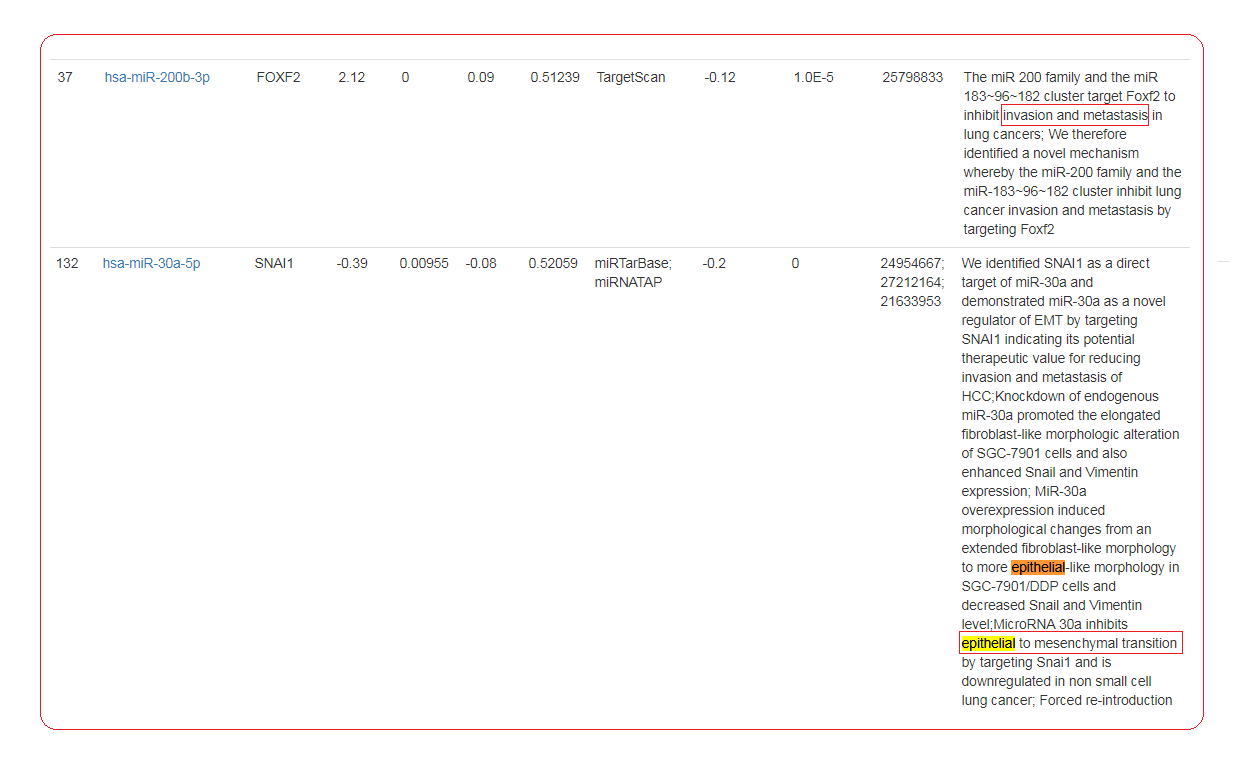
Present the informations that support the edge
- The miRNA-mRNA correlation and binding evidence will be shown beside by "mouseover"
- The PMID of experimental evidence of the miRNA-mRNA regulation in cancer study will be presented. And the corresponding edge will be highlighted by orange color
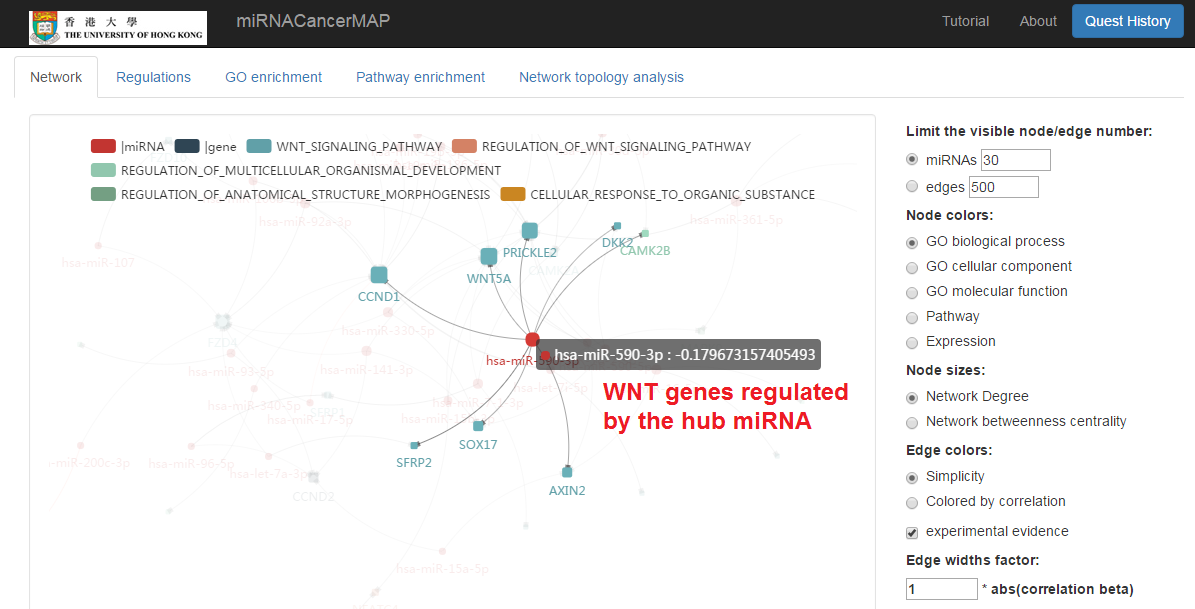
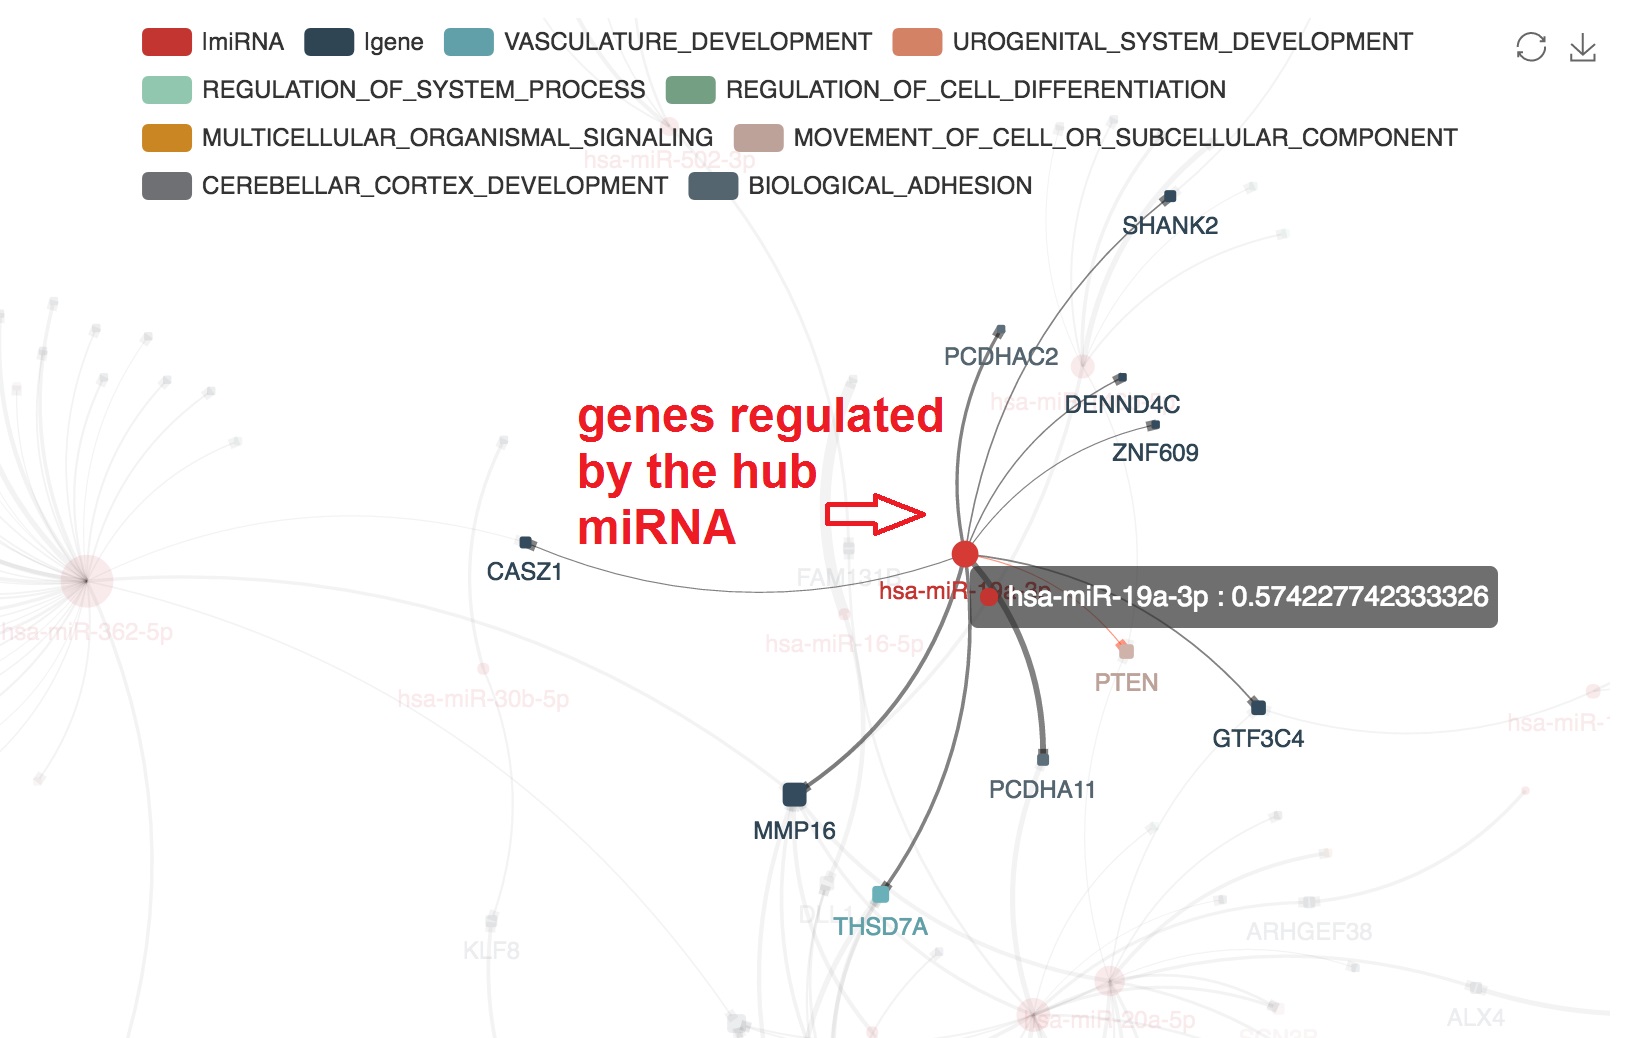
Highlight target mRNAs regulated by the specified miRNA
- We can highlight the target mRNA under regulation of the specified miRNA by "mouseover"
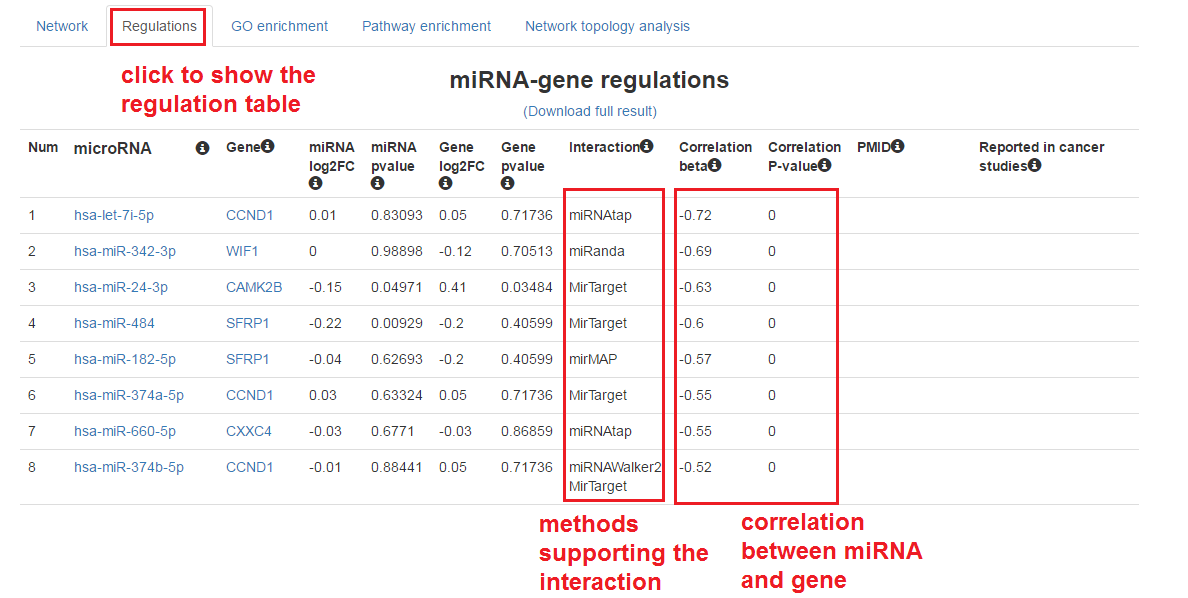
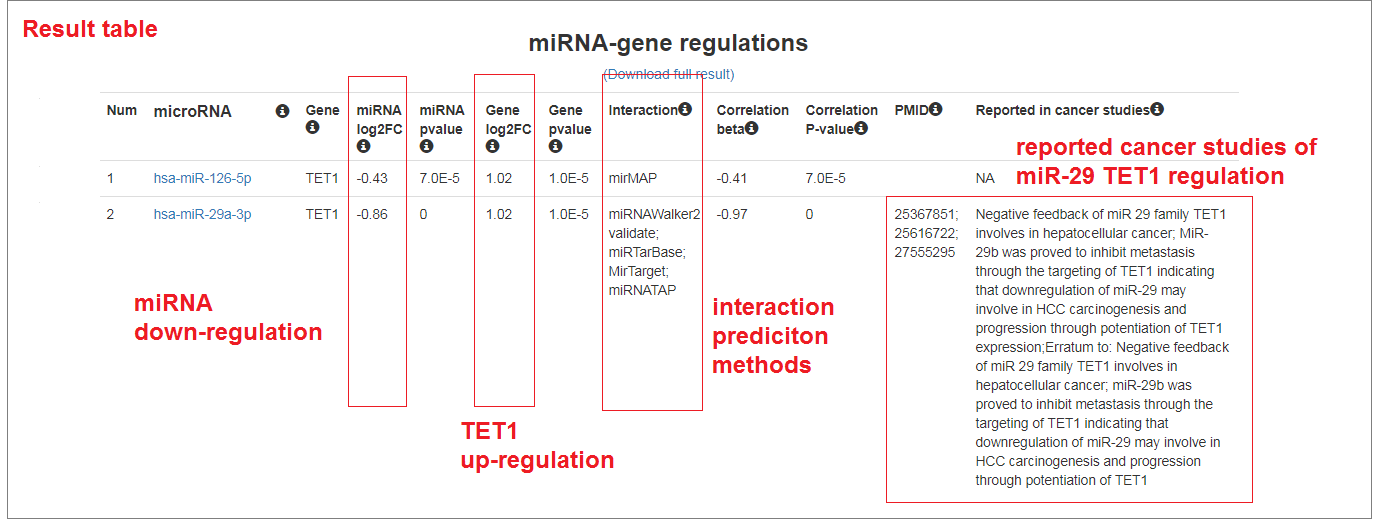
Show the table of miRNA-mRNA regulations
- Click on the "Regulations" tab
- We can also download the full result of this analysis
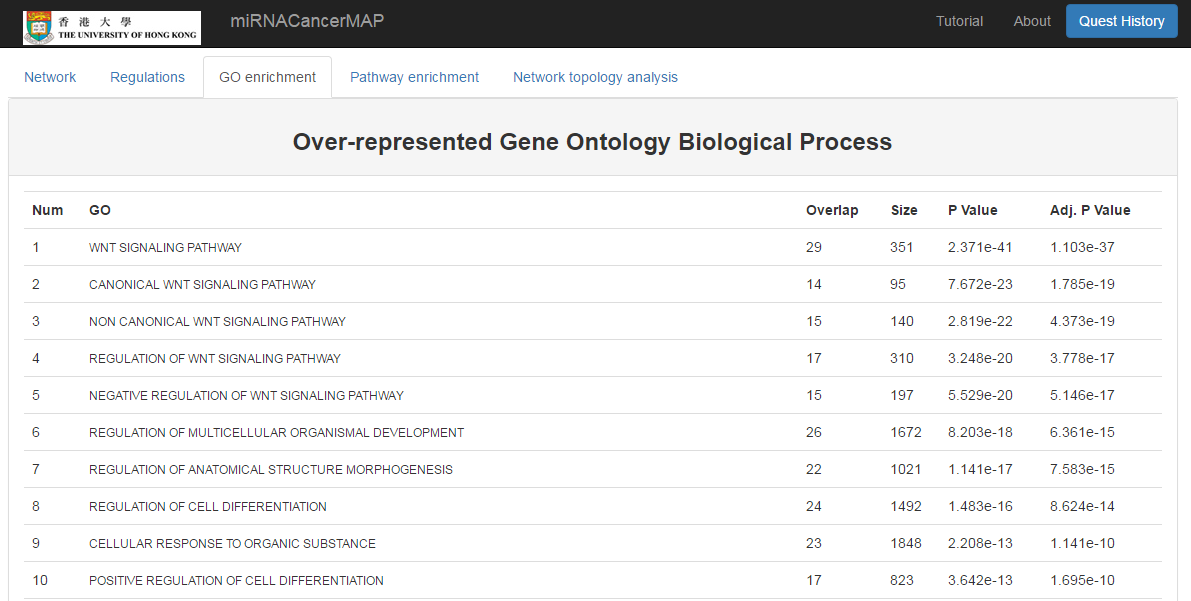
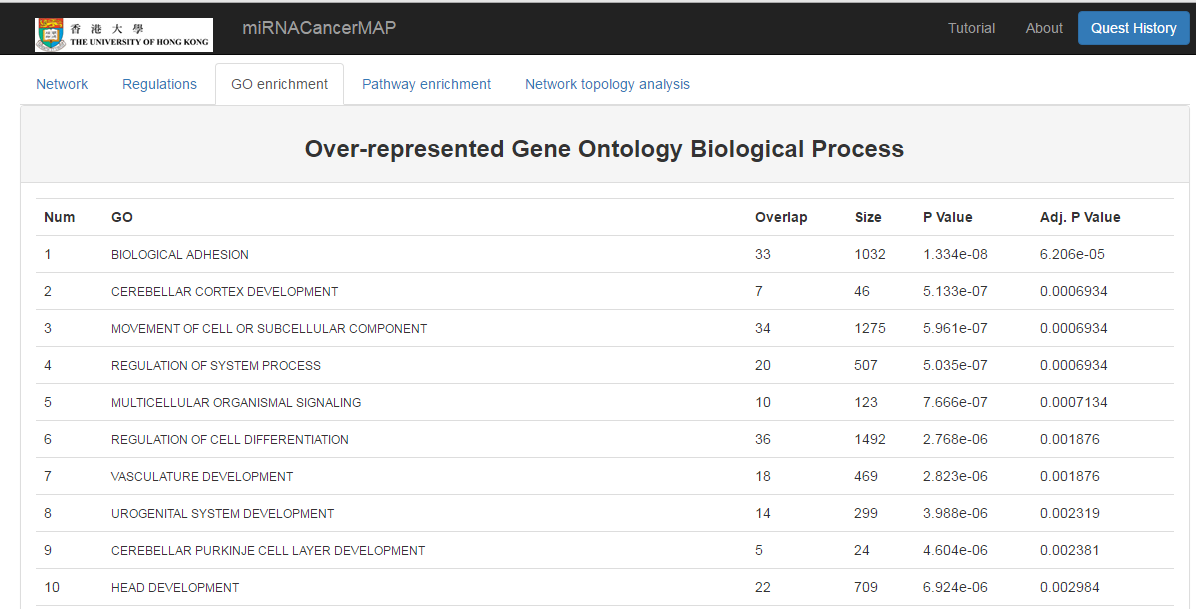
Show the GO enrichment result of mRNAs in the network
- Click on the "GO enrichment" tab
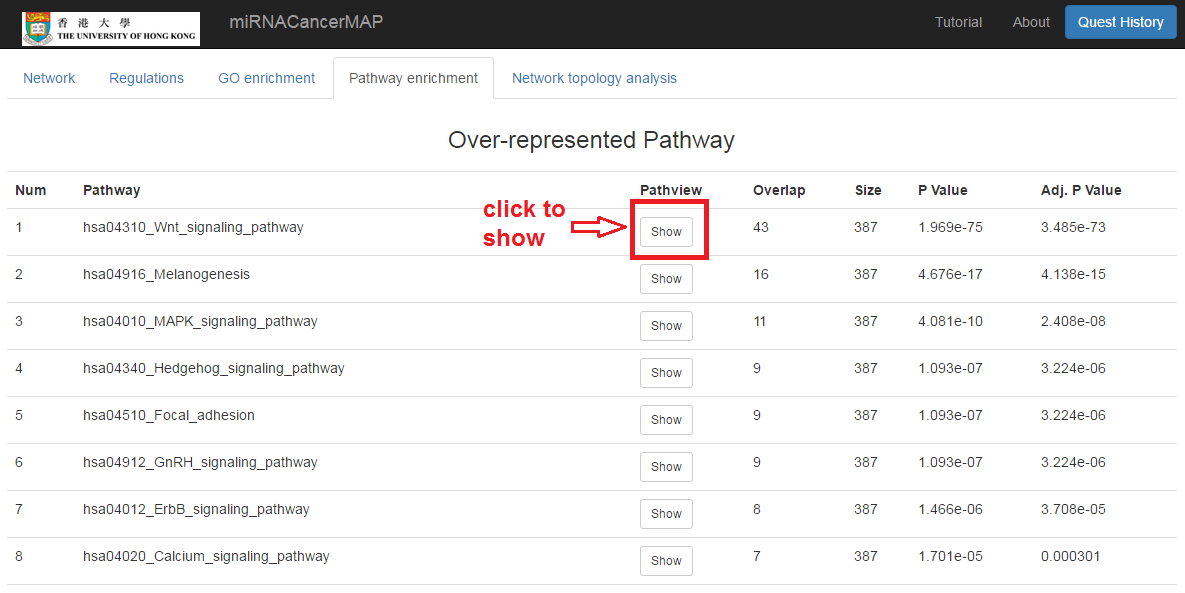
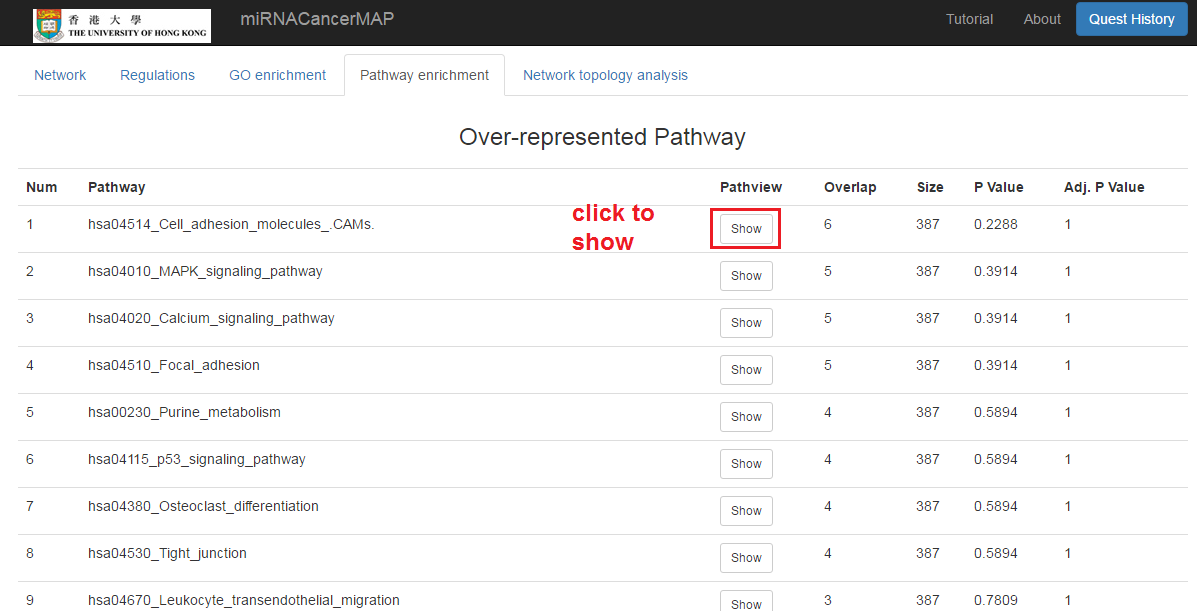
Show the pathway enrichment result of mRNAs in the network
- Click on the "Pathway enrichment" tab
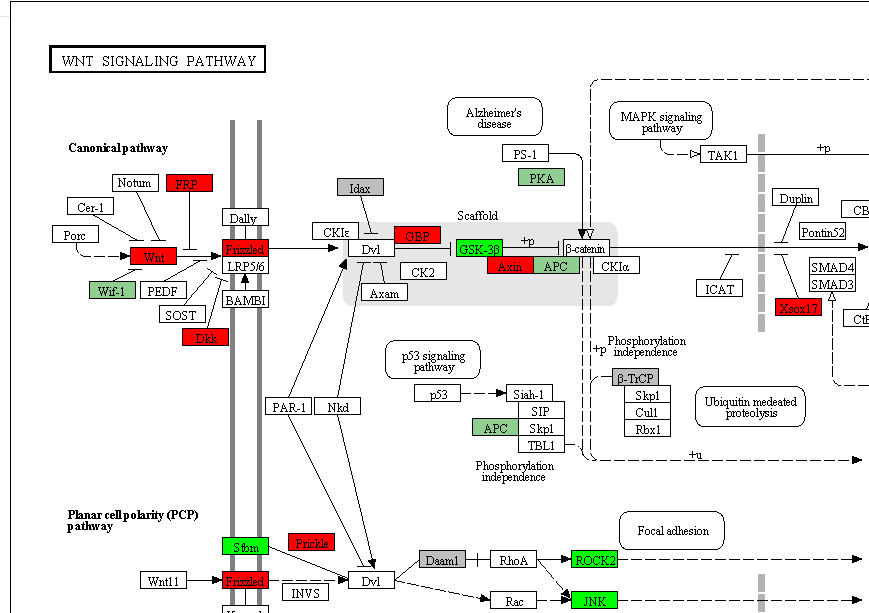
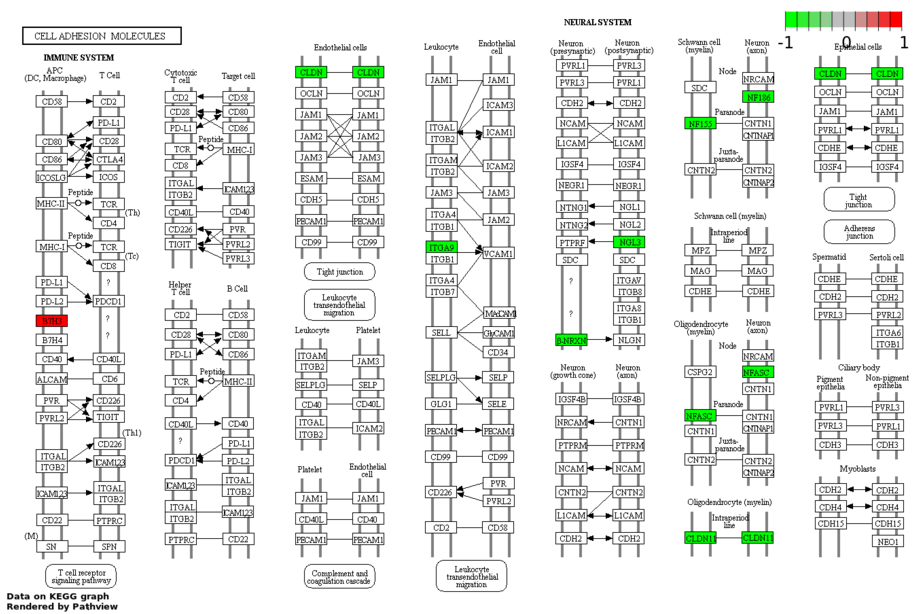
- Click to show the pathway regulation. This figure is plotted by R "Pathview" package. Up/down-regulation of mRNA expression is between the high stage tumors (stage iii&iv) and low stage of tumors(stage i&ii)
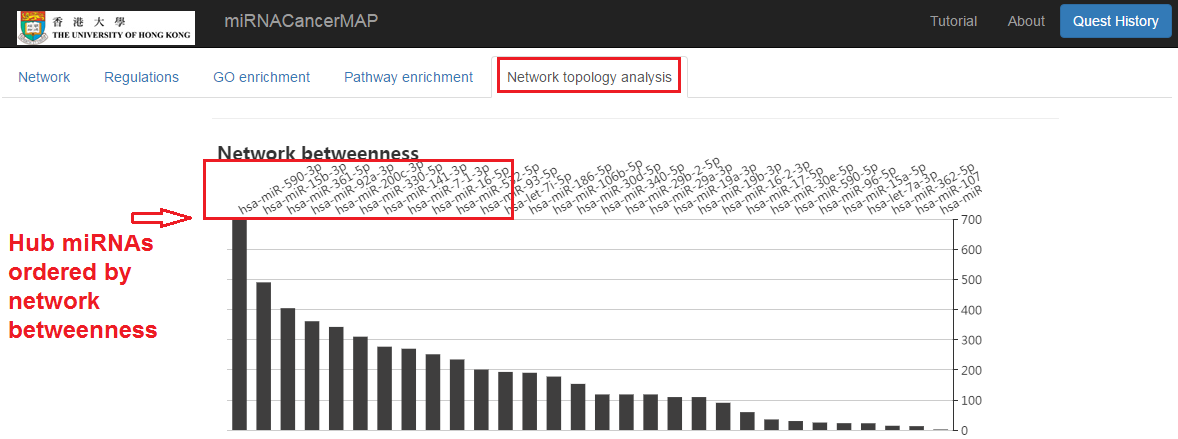
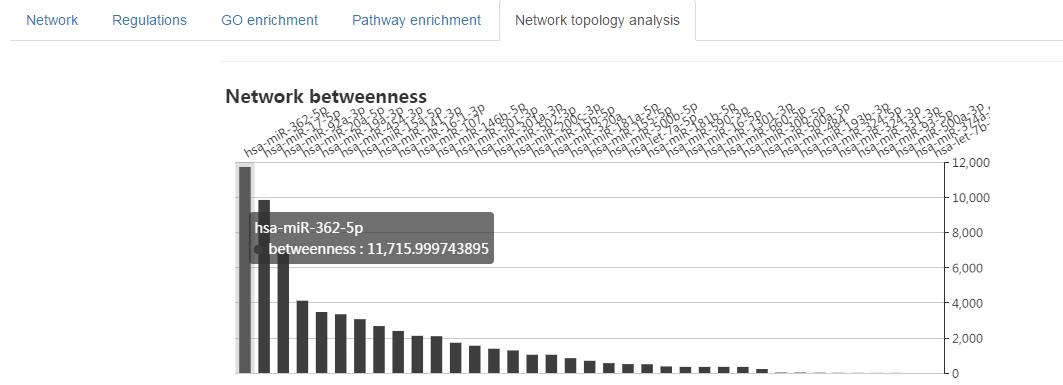
Hub miRNA identified by network topology analysis
- Click on the "Network topology analysis" tab
- The hub miRNAs (with the high network betweenness) would be the underlying cancer drivers or tumor suppressors
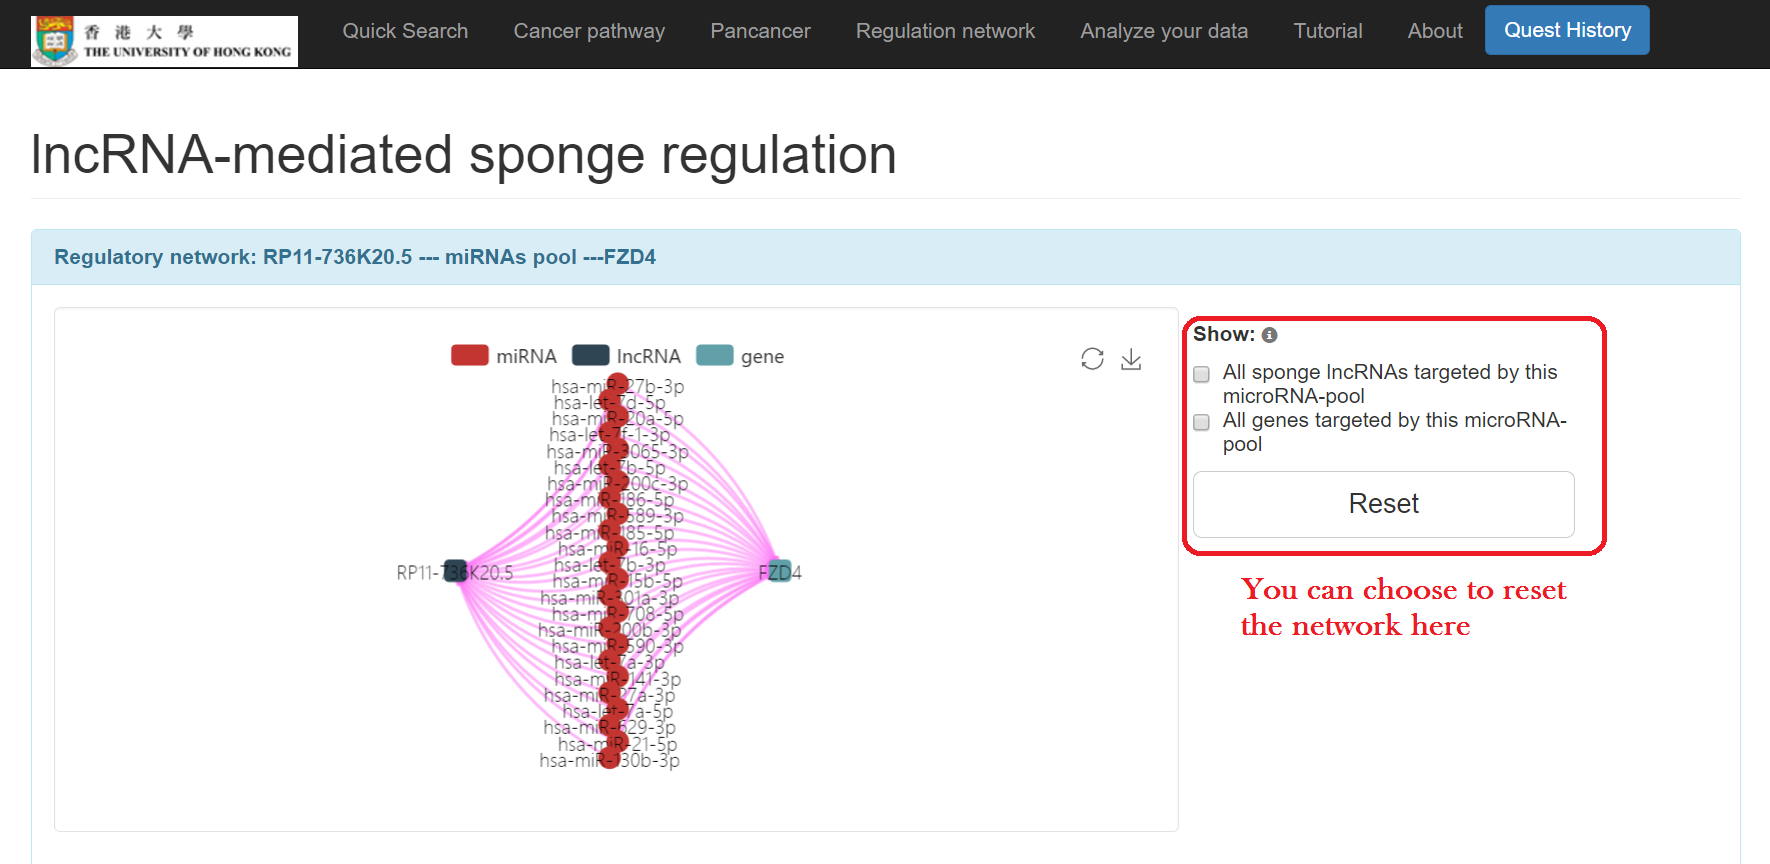
Learning lncRNA mediated sponge regulation
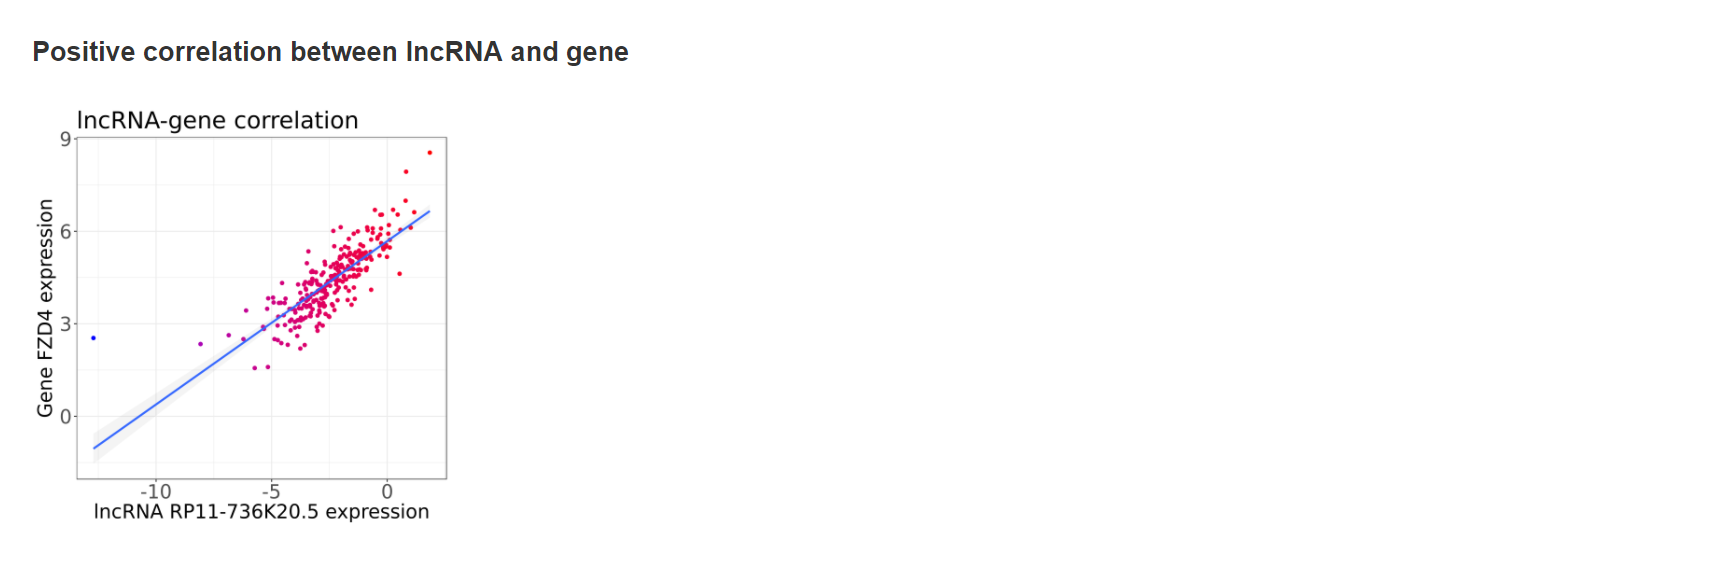
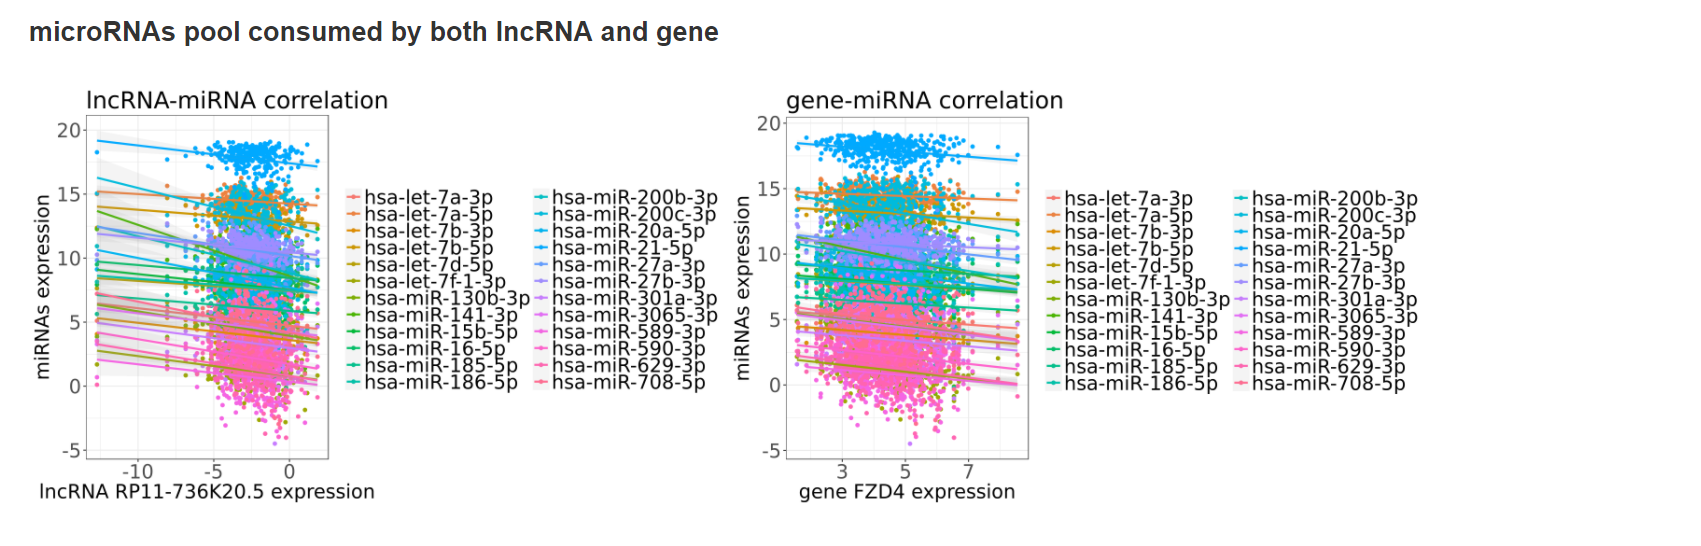
Putative lncRNA sponges can be identified by the positive correlated lncRNA-mRNA pairs commonly regulated by the same set of miRNAs (>10 miRNAs). All these findings will be combined and jointly presented in the interactive regulatory network. We identified miRNA-lncRNA and miRNA-mRNA regulation pairs based on evidences from both sequence-based interactions and anti-correlations of expression. For each mRNA, we examine every single lncRNA to search for the common miRNAs that regulate their expression simultaneously. The list of miRNAs shared by the lncRNA-mRNA pairs were generated and counted, as well as the Pearson correlation coefficient between the lncRNA-mRNA pair in expression data. The lncRNA-mRNA pairs with putative sponge regulation were selected by two criteria, including 1. larger than 0.25 for the Pearson correlation coefficient between lncRNA and mRNA pair (user can decide the significance level by set the P-value cutoff), and 2. at least ten different miRNAs shared in the pair. In the result page, the shared miRNA set of lncRNA and gene will be presented, along with the positive correlation between lncRNA and gene and the negative correlation between miRNA sets and their targets.
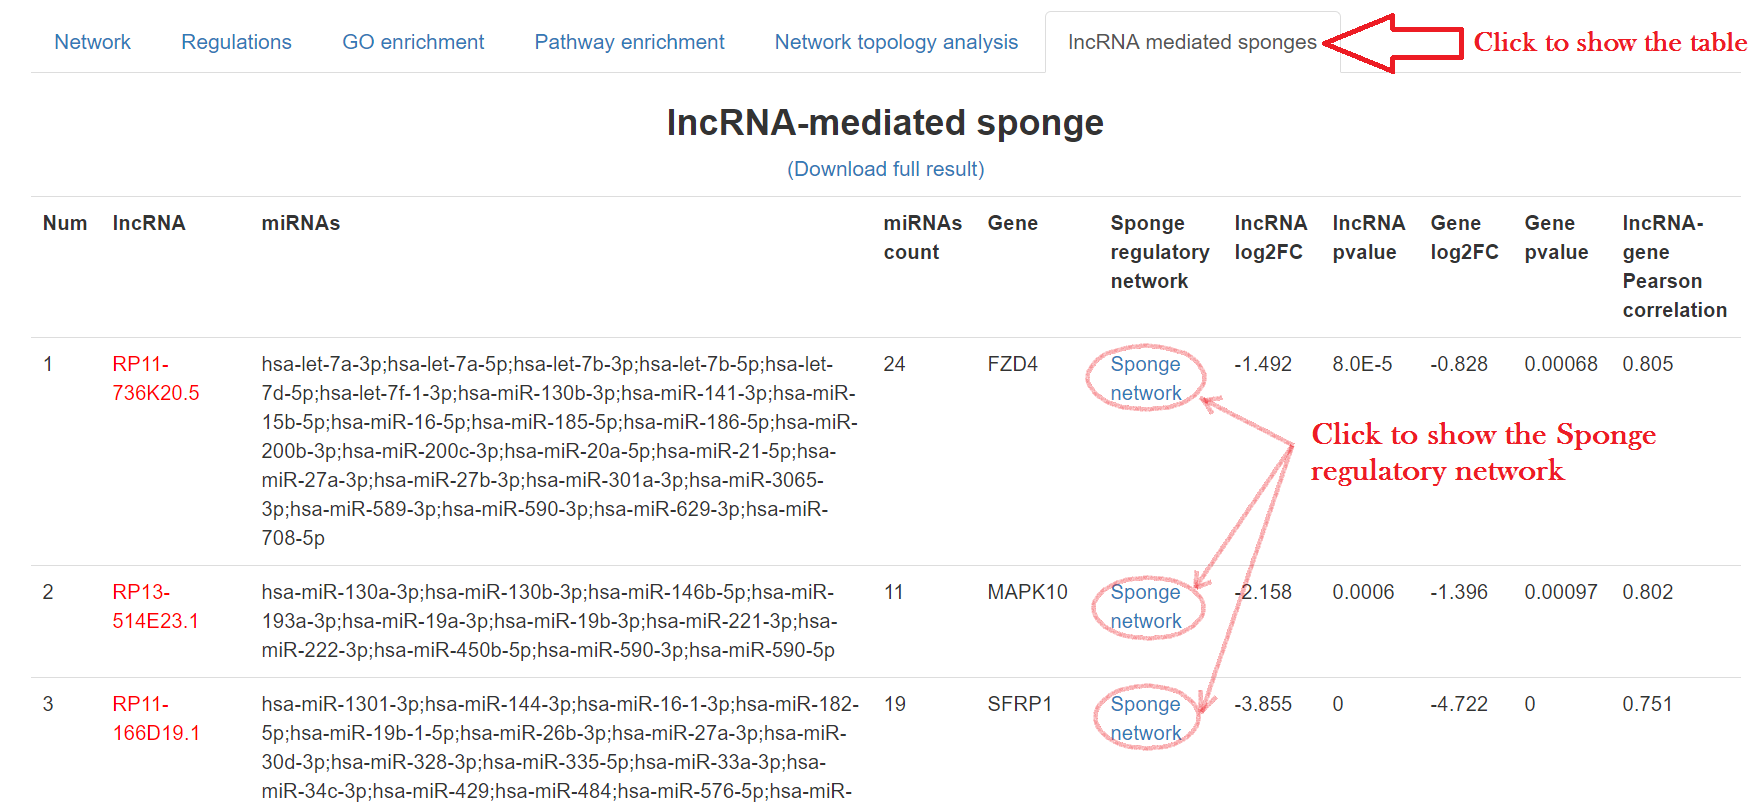
- Click on the "lncRNA mediated sponges" tab
- Click "Sponge network" to show detailed regulation information, including:
- lncRNA-miRNAs pool-gene regulatory network
- Positive correlation between lncRNA and gene
- microRNAs pool consumed by both lncRNA and gene
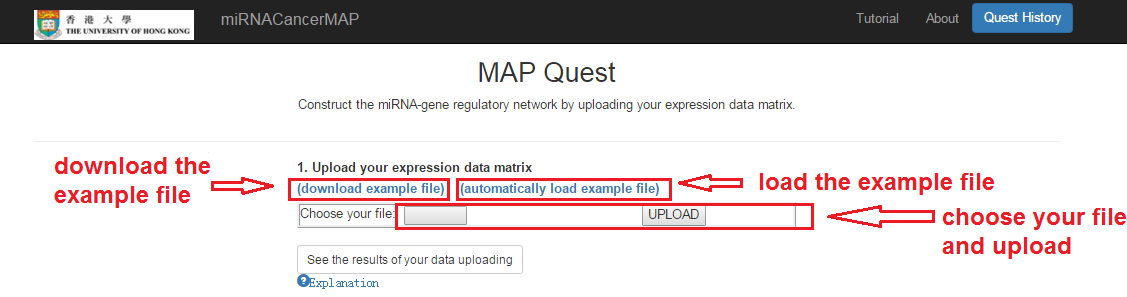
You can upload your miRNA-mRNA expression matrix here and run the analysis. This data will be used in learning the correlations between miRNAs and mRNAs and constructing the regulatory network. In default settings, all of your differentially expressed mRNAs and miRNAs will be analyzed. You can also input your own mRNA and miRNA list in the advanced options. Please download the example file to see the file format.
Click "Analyze your data"

Upload your file
- Choose your file and upload. The data matrix should follow the matrix format description in the "Explanation"
- You can download the example file for testing (right click and save the file)
- You can also click and load the example file automatically for a quick test
- It will take minutes to verify the file format before starting to work on the data
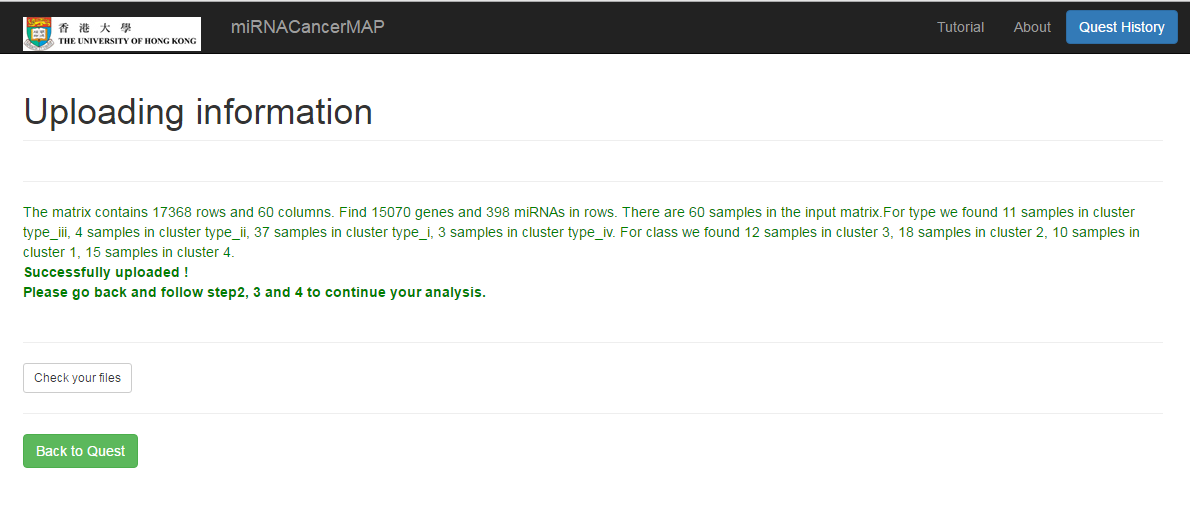
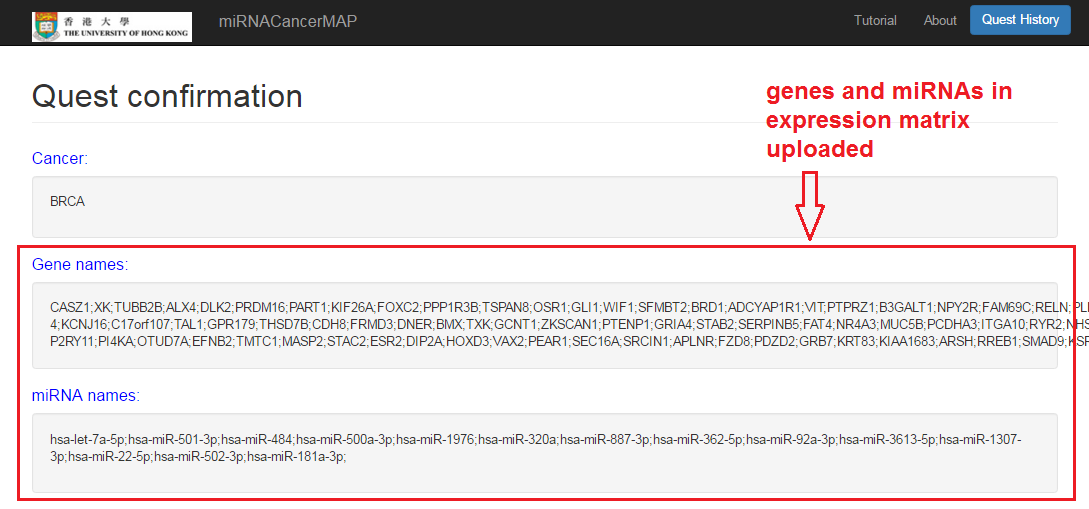
See the matrix information
- Wait for minutes and see the sample number, the mRNA number and miRNA number in your uploading matrix
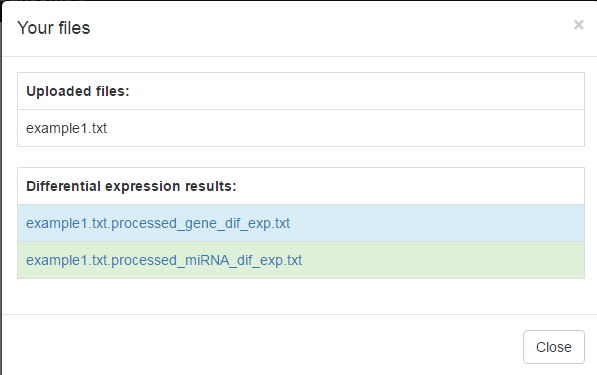
- Click on the "See the results of your data uploading" button, and check the name of your uploading file, as well as the differential expression result
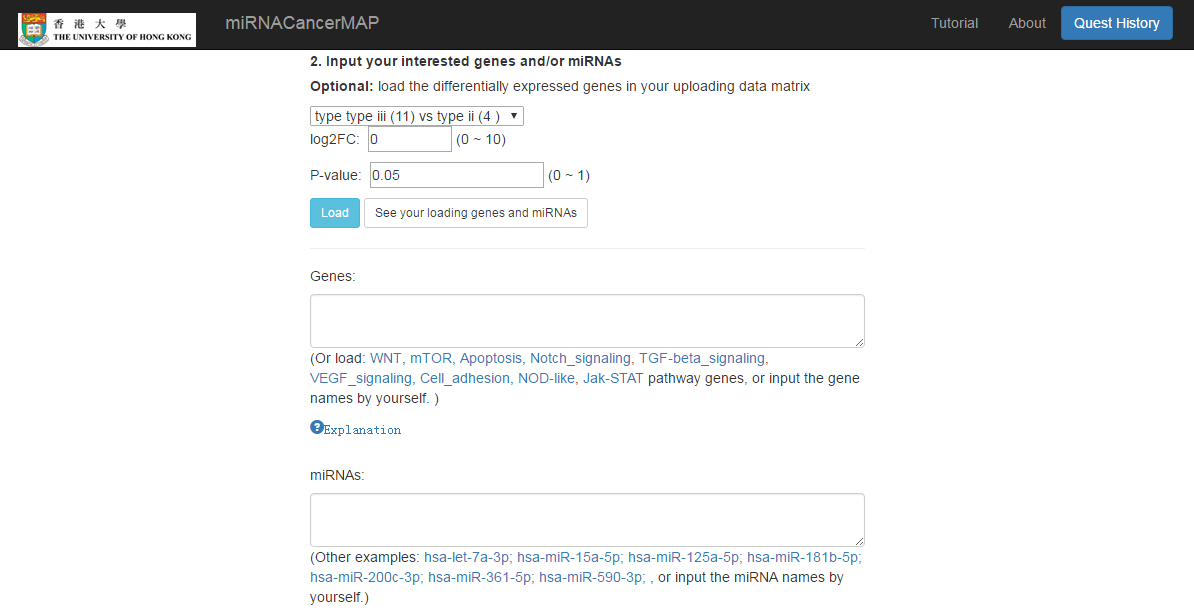
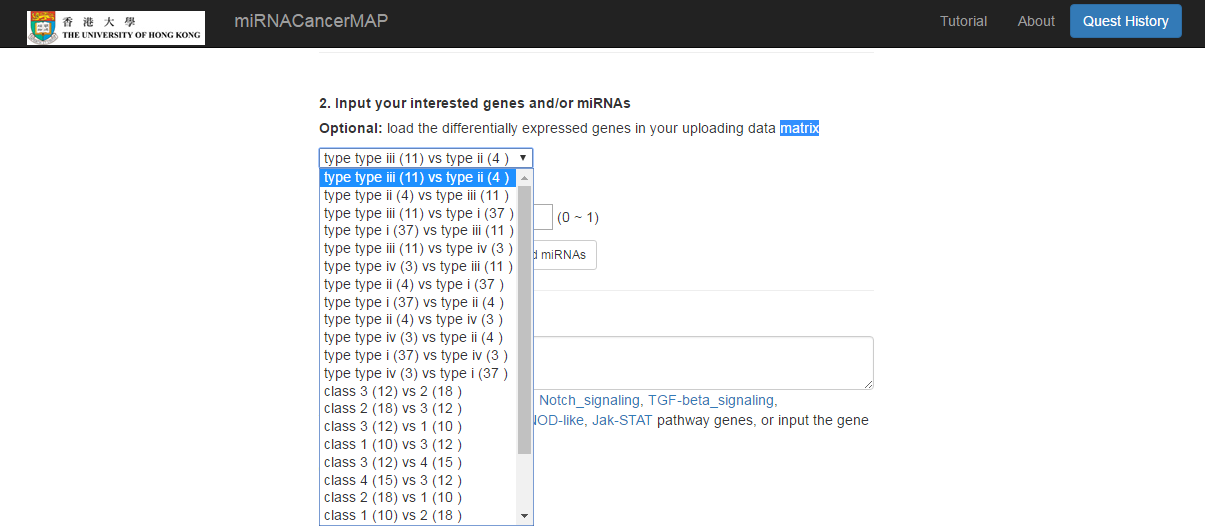
Input the gene and/or miRNA list
- Load the differential expressed gene/miRNA between different classification of samples (test/control, tumor subtypes)
- Or input the gene/miRNA list by yourself
Submit your quest
- Select the methods to learn the interactions
- Select the cancer name to annotate the experimental evidences
- Click and submit the quest. By default, the analysis will running on all the differential expressed mRNAs and miRNAs.
Check your quest details
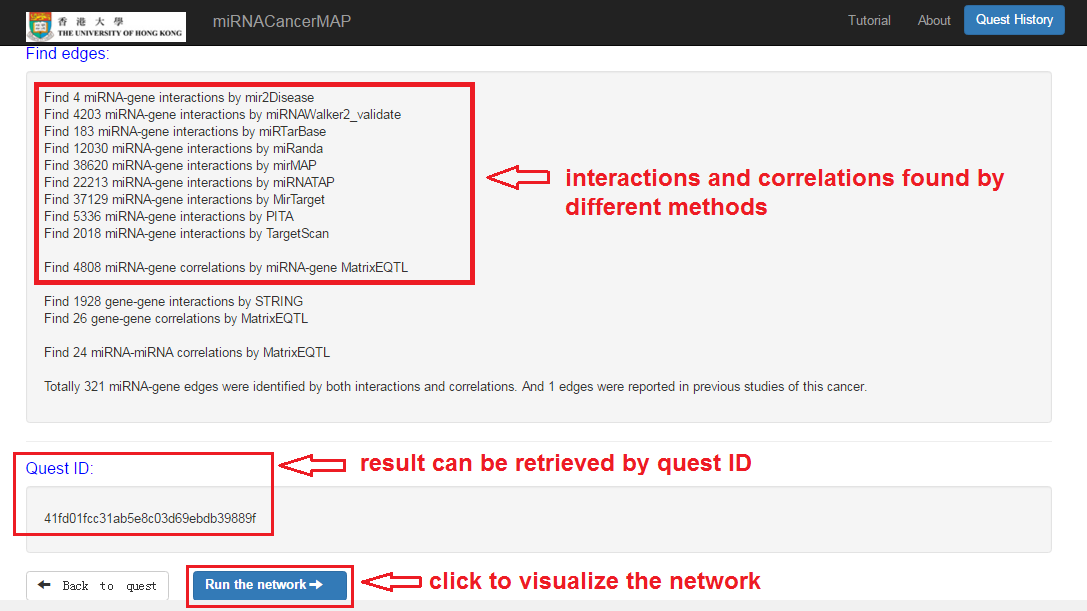
Check your quest results
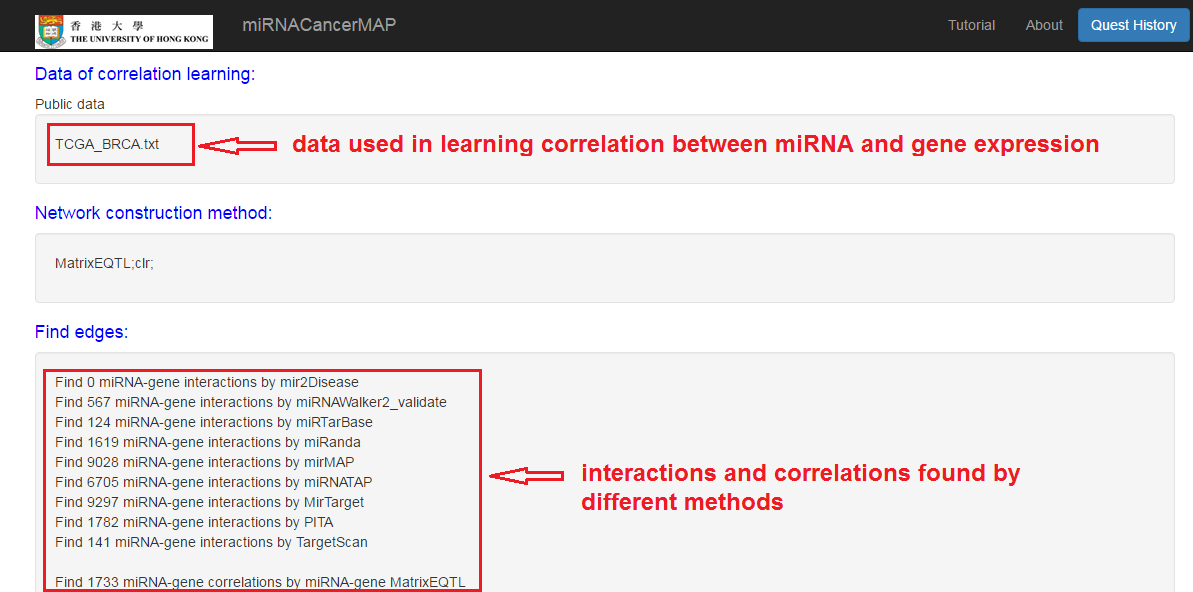
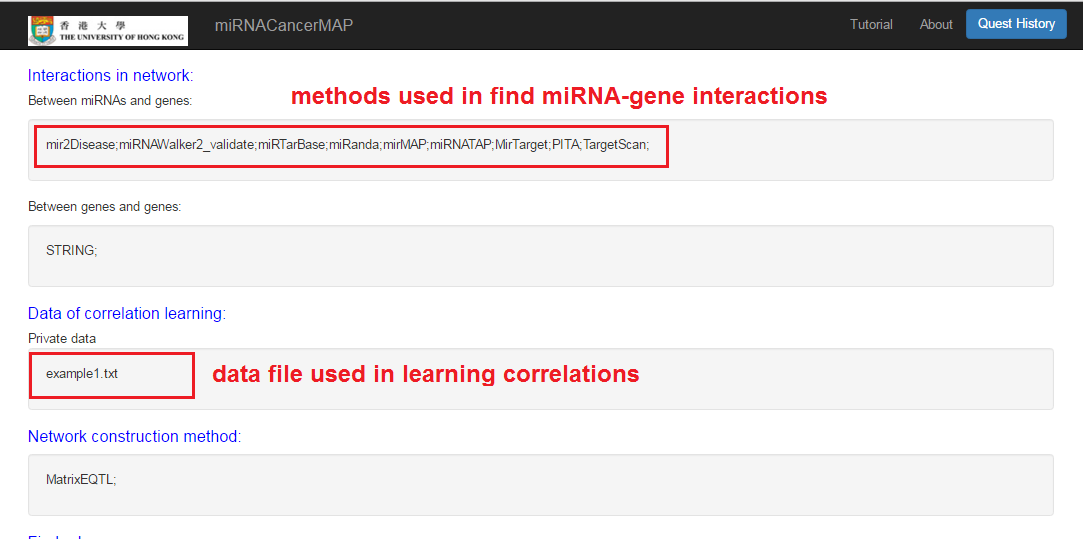
- Interactions and correlations between miRNAs and mRNAs
- Result can be retrieved by quest ID
- Click and visualize the regulatory network
miRNA-mRNA regulatory network visualization
- In network visualization panel, we can zoom-in/out and drag the network
- In user's setting panel, we can adjust network appearance by personal customization
Focus on specified mRNA and show the miRNAs
- We can highlight the regulating miRNAs of target mRNA by "mouseover"
Present the informations that support the edge
- The miRNA-mRNA correlation and binding evidence will be shown beside by "mouseover"
- The PMID of experimental evidence of the miRNA-mRNA regulation in cancer study will be presented. And the corresponding edge will be highlighted by orange color
Highlight target mRNAs regulated by the specified miRNA
- We can highlight the target mRNA under regulation of the specified miRNA by "mouseover"
Show the table of miRNA-mRNA regulations
- Click on the "Regulations" tab
- We can also download the full result of this analysis
Show the GO enrichment result of mRNAs in the network
- Click on the "GO enrichment" tab
Show the pathway enrichment result of mRNAs in the network
- Click on the "Pathway enrichment" tab
- Click to show the pathway regulation. This figure is plotted by R "Pathview" package. Up/down-regulation of mRNA expression is between the high stage tumors (stage iii&iv) and low stage of tumors(stage i&ii)
Hub miRNA identified by network topology analysis
- Click on the "Network topology analysis" tab
- The hub miRNAs (with the high network betweenness) would be the underlying cancer drivers or tumor suppressors
miRNA related to cancer pathways
- Click on node in the network and show the information page
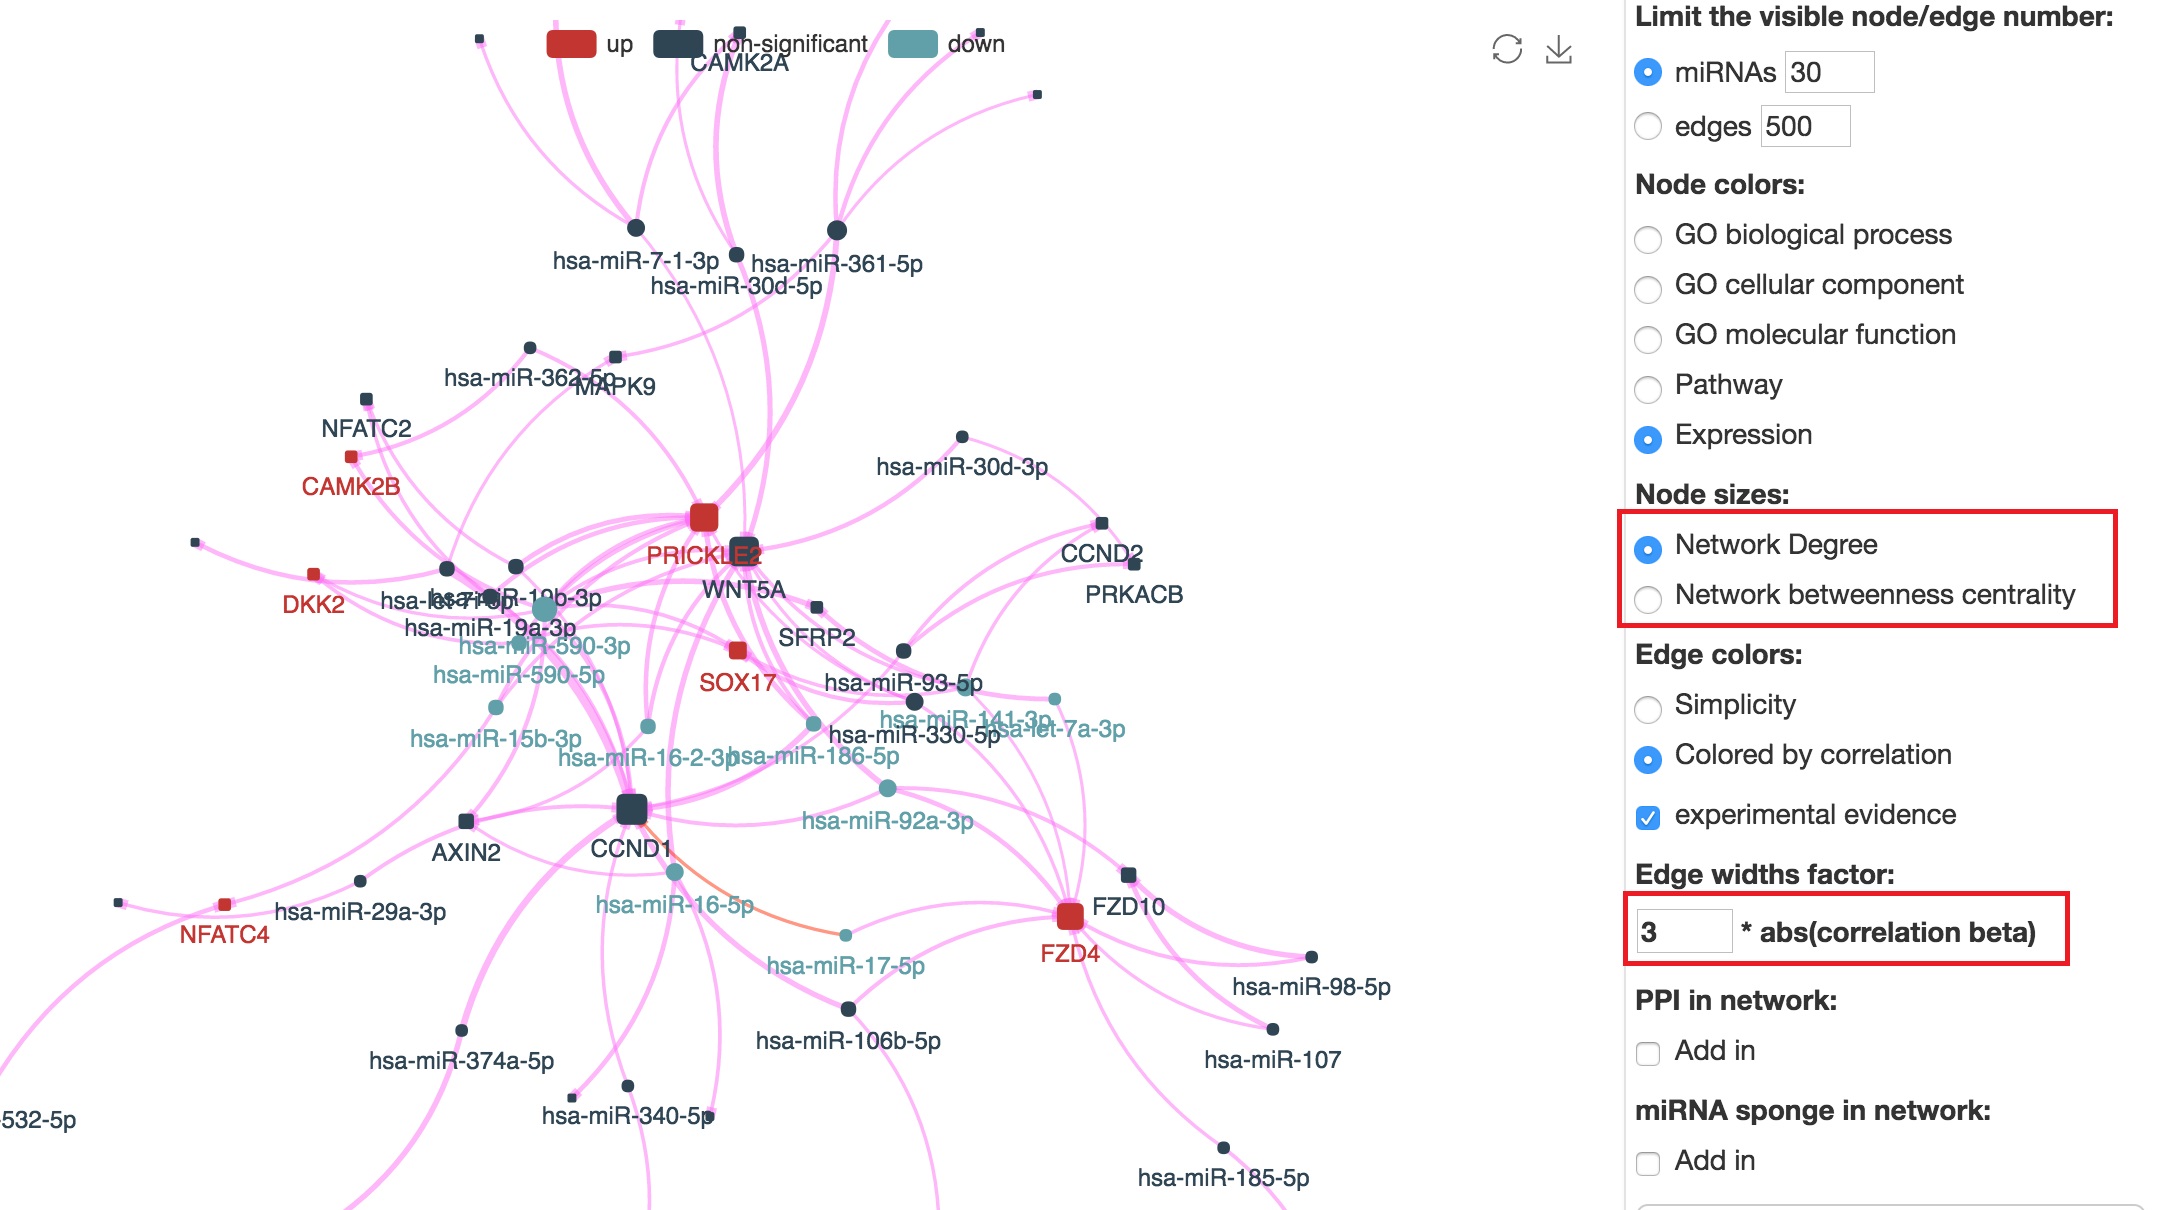
"miRNACancerMAP" is also a network visualization tool for user to draw their regulatory network by personal customization. Users can set the complexity of the visualized network by limiting the number of nodes or edges. And the color of the nodes can be defined by different categories of the mRNAs and miRNAs, like mRNA-Ontology, pathway and expression status. User can also select to use network degree or network betweenness to define the node size. And edges can be black or colored by the correlation. Purple edge means negative correlation and blue edge means positive correlation. We can also add the protein-protein interactions (PPI) into the network. This result will show the cluster of mRNAs regulated by some specific miRNAs. Additionally, miRNA-miRNA edges can be added by the "miRNA sponge" button. This result will show some clusters of miRNA are co-regulating the same mRNA.
Retrieve previous network by quest ID
- Click on "Quest History" button
- Type in your quest ID (for example "ba2bc7f926b89c0ec078a1eaa6af64cb") and click on submit
- This example network is constructed on TCGA BRCA dataset for Epithelial Mesenchymal Transition genes.
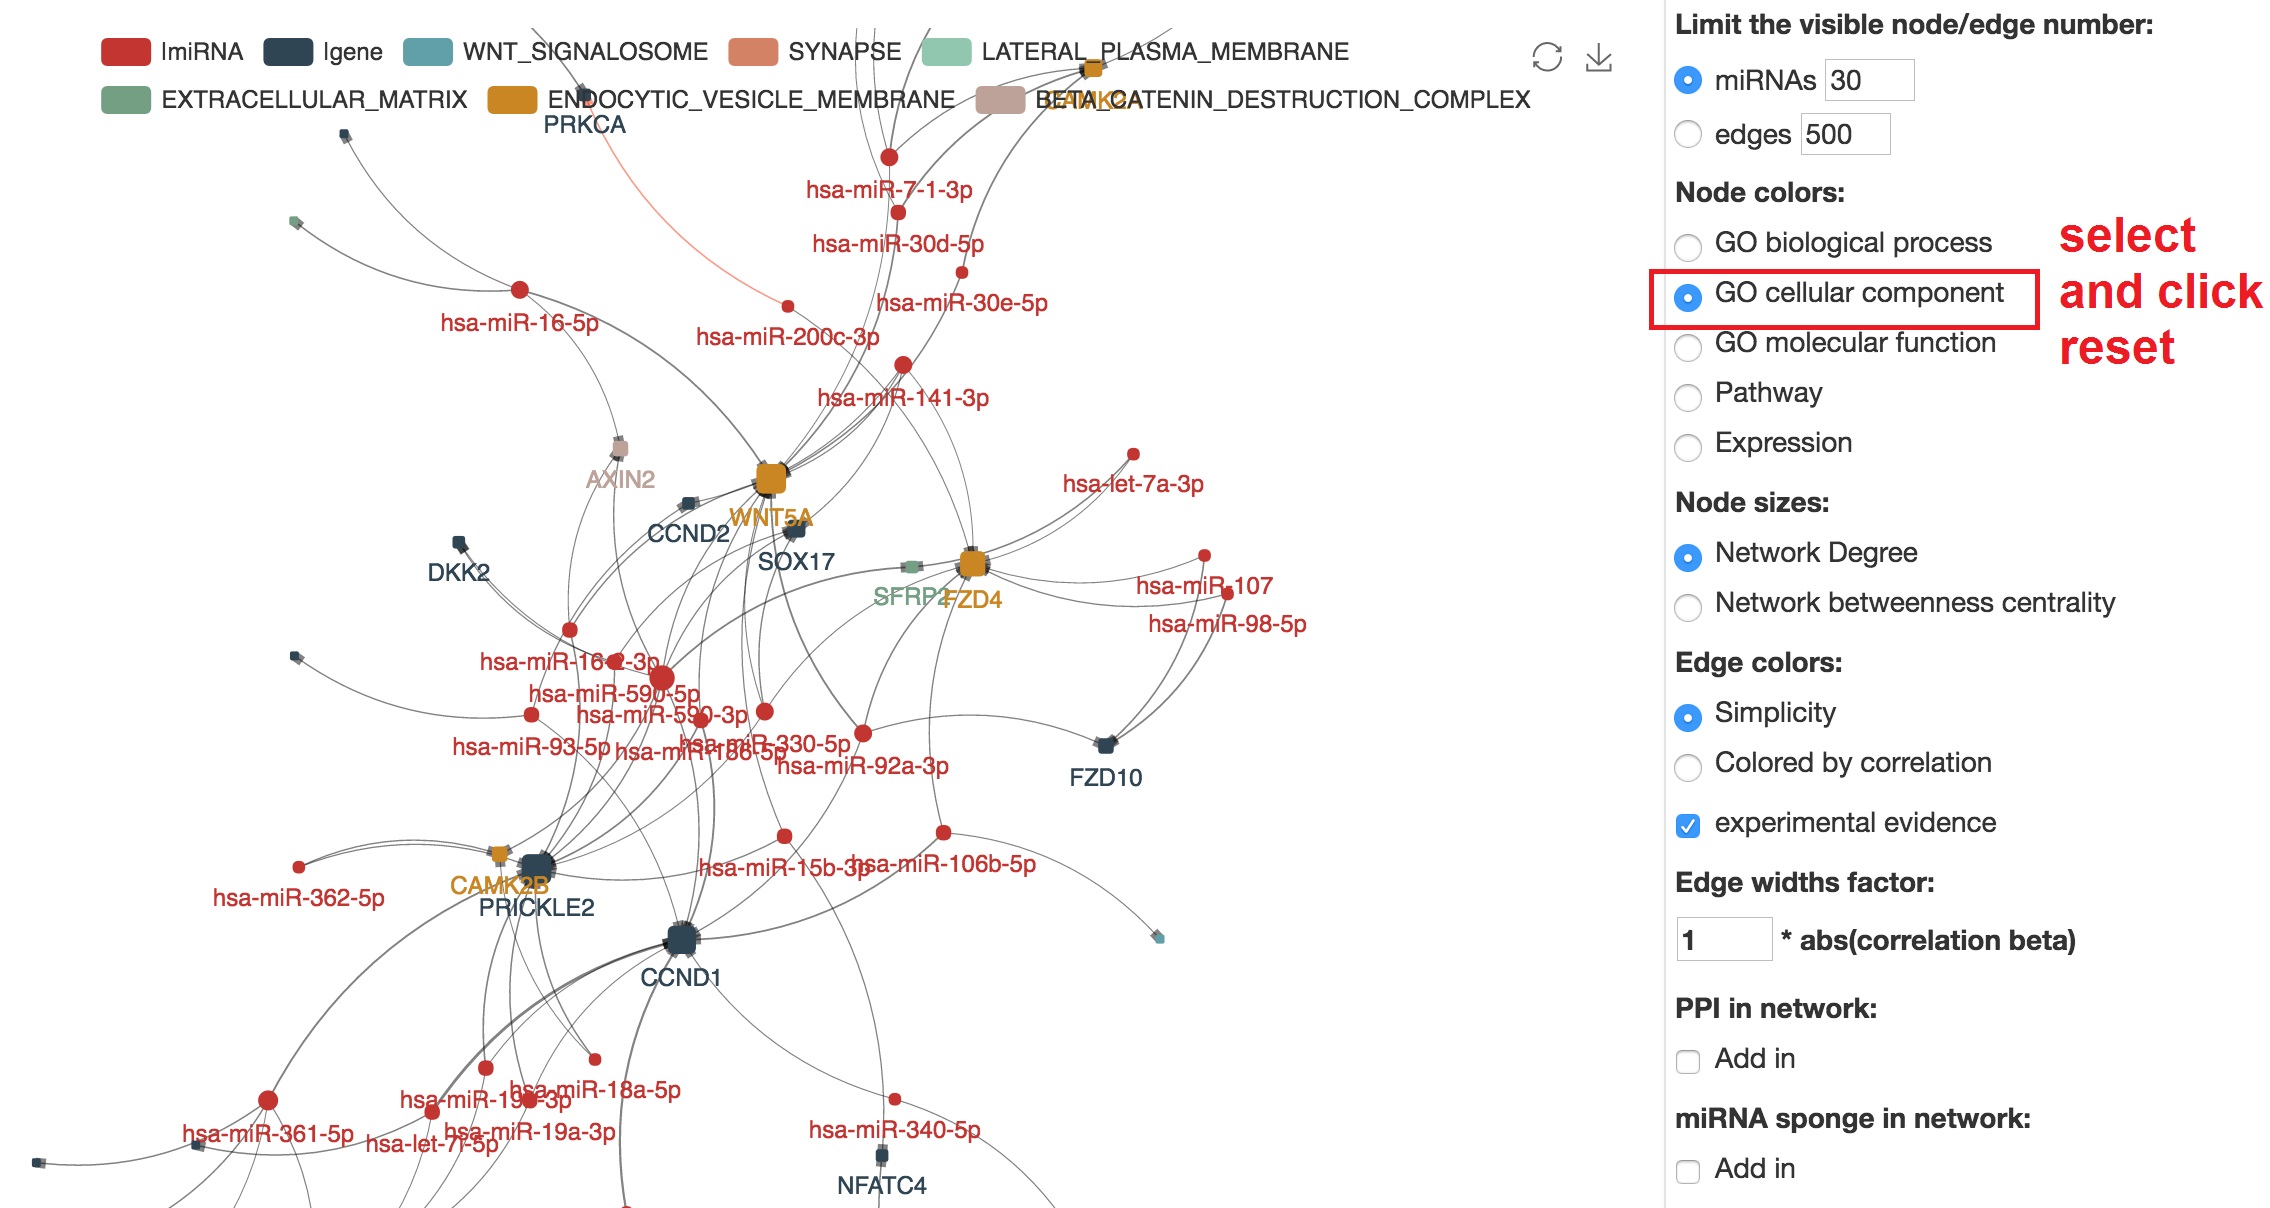
Customize node colors
- In node color section, select "GO cellular component" and reset
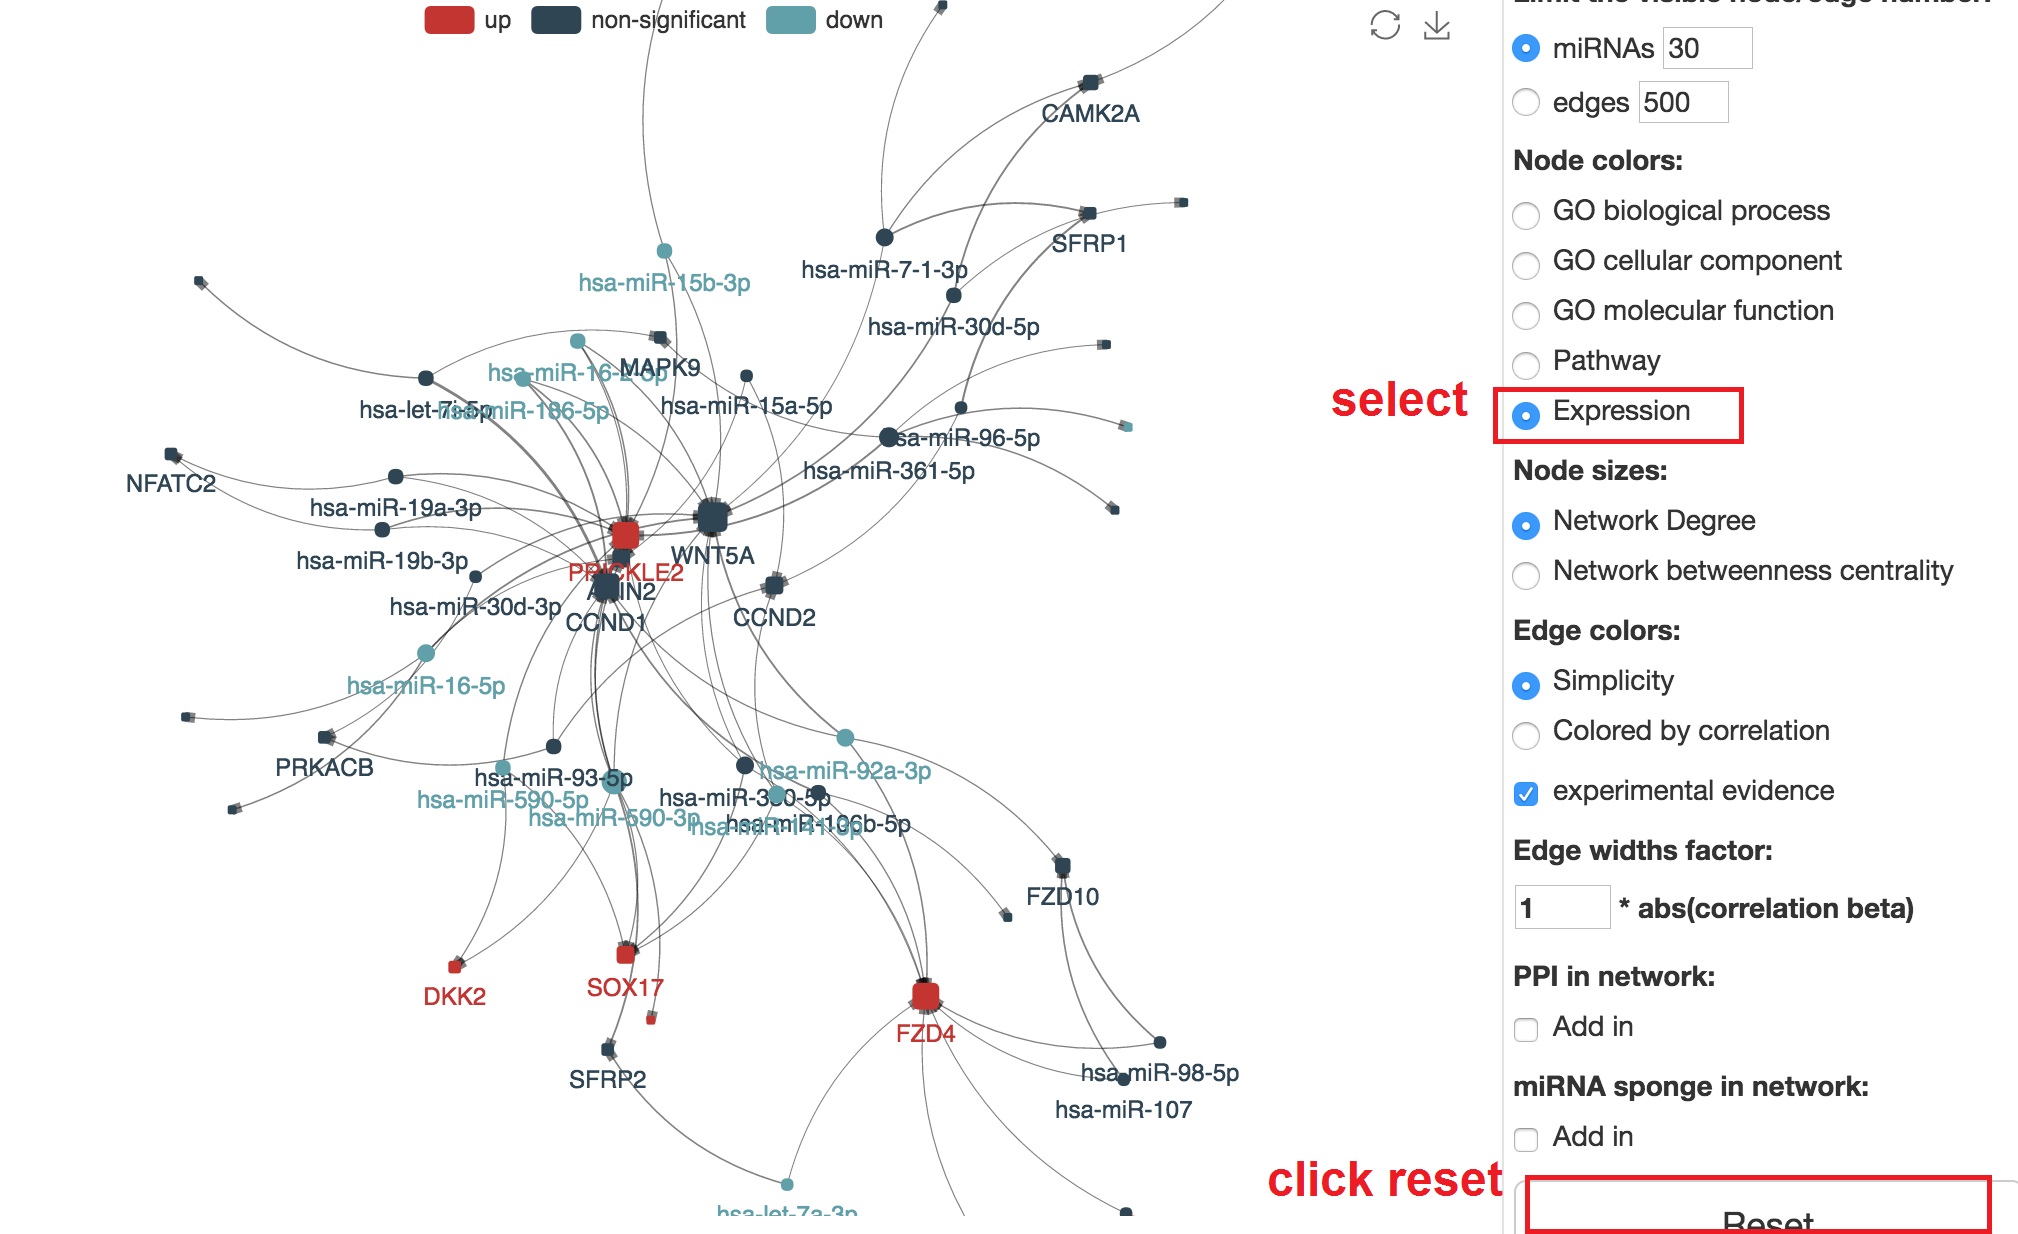
- In node color section, select "Expression" and reset
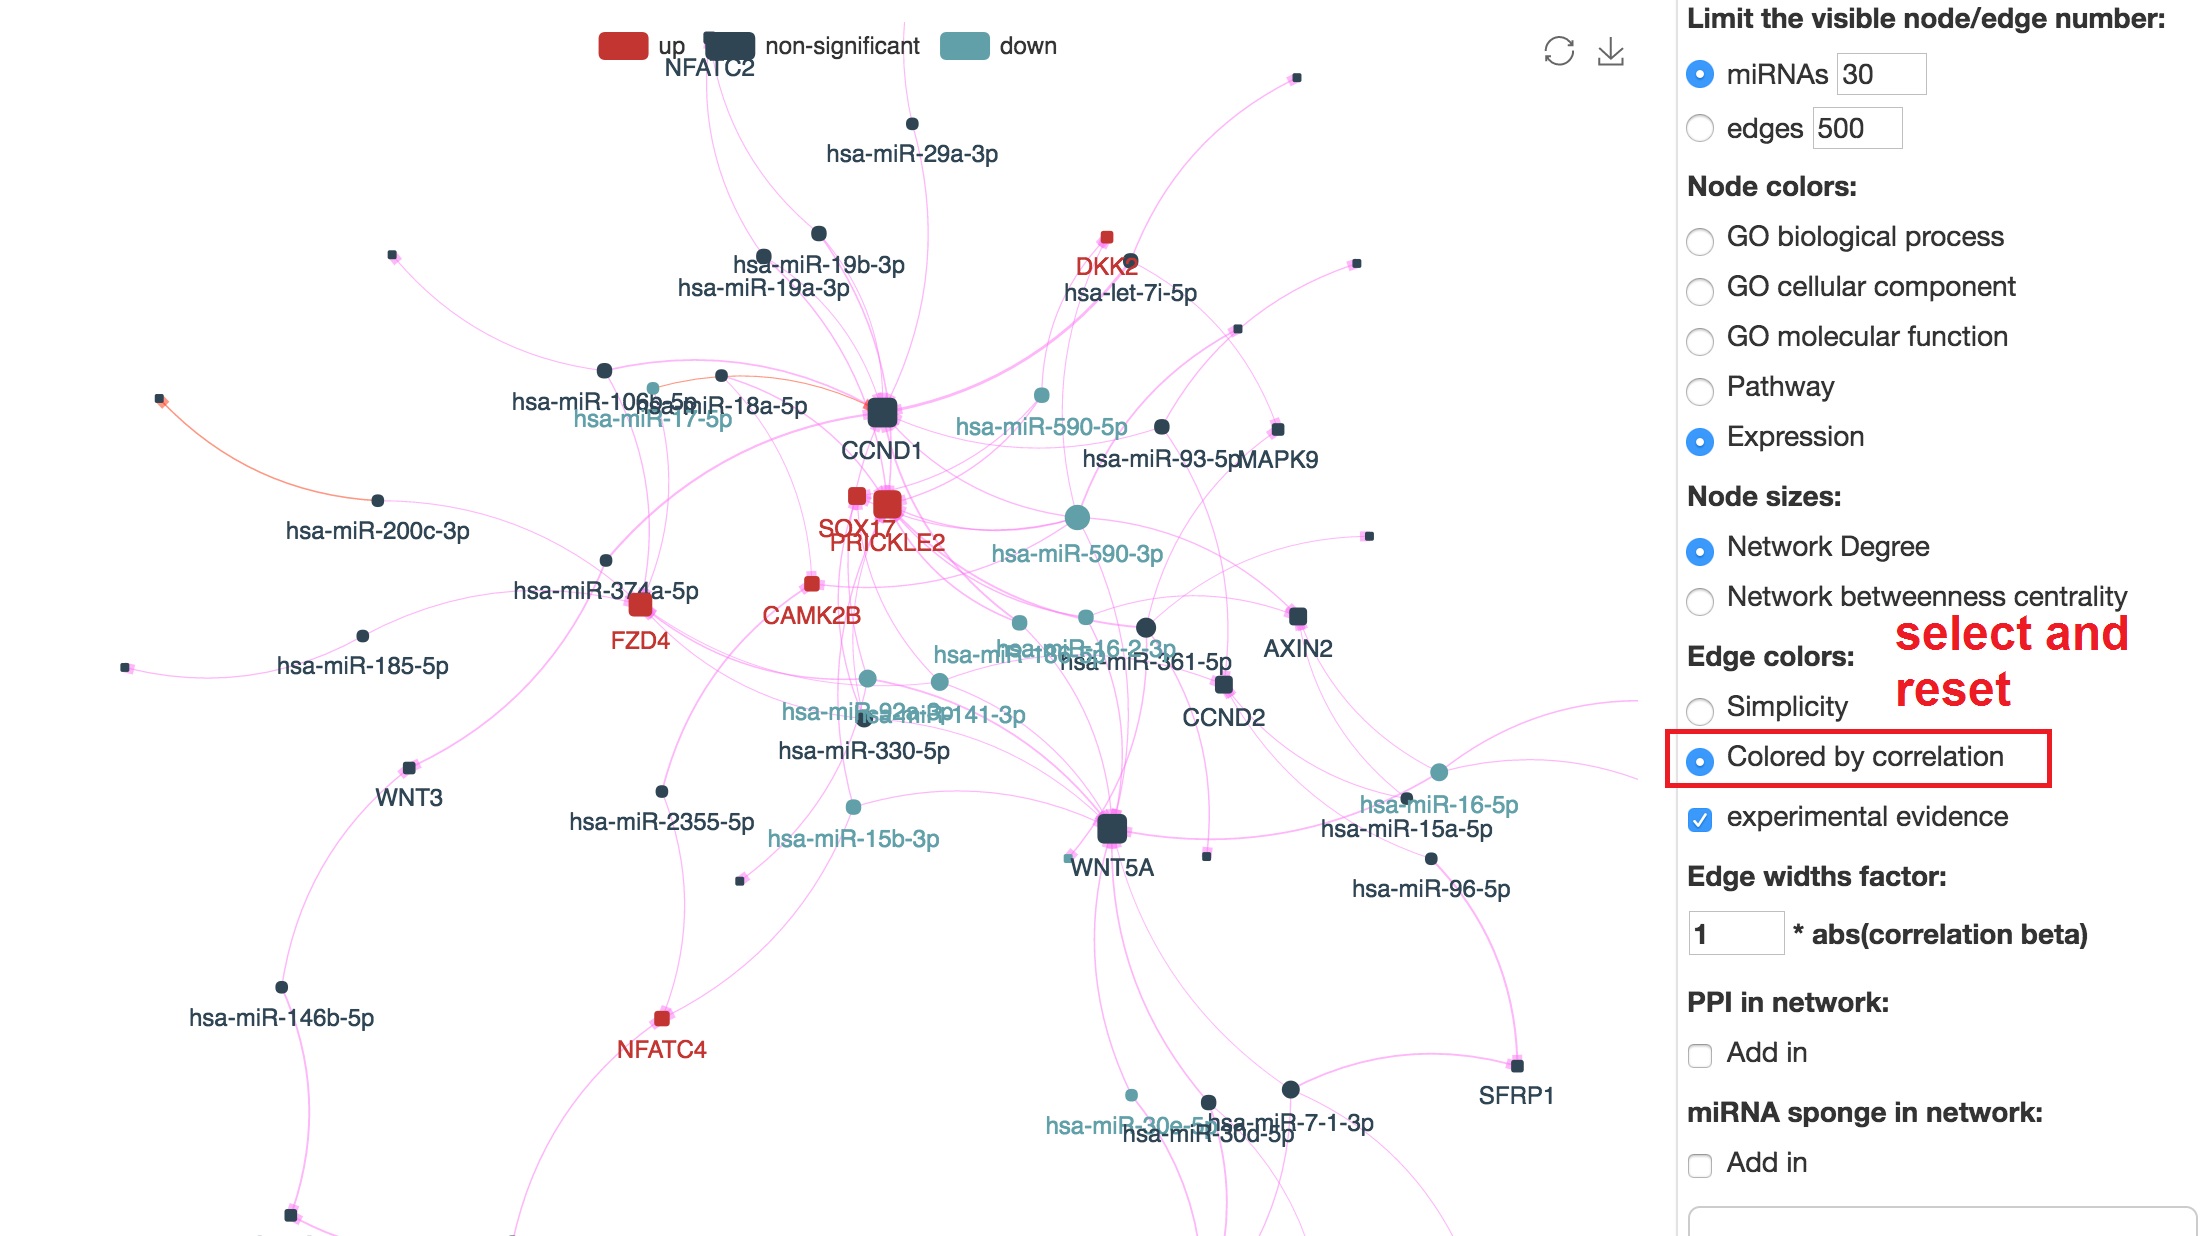
Customize edge colors
- In edge color section, select "Colored by correlation" and reset
- Positive correlation will be colored by blue, and negative correlation will be colored by purple.
Customize the size of nodes and edges
Add protein-protein interations in the network
- Tick on the "PPI add in"
- This result will show the cluster of mRNAs regulated by some specific miRNAs
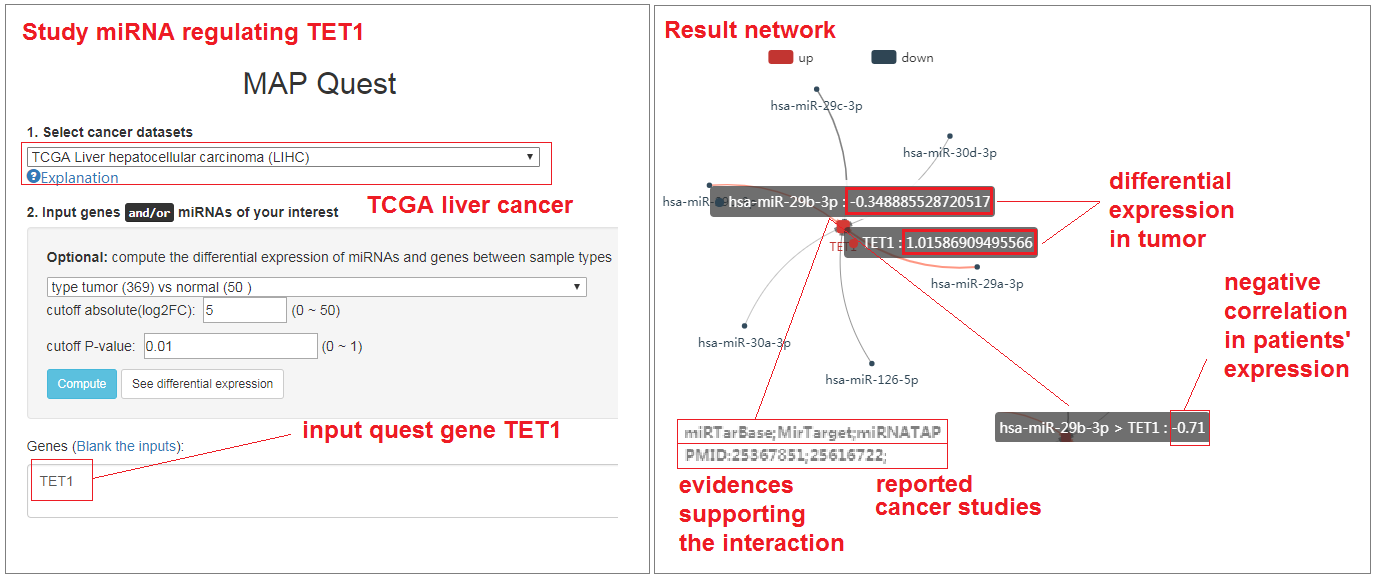
Study miRNA regulation involved with DNA methylation
- Click on "Regulation network" button
- Select TCGA liver cancer data set
- Input the famous demethylation gene: TET1
- Click and submit your quest. (Please wait several seconds for computation)
- See the result (quest ID: 4b54ce6ff0a30e2b5c9041c8413609ef)
- The miRNA-gene regulatory network presented the active regulation between miRNA-29a/b/c and TET1 genes. The down-expression of miR-29 family result in the upregulation of TET1, which indicated a novel mechanism of DNA methylation alterations in cancer development.
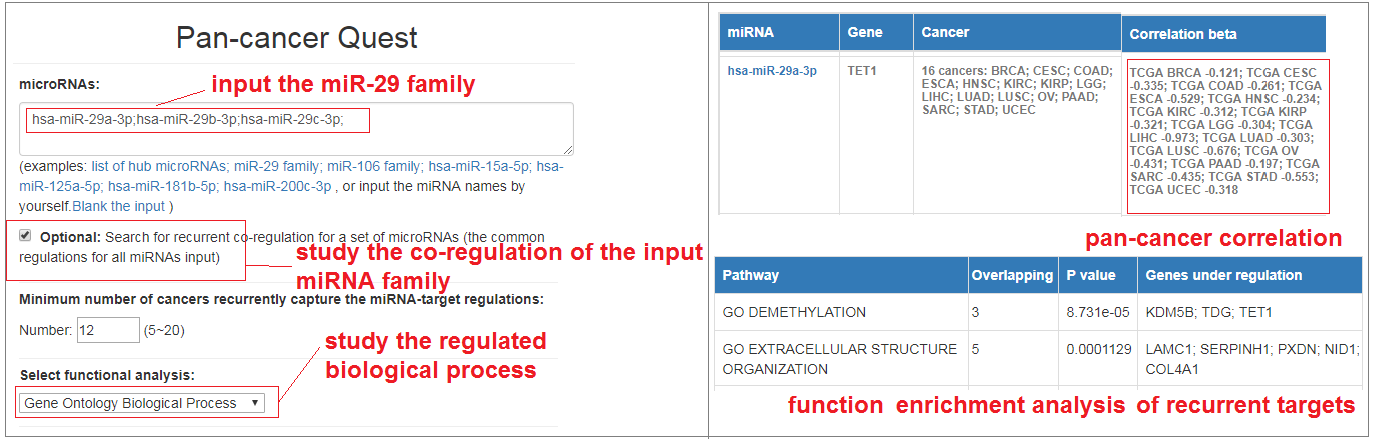
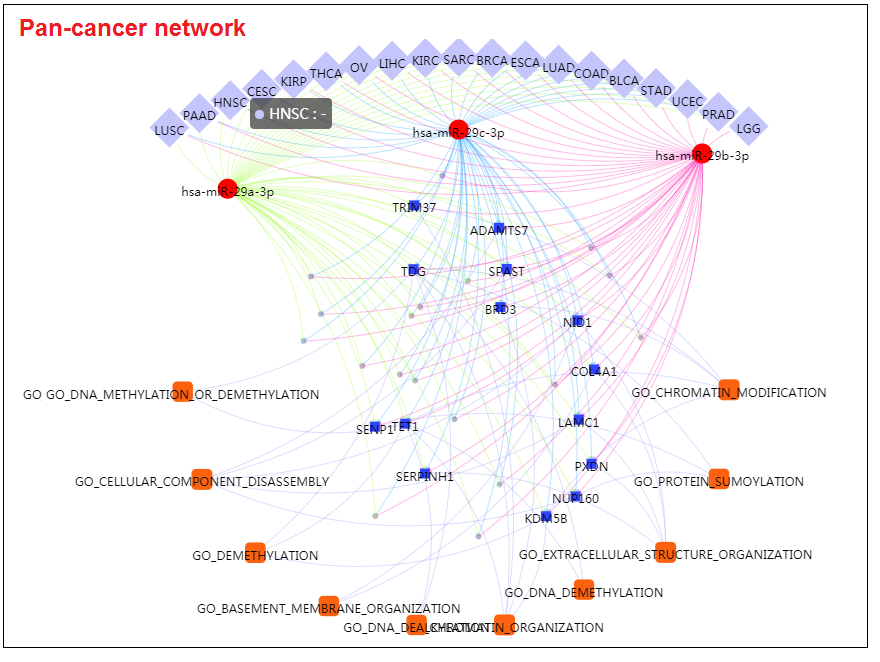
- Then input "hsa-miR-29a-3p;hsa-miR-29b-3p;hsa-miR-29c-3p;" in the pan-cancer module, and select the co-regulation option and GO biological process to conduct functional analysis.
- The result shows the miR-29 family recurrently regulated the KDM5B, TDG and TET1 in at least 12 cancer types, which significantly enriched for the demethylation biological process (P-value = 8.7e-05). The pan-caner regulation indicates a conserved mechanism that miR-29 may be responsible for global DNA demethylation in cancers. These results are consistent with previous studies that miR-29 family acting as recurrent regulator of DNA demethylation by regulating TDG and TET1.
- Reference: 1.Jacobsen, Anders, et al. "Analysis of microRNA-target interactions across diverse cancer types." Nature structural & molecular biology 20.11 (2013): 1325-1332. 2.Zhang, Pei, et al. "Ten-eleven translocation (Tet) and thymine DNA glycosylase (TDG), components of the demethylation pathway, are direct targets of miRNA-29a." Biochemical and biophysical research communications 437.3 (2013): 368-373.
Study miRNA regulation of Epithelial Mesenchymal Transition in breast cancer
- Click on "Regulation network" button
- Select breast cancer
- Click and load mRNAs in Epithelial Mesenchymal Transition pathway
- Click and submit your quest. (Please wait several seconds for computation)
- See the result (quest ID: ba2bc7f926b89c0ec078a1eaa6af64cb)
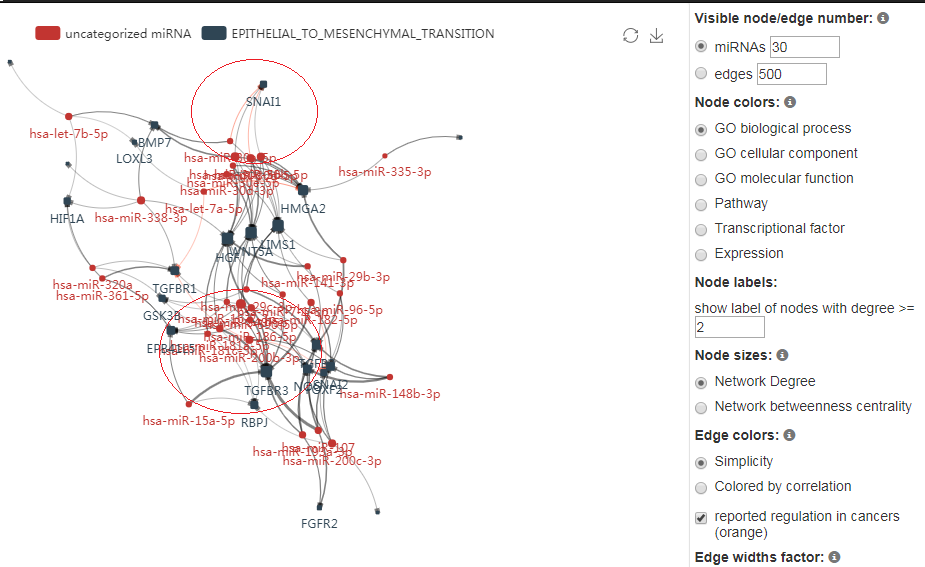
- The miRNA-gene regulatory network presented the miRNAs that target EMT genes, and correlated with the gene expression in cancer samples. miRNACancerMAP identifies these edges as active regulations in cancer progression.
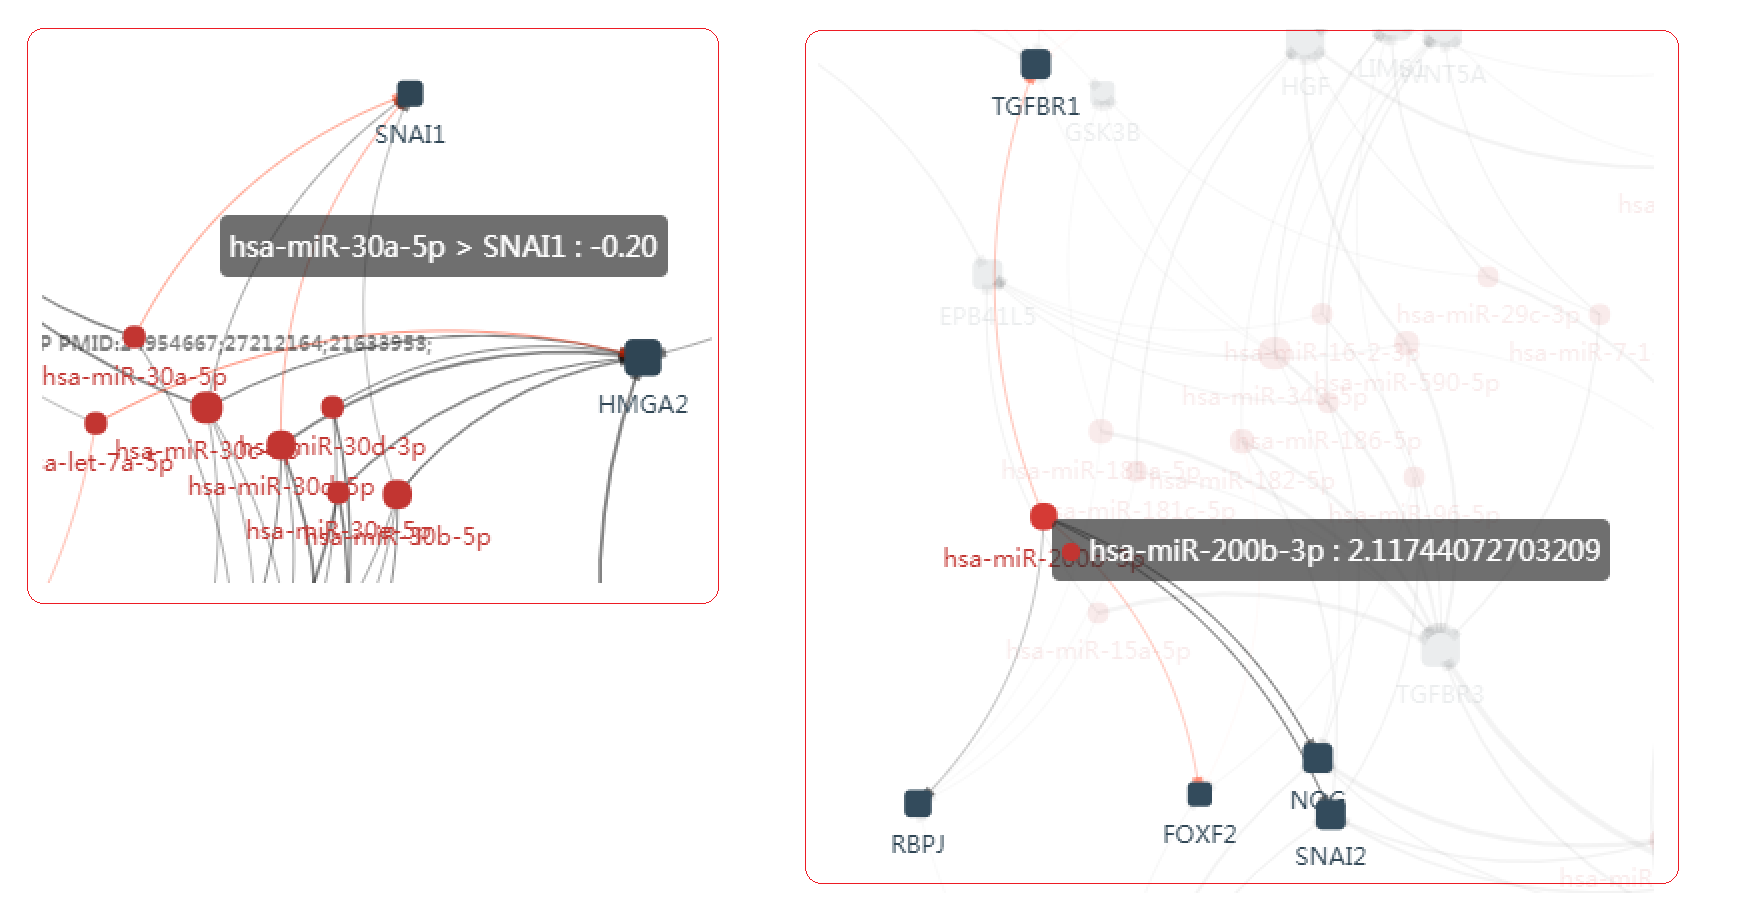
- SNAI1, a famous EMT gene, is inferred to be regulated by 4 miRNAs, miR-30a,miR-30b,miR-30c and miR-30d. Among them 2 regulations have already been reported by previous cancer studies.
- miR-200b is inferred to regulate 5 genes. TGFBR2 and FOXF2 have already been reported in cancer studies. And the rest gene NOG, SNAI2 and RBPJ may be the potential target which is under regulation of this miRNA, and mediate the epithelial mesenchymal transition process.
- These results show a strong ability of our method in recurrence of previous findings, as well as to uncover potential miRNAs that affects specific cancer.
- Reference: 1. Kumarswamy, Regalla, et al. "MicroRNA-30a inhibits epithelial-to-mesenchymal transition by targeting Snai1 and is downregulated in non-small cell lung cancer." International journal of cancer 130.9 (2012): 2044-2053. 2. Ye, Zhongxue, et al. "miR-30d Blocked Transforming Growth Factor beta1-Induced Epithelial-Mesenchymal Transition by Targeting Snail in Ovarian Cancer Cells." International Journal of Gynecological Cancer 25.9 (2015): 1574-1581. 3. Braun, J., et al. "Downregulation of microRNAs directs the EMT and invasive potential of anaplastic thyroid carcinomas." Oncogene 29.29 (2010): 4237-4244. 4.Kundu, Samrat T., et al. "The miR-200 family and the miR-183~ 96~ 182 cluster target Foxf2 to inhibit invasion and metastasis in lung cancers." Oncogene 35.2 (2016): 173-186.
-
Study the recurrent co-regulation of miR-106 family
- Input "hsa-miR-17-5p;hsa-miR-106a-5p;hsa-miR-106b-5p" in the pan-cancer module, and select the co-regulation option and kegg pathway annotation. Adjust the minimum cancer number into 10.
- The result shows the miR-106 family recurrently regulated the SMAD7, BMPR2, TGFBR2 and THBS2 in at least 12 cancer types, which significantly enriched for the TGF.beta signaling pathway (P-value = 0.004). The pan-caner regulation indicates a conserved mechanism that miR-106 may be the master regulator of TGF beta pathway in cancers. These results are consistent with previous study.
- Reference: 1.Jacobsen, Anders, et al. "Analysis of microRNA-target interactions across diverse cancer types." Nature structural & molecular biology 20.11 (2013): 1325-1332.
Study lncRNA sponge regulation on PLXDC1
- Click on "Regulation network" button
- Select TCGA liver cancer data set
- Input the gene name PLXDC1
- Click and submit the quest.
- From TCGA liver cancer cohort, PLXDC1 is found to be controlled by lncRNA GAS5 through sponge regulation, that they present a strong positive correlation in expression (PCC=0.556) and consume the same microRNA pool (hsa-let-7b-3p;hsa-let-7g-5p;hsa-miR-148a-3p;hsa-miR-193a-5p;hsa-miR-193b-5p;hsa-miR-194-3p;hsa-miR-194-5p;hsa-miR-26b-5p;hsa-miR-29a-3p;hsa-miR-29c-3p;hsa-miR-3065-3p;hsa-miR-30a-3p;hsa-miR-30e-3p;hsa-miR-3614-5p;hsa-miR-374a-3p;hsa-miR-590-3p;hsa-miR-7-1-3p).
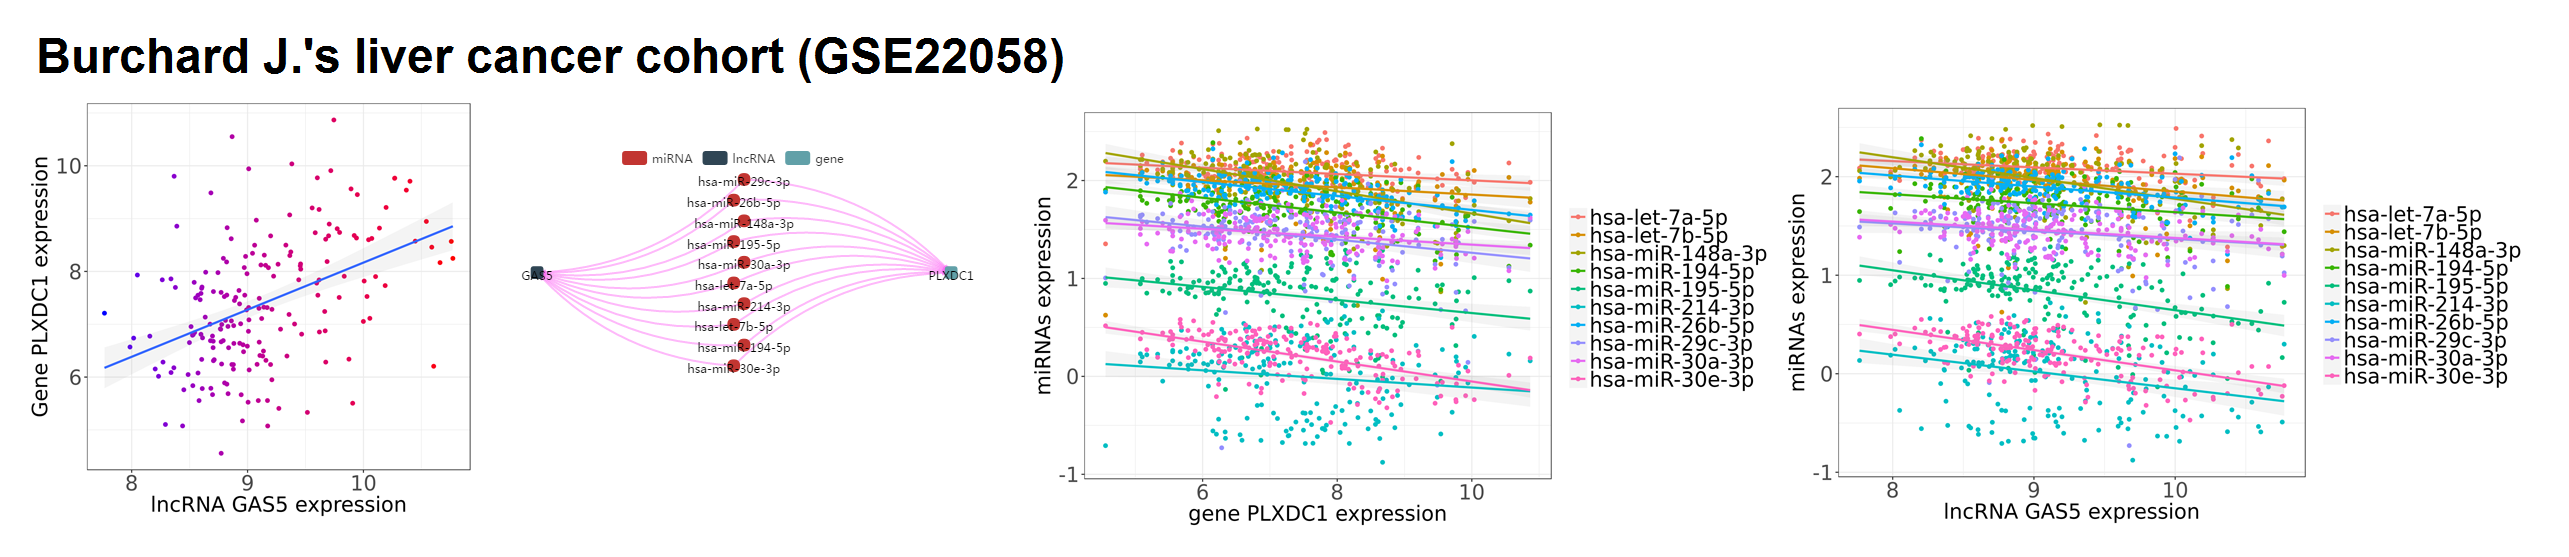
- Repeat the same steps when selecting Burchard J.'s liver cancer cohort (GSE22058). The same lncRNA-miRNAs-gene sponge regulation has been validated by the independent patient cohorts. See more results in following examples.
- Example: GAS5-miRNAs-PLXDC1 cross-validation
- Example: HCG18-miRNAs-PLXDC1 cross-validation
- Example: PVT1-miRNAs-MAFG cross-validation
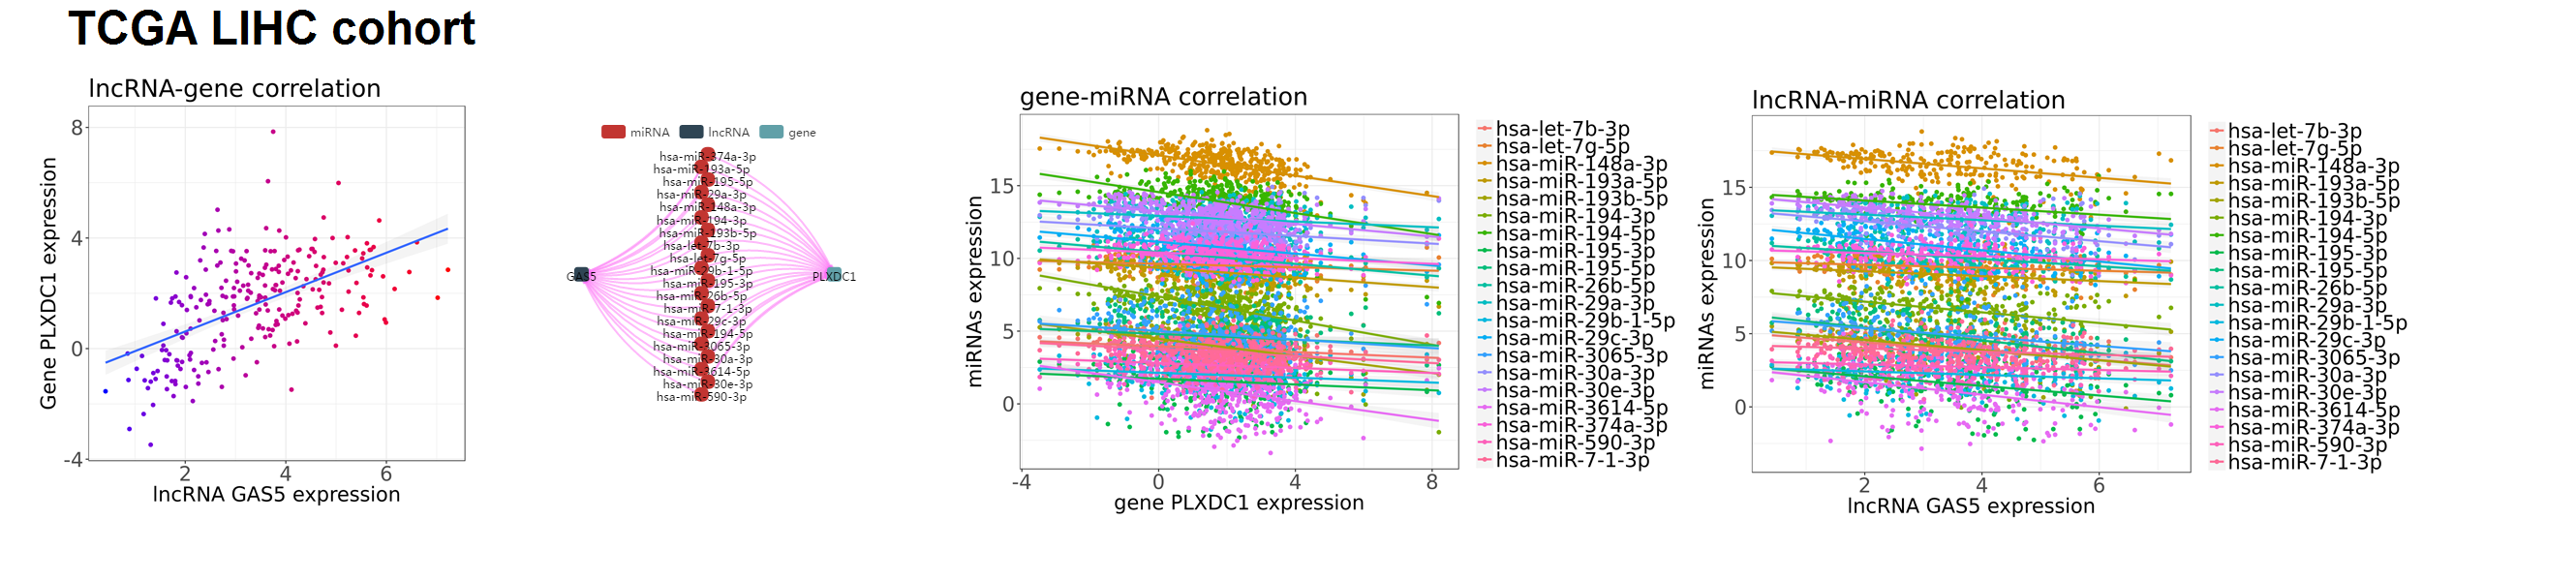
GAS5-miRNAs-PLXDC1 sponge regulation in TCGA LIHC cohort
GAS5-miRNAs-PLXDC1 sponge regulation in Burchard J.'s liver cancer cohort (GSE22058)
HCG18-miRNAs-PLXDC1 sponge regulation in TCGA LIHC cohort
HCG18-miRNAs-PLXDC1 sponge regulation in Burchard J.'s liver cancer cohort (GSE22058)
PVT1-miRNAs-MAFG sponge regulation in TCGA LIHC cohort
PVT1-miRNAs-MAFG sponge regulation in Burchard J.'s liver cancer cohort (GSE22058)
Data statistics
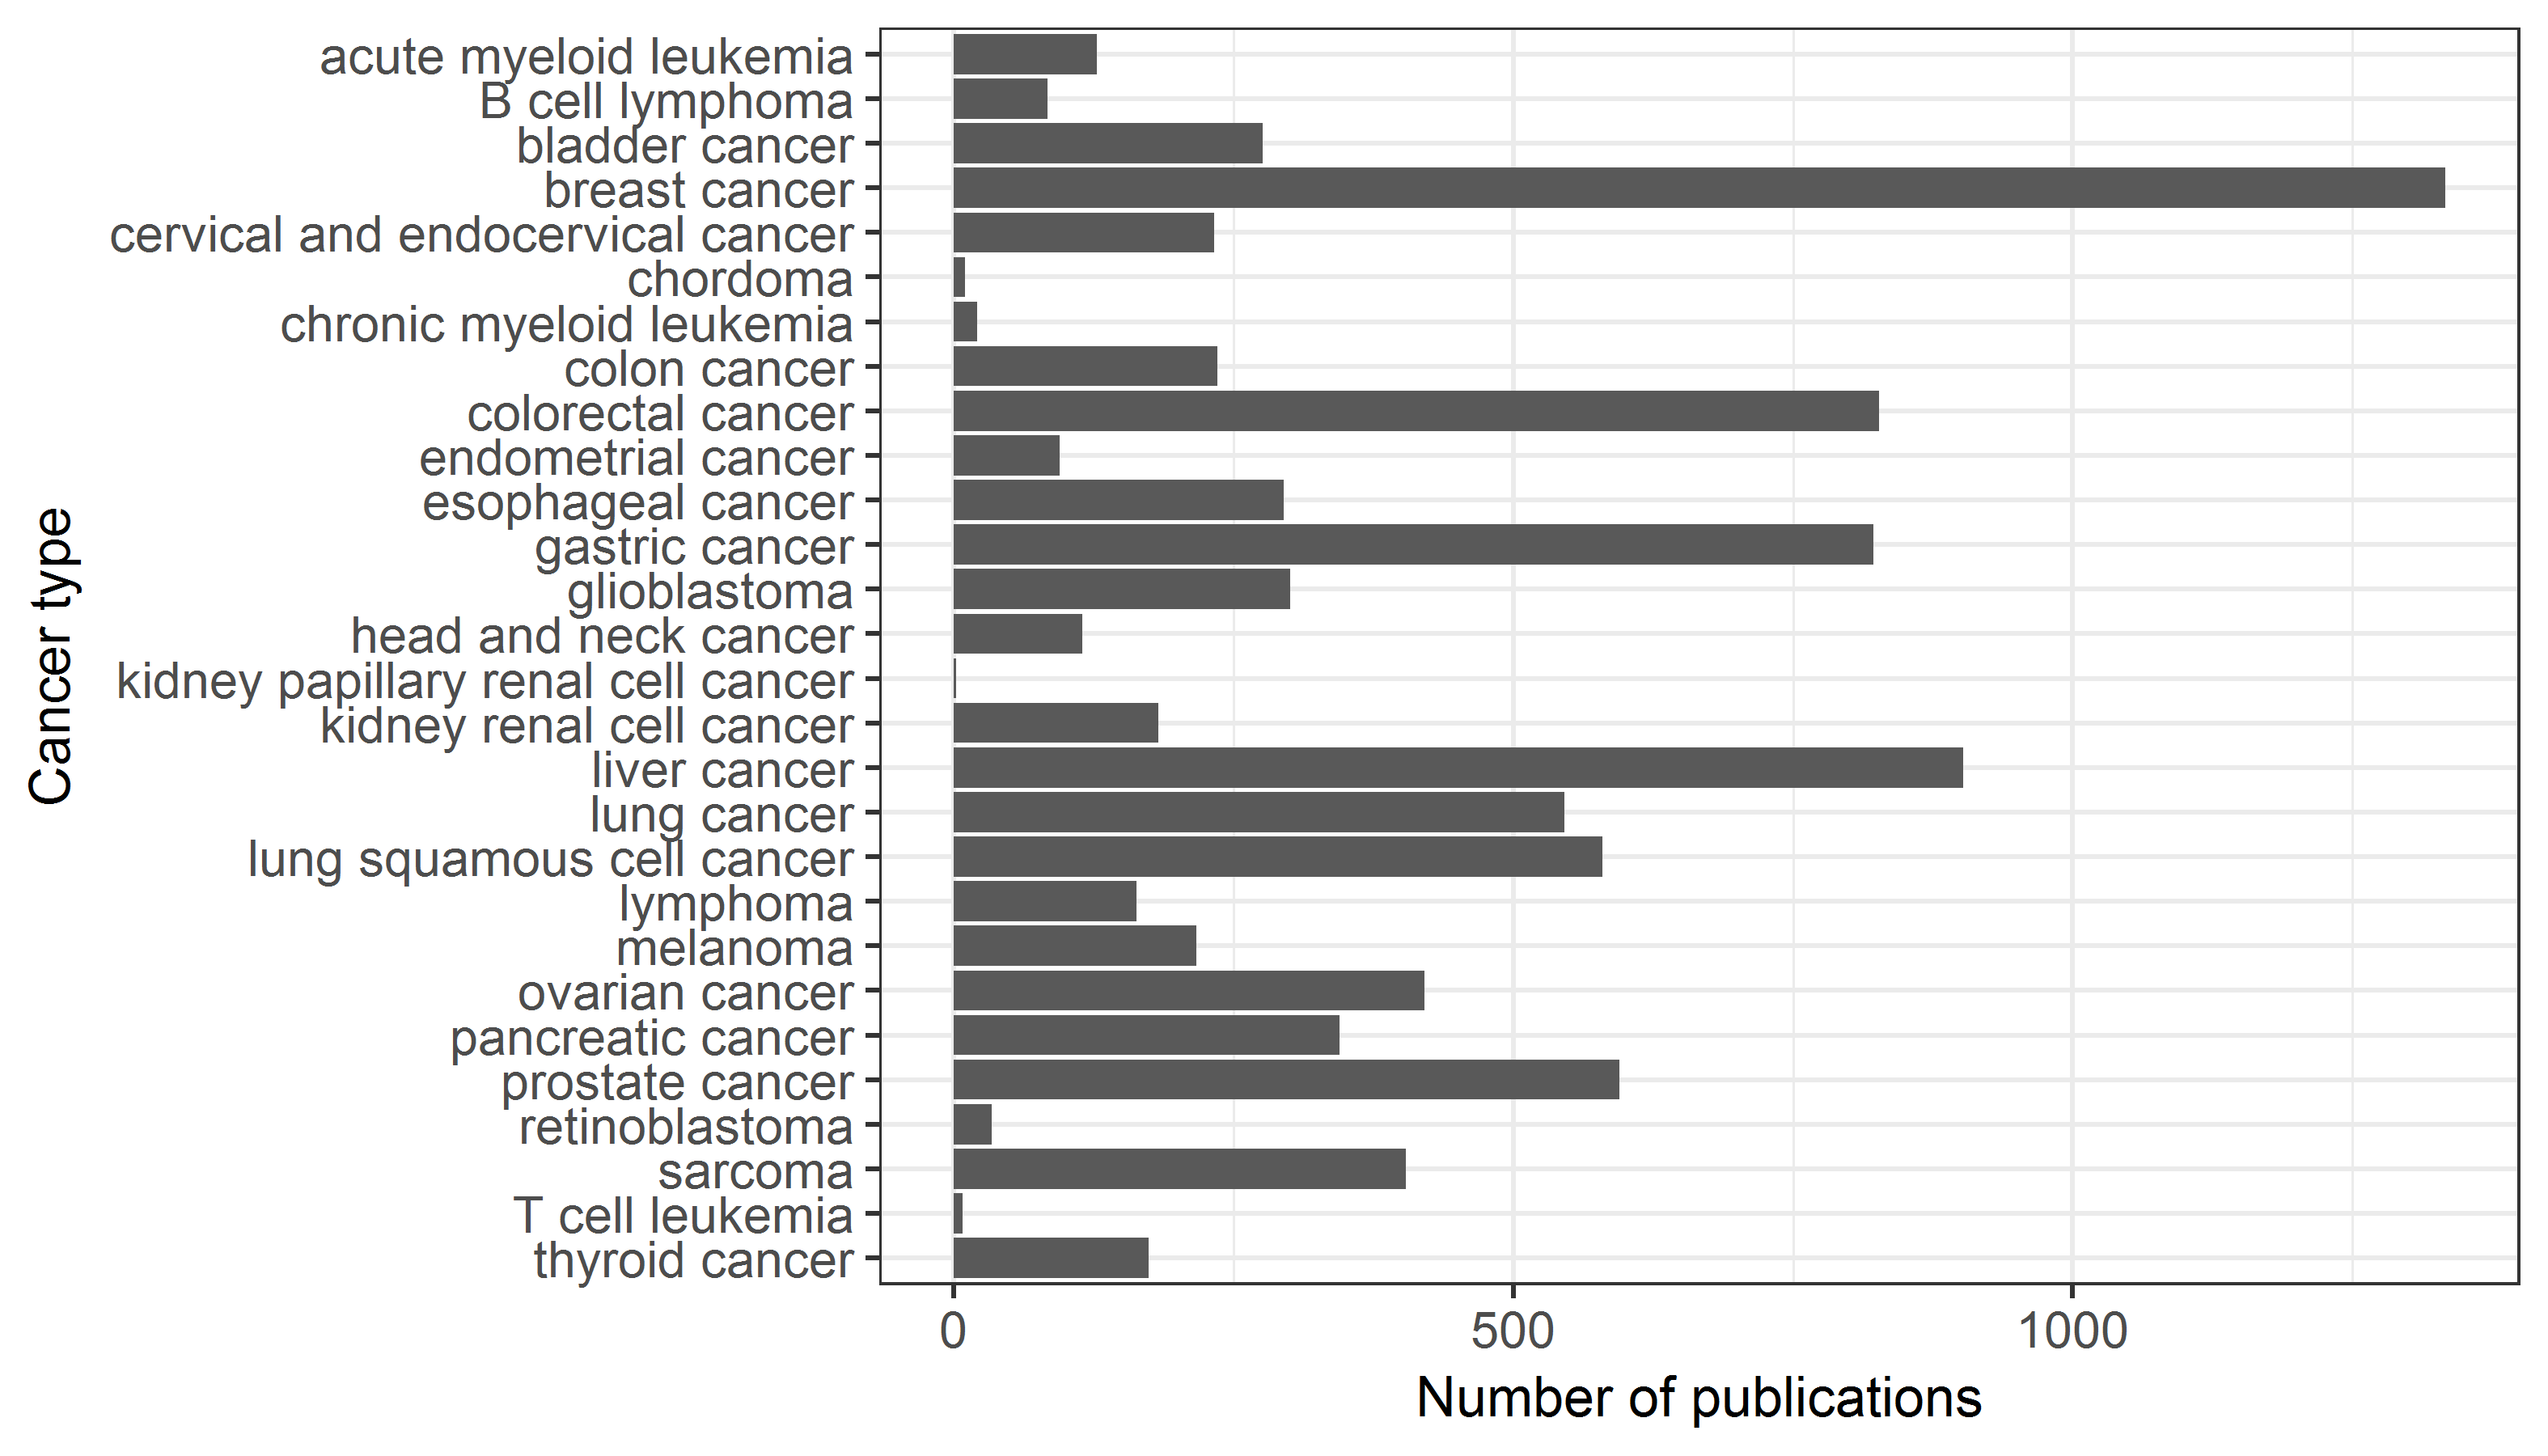
The data statistics of this database includes comprehensive and vast data.
The cancer types included and respective number of publications
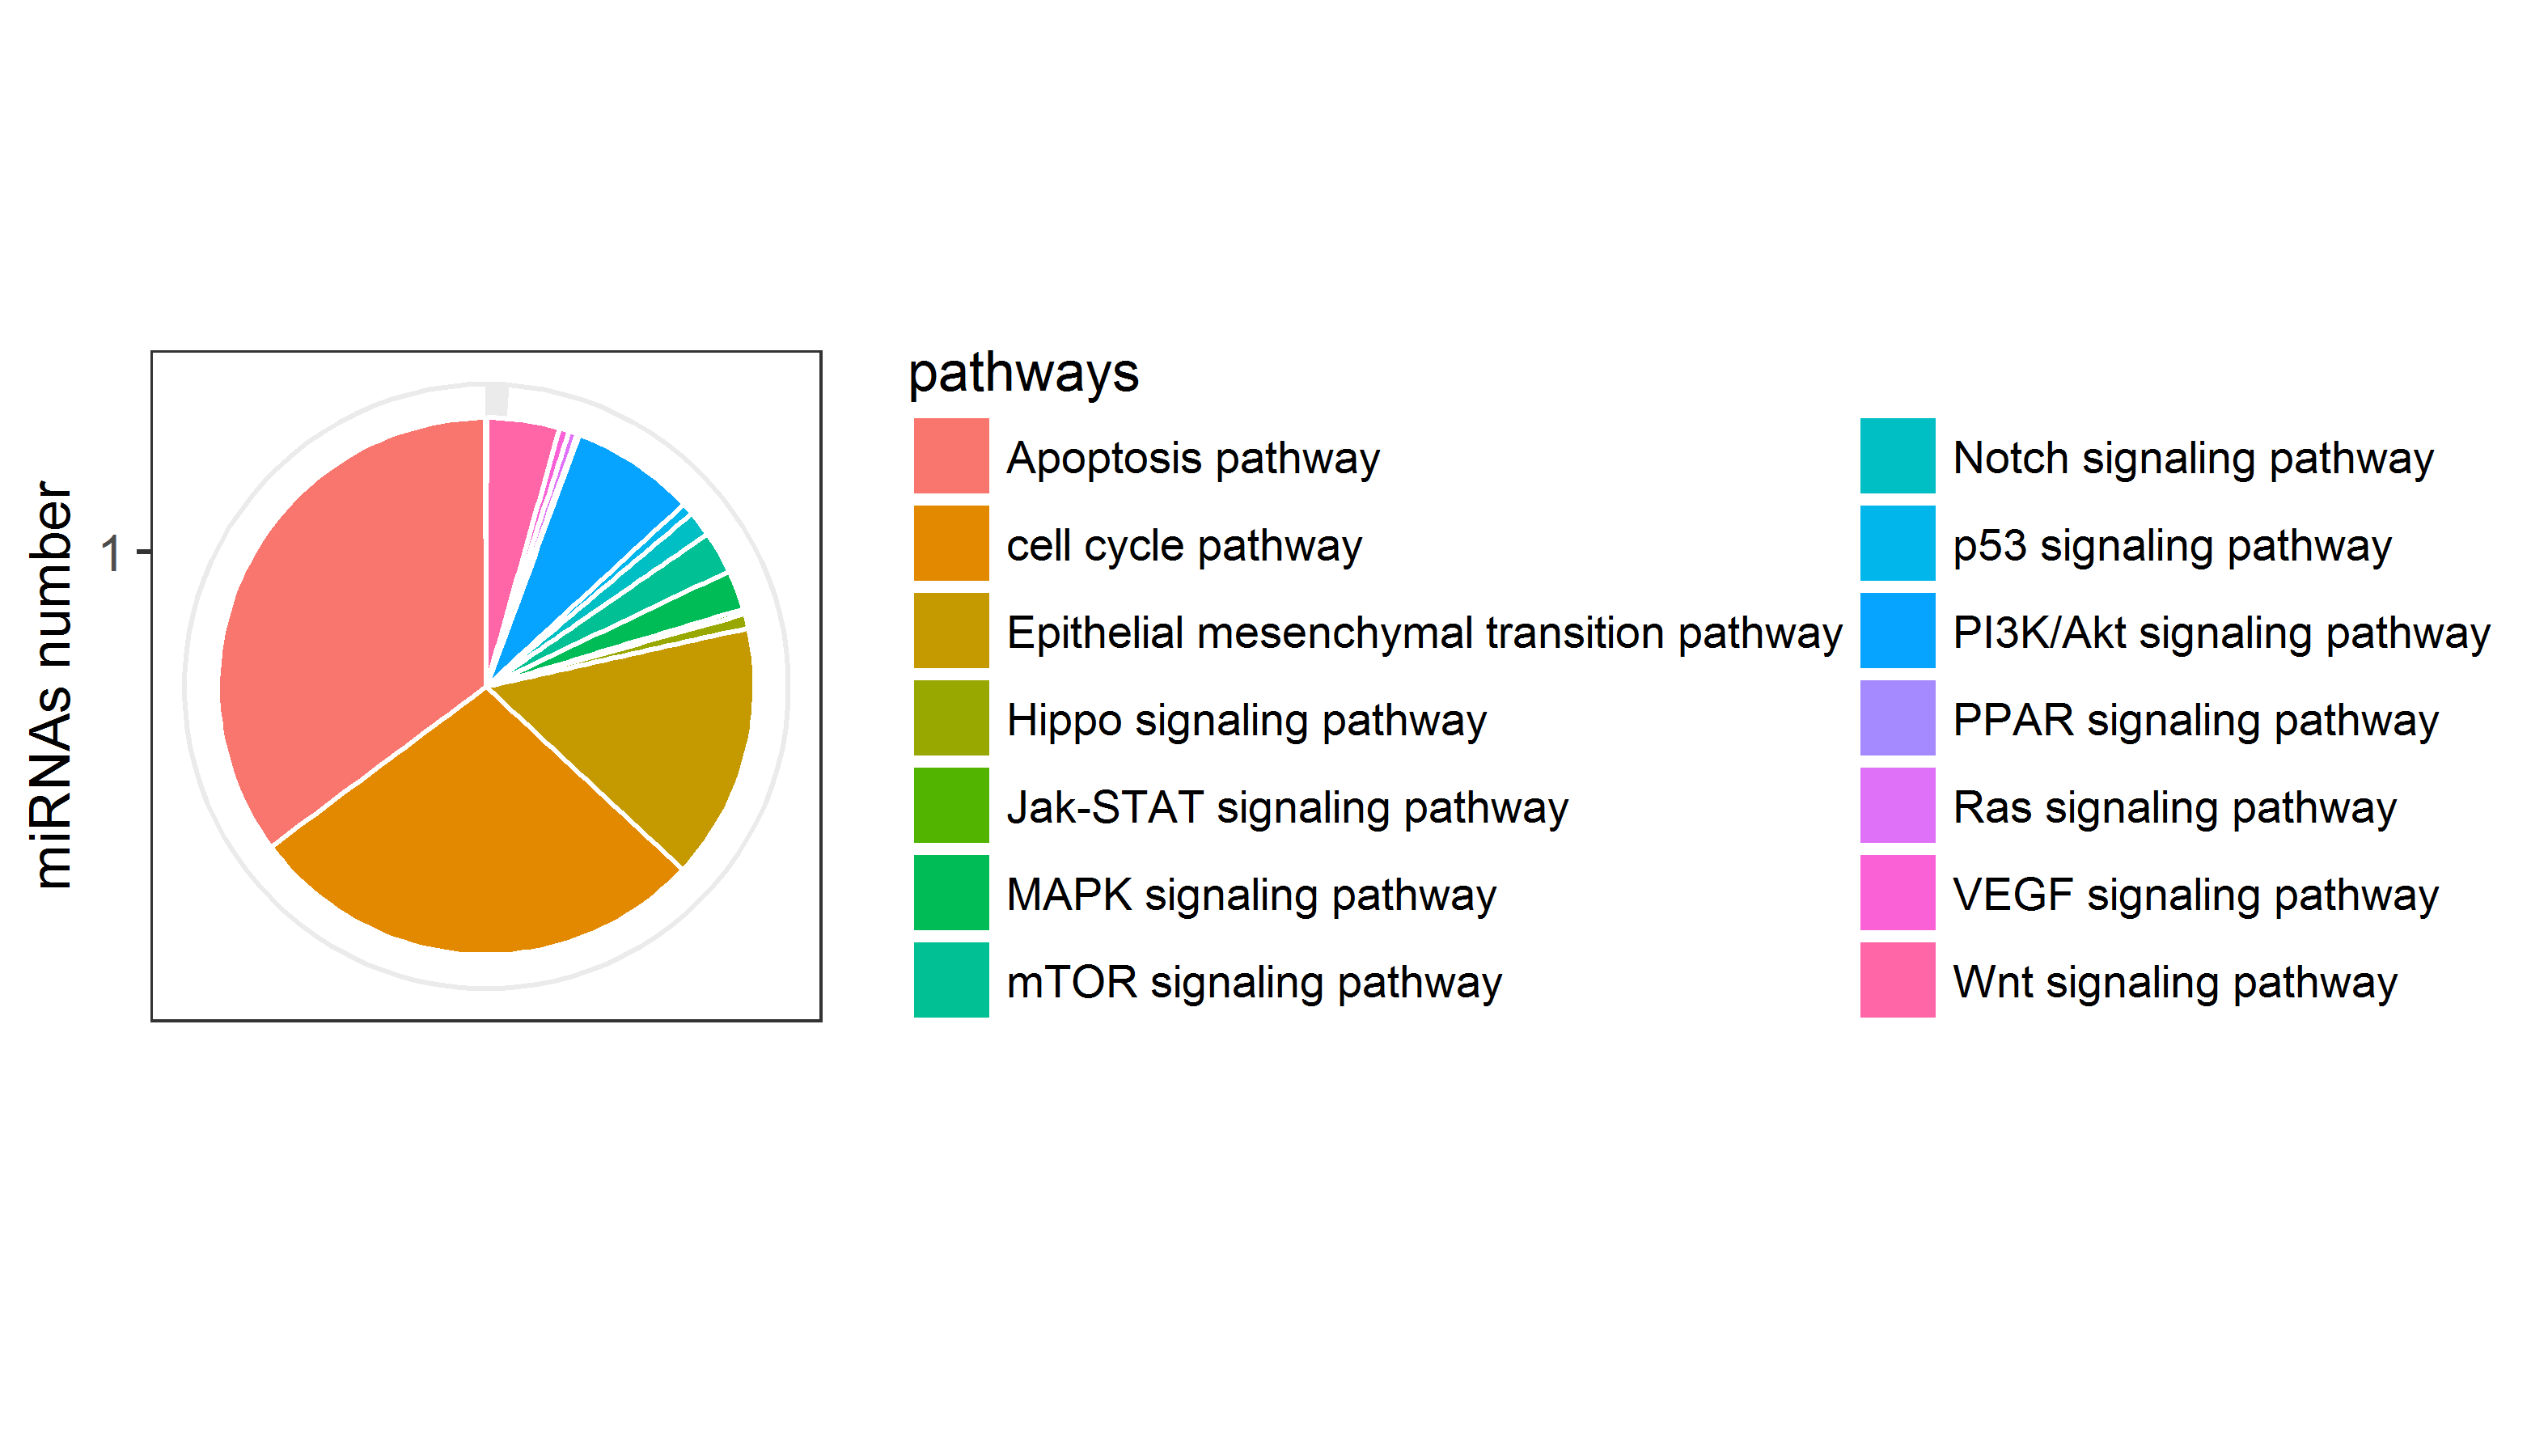
miRNAs number of the pathways included
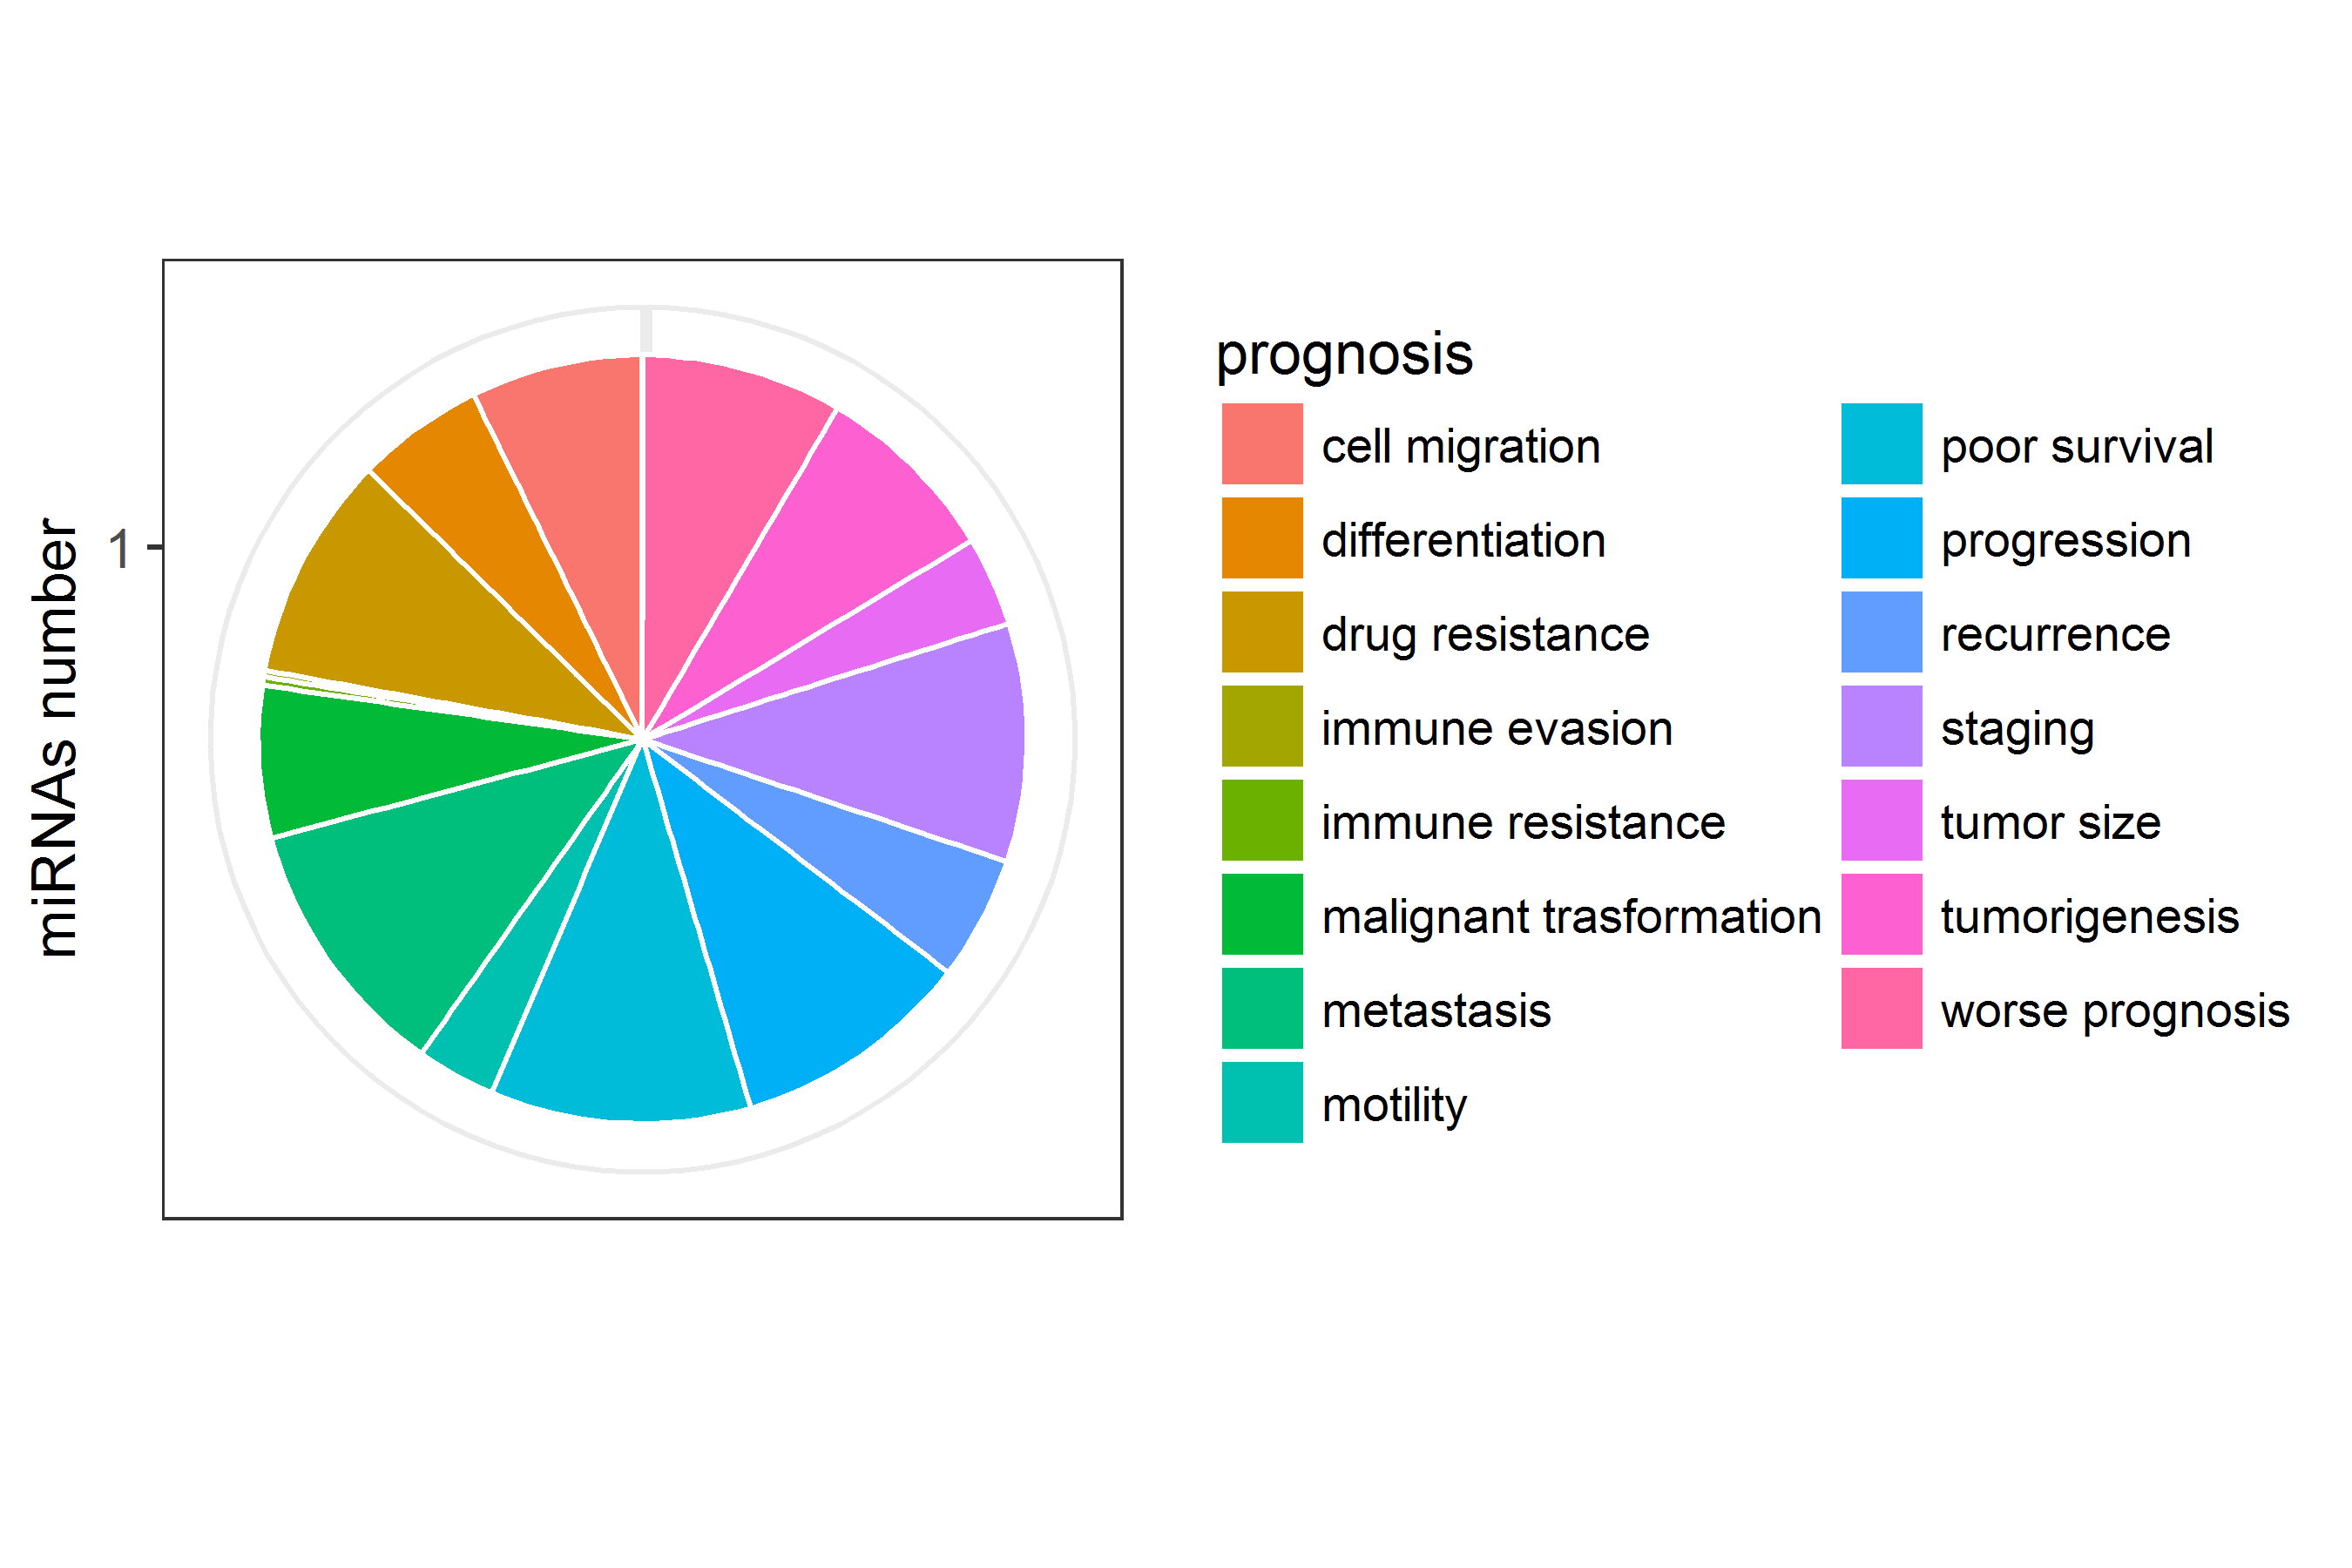
miRNAs number of the prognosis included
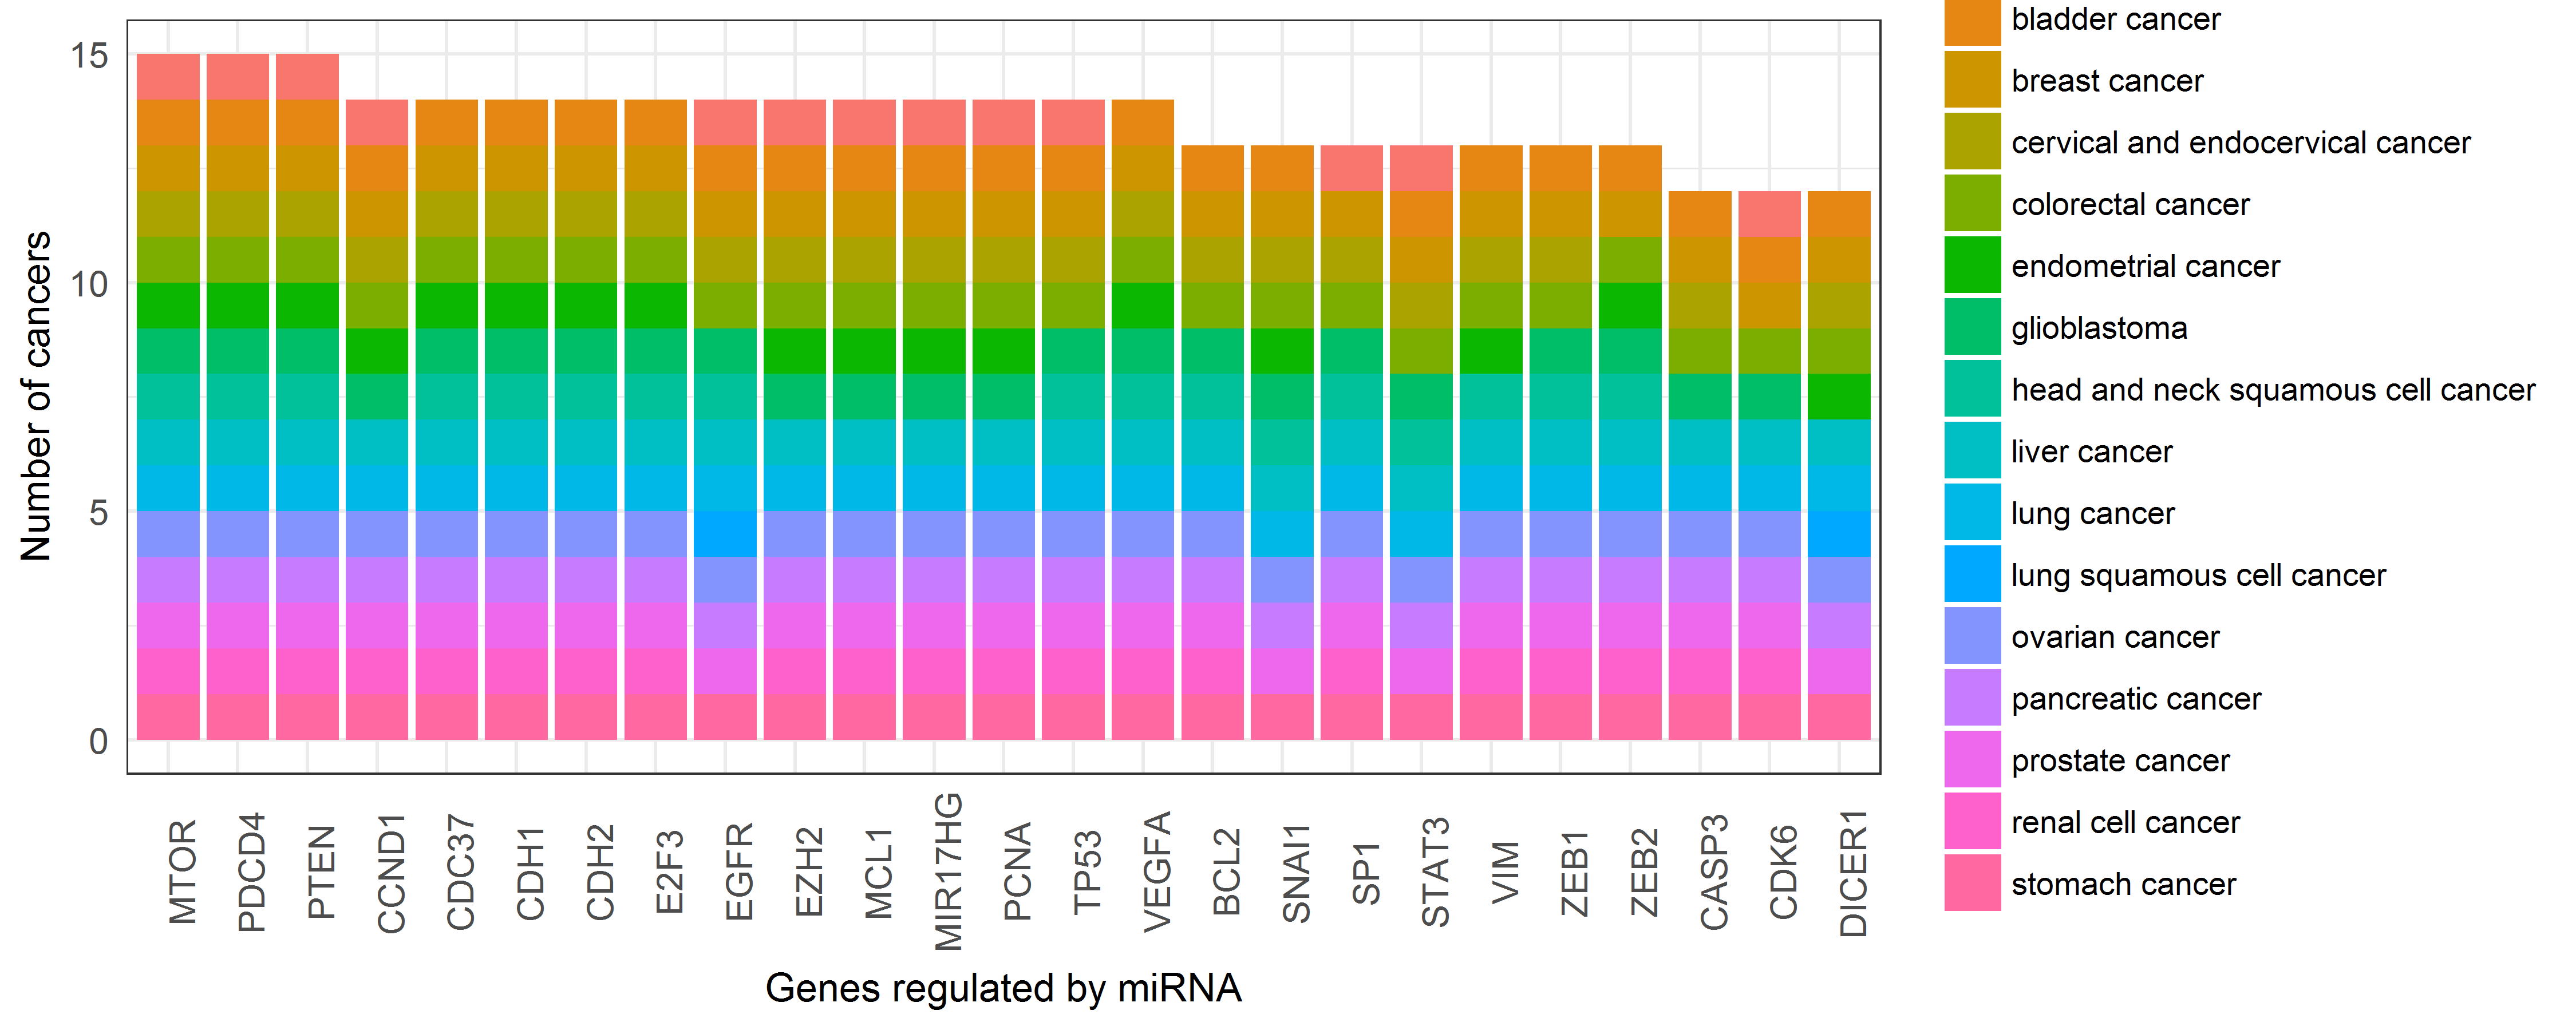
Genes regulated by miRNA included and their number of cancers