Browse BMI1 in pancancer

Summary
SymbolBMI1
NameBMI1 proto-oncogene, polycomb ring finger
Aliases RNF51; PCGF4; polycomb group ring finger 4; B lymphoma Mo-MLV insertion region 1 homolog (mouse); FLVI2/BMI1 ......
Location10p12.2
External Links HGNC, NCBI, Ensembl, Uniprot, GeneCards
Cancer Gene Databases ONGene (Oncogene) , TSGene (Tumor suppressor gene) , NCG (Network of Cancer Genes)
Content > Domain, Function and Classification
> Gene Ontology
> KEGG and Reactome Pathway
> Domain, Function and Classification
 
Domain PF16207 RAWUL domain RING finger- and WD40-associated ubiquitin-like
Function

Component of a Polycomb group (PcG) multiprotein PRC1-like complex, a complex class required to maintain the transcriptionally repressive state of many genes, including Hox genes, throughout development. PcG PRC1 complex acts via chromatin remodeling and modification of histones; it mediates monoubiquitination of histone H2A 'Lys-119', rendering chromatin heritably changed in its expressibility. In the PRC1 complex, it is required to stimulate the E3 ubiquitin-protein ligase activity of RNF2/RING2.

Classification
Class Modification Substrate Product PubMed
Polycomb group (PcG) protein # # # 15386022
> Gene Ontology
 
Biological Process GO:0003002 regionalization
GO:0007379 segment specification
GO:0007389 pattern specification process
GO:0016925 protein sumoylation
GO:0018205 peptidyl-lysine modification
GO:0031396 regulation of protein ubiquitination
GO:0031398 positive regulation of protein ubiquitination
GO:0035282 segmentation
GO:0040029 regulation of gene expression, epigenetic
GO:0045814 negative regulation of gene expression, epigenetic
GO:0048144 fibroblast proliferation
GO:0048145 regulation of fibroblast proliferation
GO:0048146 positive regulation of fibroblast proliferation
GO:0051438 regulation of ubiquitin-protein transferase activity
GO:0051443 positive regulation of ubiquitin-protein transferase activity
GO:1903320 regulation of protein modification by small protein conjugation or removal
GO:1903322 positive regulation of protein modification by small protein conjugation or removal
Molecular Function GO:0003682 chromatin binding
GO:0071535 RING-like zinc finger domain binding
GO:1990841 promoter-specific chromatin binding
Cellular Component GO:0000151 ubiquitin ligase complex
GO:0000152 nuclear ubiquitin ligase complex
GO:0031519 PcG protein complex
GO:0035102 PRC1 complex
> KEGG and Reactome Pathway
 
KEGG hsa04550 Signaling pathways regulating pluripotency of stem cells
Reactome R-HSA-2559583: Cellular Senescence
R-HSA-2262752: Cellular responses to stress
R-HSA-392499: Metabolism of proteins
R-HSA-2559580: Oxidative Stress Induced Senescence
R-HSA-597592: Post-translational protein modification
R-HSA-3108232: SUMO E3 ligases SUMOylate target proteins
R-HSA-2990846: SUMOylation
R-HSA-3108214: SUMOylation of DNA damage response and repair proteins
R-HSA-4570464: SUMOylation of RNA binding proteins
Summary
SymbolBMI1
NameBMI1 proto-oncogene, polycomb ring finger
Aliases RNF51; PCGF4; polycomb group ring finger 4; B lymphoma Mo-MLV insertion region 1 homolog (mouse); FLVI2/BMI1 ......
Location10p12.2
External Links HGNC, NCBI, Ensembl, Uniprot, GeneCards
Cancer Gene Databases ONGene (Oncogene) , TSGene (Tumor suppressor gene) , NCG (Network of Cancer Genes)
Content > Mutation landscape in primary tumor tissue from TCGA
> Mutation landscape in cancer cell line from CCLE
> All mutations from COSMIC database V81
> Variations from text mining
> The Cancer Genome Atlas (TCGA)
 
> Cancer Cell Line Encyclopedia (CCLE)
 
> Catalogue of Somatic Mutations in Cancer (COSMIC)
 
COSMIC ID CDS change AA change Mutation Type Anatomical Site
COSM3436549c.832C>Tp.P278SSubstitution - MissenseSkin
COSM2133116c.596C>Ap.P199HSubstitution - MissenseLarge_intestine
COSM3436548c.686C>Tp.P229LSubstitution - MissenseSkin
COSM5642975c.586G>Tp.E196*Substitution - NonsenseOesophagus
COSM5910677c.304C>Tp.P102SSubstitution - MissenseSkin
COSM5631683c.862C>Tp.H288YSubstitution - MissenseOesophagus
COSM2133114c.429G>Tp.L143FSubstitution - MissenseLarge_intestine
COSM1195035c.766G>Tp.D256YSubstitution - MissenseLung
COSM2152987c.552C>Tp.D184DSubstitution - coding silentCentral_nervous_system
COSM268754c.98A>Tp.E33VSubstitution - MissenseLarge_intestine
COSM4013334c.415G>Ap.D139NSubstitution - MissenseBreast
COSM4934766c.722A>Gp.D241GSubstitution - MissenseLiver
COSM1474555c.846T>Gp.P282PSubstitution - coding silentBreast
COSM5962906c.839A>Cp.Q280PSubstitution - MissenseBreast
COSM5753450c.930T>Gp.N310KSubstitution - MissenseLarge_intestine
COSM4952833c.589G>Cp.E197QSubstitution - MissenseLiver
COSM4959727c.761G>Ap.G254ESubstitution - MissenseLiver
COSM3966997c.744A>Gp.E248ESubstitution - coding silentCentral_nervous_system
COSM3436547c.133C>Tp.R45CSubstitution - MissenseSkin
COSM3397045c.156T>Gp.Y52*Substitution - NonsenseCentral_nervous_system
COSM3382811c.361G>Ap.D121NSubstitution - MissensePancreas
COSM4838639c.337G>Cp.D113HSubstitution - MissenseCervix
COSM4013336c.649A>Tp.R217WSubstitution - MissenseStomach
COSM1603318c.249T>Ap.V83VSubstitution - coding silentLiver
COSM1184753c.821G>Ap.S274NSubstitution - MissenseLarge_intestine
COSM1195035c.766G>Tp.D256YSubstitution - MissenseLung
COSM5753450c.930T>Gp.N310KSubstitution - MissenseLarge_intestine
COSM4952833c.589G>Cp.E197QSubstitution - MissenseLiver
COSM1184755c.187A>Gp.T63ASubstitution - MissenseLarge_intestine
COSM4674144c.411C>Ap.F137LSubstitution - MissenseLarge_intestine
COSM458855c.742G>Ap.E248KSubstitution - MissenseLarge_intestine
COSM2152987c.552C>Tp.D184DSubstitution - coding silentCentral_nervous_system
COSM4846250c.847C>Tp.H283YSubstitution - MissenseCervix
COSM917041c.938G>Ap.R313QSubstitution - MissenseEndometrium
COSM296072c.221C>Gp.T74SSubstitution - MissenseLarge_intestine
COSM1627436c.844C>Tp.P282SSubstitution - MissenseLiver
COSM4751165c.781C>Tp.P261SSubstitution - MissenseStomach
COSM1184754c.418C>Ap.Q140KSubstitution - MissenseLarge_intestine
COSM5753450c.930T>Gp.N310KSubstitution - MissenseLarge_intestine
COSM2133118c.683G>Ap.R228QSubstitution - MissenseLarge_intestine
COSM4942436c.618A>Gp.L206LSubstitution - coding silentLiver
COSM4959727c.761G>Ap.G254ESubstitution - MissenseLiver
COSM3436547c.133C>Tp.R45CSubstitution - MissenseBreast
COSM1737163c.571-1G>Ap.?UnknownCentral_nervous_system
COSM917039c.766G>Ap.D256NSubstitution - MissenseEndometrium
COSM1627436c.844C>Tp.P282SSubstitution - MissenseLiver
COSM3414907c.433C>Tp.R145WSubstitution - MissenseLarge_intestine
COSM917038c.111C>Ap.S37SSubstitution - coding silentEndometrium
COSM415071c.329C>Gp.S110CSubstitution - MissenseUrinary_tract
COSM5435273c.382G>Ap.D128NSubstitution - MissenseOesophagus
COSM4013334c.415G>Ap.D139NSubstitution - MissenseStomach
COSM3866992c.406G>Ap.E136KSubstitution - MissenseSkin
COSM3699883c.317-3T>Cp.?UnknownLiver
COSM5647241c.167G>Cp.C56SSubstitution - MissenseOesophagus
COSM917040c.837G>Ap.V279VSubstitution - coding silentEndometrium
COSM4674144c.411C>Ap.F137LSubstitution - MissenseLarge_intestine
COSM1603318c.249T>Ap.V83VSubstitution - coding silentLiver
COSM4013335c.568C>Gp.Q190ESubstitution - MissenseStomach
COSM427389c.229G>Cp.D77HSubstitution - MissenseBreast
COSM4013337c.773C>Tp.A258VSubstitution - MissenseStomach
COSM3769092c.858T>Cp.F286FSubstitution - coding silentPancreas
COSM3397044c.102T>Gp.C34WSubstitution - MissenseCentral_nervous_system
COSM458855c.742G>Ap.E248KSubstitution - MissenseLarge_intestine
COSM1246137c.674A>Gp.Y225CSubstitution - MissenseOesophagus
COSM3414907c.433C>Tp.R145WSubstitution - MissenseSkin
COSM4674145c.927C>Ap.A309ASubstitution - coding silentLarge_intestine
COSM3436547c.133C>Tp.R45CSubstitution - MissenseSkin
COSM4674146c.935C>Ap.P312HSubstitution - MissenseLarge_intestine
COSM3731605c.574G>Cp.D192HSubstitution - MissenseStomach
COSM4573546c.186G>Tp.K62NSubstitution - MissenseBone
COSM108646c.944C>Tp.S315LSubstitution - MissenseSkin
COSM5713512c.451_452delAAp.K151fs*4Deletion - FrameshiftHaematopoietic_and_lymphoid_tissue
COSM5753450c.930T>Gp.N310KSubstitution - MissenseLarge_intestine
COSM136774c.782C>Tp.P261LSubstitution - MissenseSkin
COSM3985556c.756C>Gp.D252ESubstitution - MissenseKidney
COSM1297171c.212C>Gp.S71*Substitution - NonsenseUrinary_tract
COSM1579153c.971C>Ap.S324YSubstitution - MissenseBreast
COSM683635c.15G>Tp.T5TSubstitution - coding silentLung
COSM458855c.742G>Ap.E248KSubstitution - MissenseCervix
COSM5798393c.268G>Ap.E90KSubstitution - MissenseBreast
COSM335302c.554T>Cp.I185TSubstitution - MissenseLung
COSM1187905c.43C>Tp.H15YSubstitution - MissenseLung
COSM77340c.86C>Ap.T29KSubstitution - MissenseOvary
> Text Mining based Variations
 
PMID Variation Cancer Evidence
26109429mutationColorectal CarcinomaTen significantly mutated genes, including BMI1, CARD11, and NRG1, were found in 34 CRCs with CLMs.
23603912mutationT Acute Lymphoblastic LeukemiaIn addition to mutations in genes known to be involved in leukemogenesis (ETV6, NOTCH1, JAK1, and NF1), we identified novel recurrent mutations in FAT1 (25%), FAT3 (20%), DNM2 (35%), and genes associated with epigenetic regulation (MLL2, BMI1, and DNMT3A).
Summary
SymbolBMI1
NameBMI1 proto-oncogene, polycomb ring finger
Aliases RNF51; PCGF4; polycomb group ring finger 4; B lymphoma Mo-MLV insertion region 1 homolog (mouse); FLVI2/BMI1 ......
Location10p12.2
External Links HGNC, NCBI, Ensembl, Uniprot, GeneCards
Cancer Gene Databases ONGene (Oncogene) , TSGene (Tumor suppressor gene) , NCG (Network of Cancer Genes)
Content > Post-translational modification (PTM)
> Post-translational modification (PTM)
 
There is no PTM data
Summary
SymbolBMI1
NameBMI1 proto-oncogene, polycomb ring finger
Aliases RNF51; PCGF4; polycomb group ring finger 4; B lymphoma Mo-MLV insertion region 1 homolog (mouse); FLVI2/BMI1 ......
Location10p12.2
External Links HGNC, NCBI, Ensembl, Uniprot, GeneCards
Cancer Gene Databases ONGene (Oncogene) , TSGene (Tumor suppressor gene) , NCG (Network of Cancer Genes)
Content > Expression analysis in primary tumor tissue from TCGA
> Expression level in cancer cell line from CCLE
> Expression level in human normal tissue from HPA
> Text mining based expression change
> The Cancer Genome Atlas (TCGA)


  Differential expression analysis for cancers with more than 10 normal samples
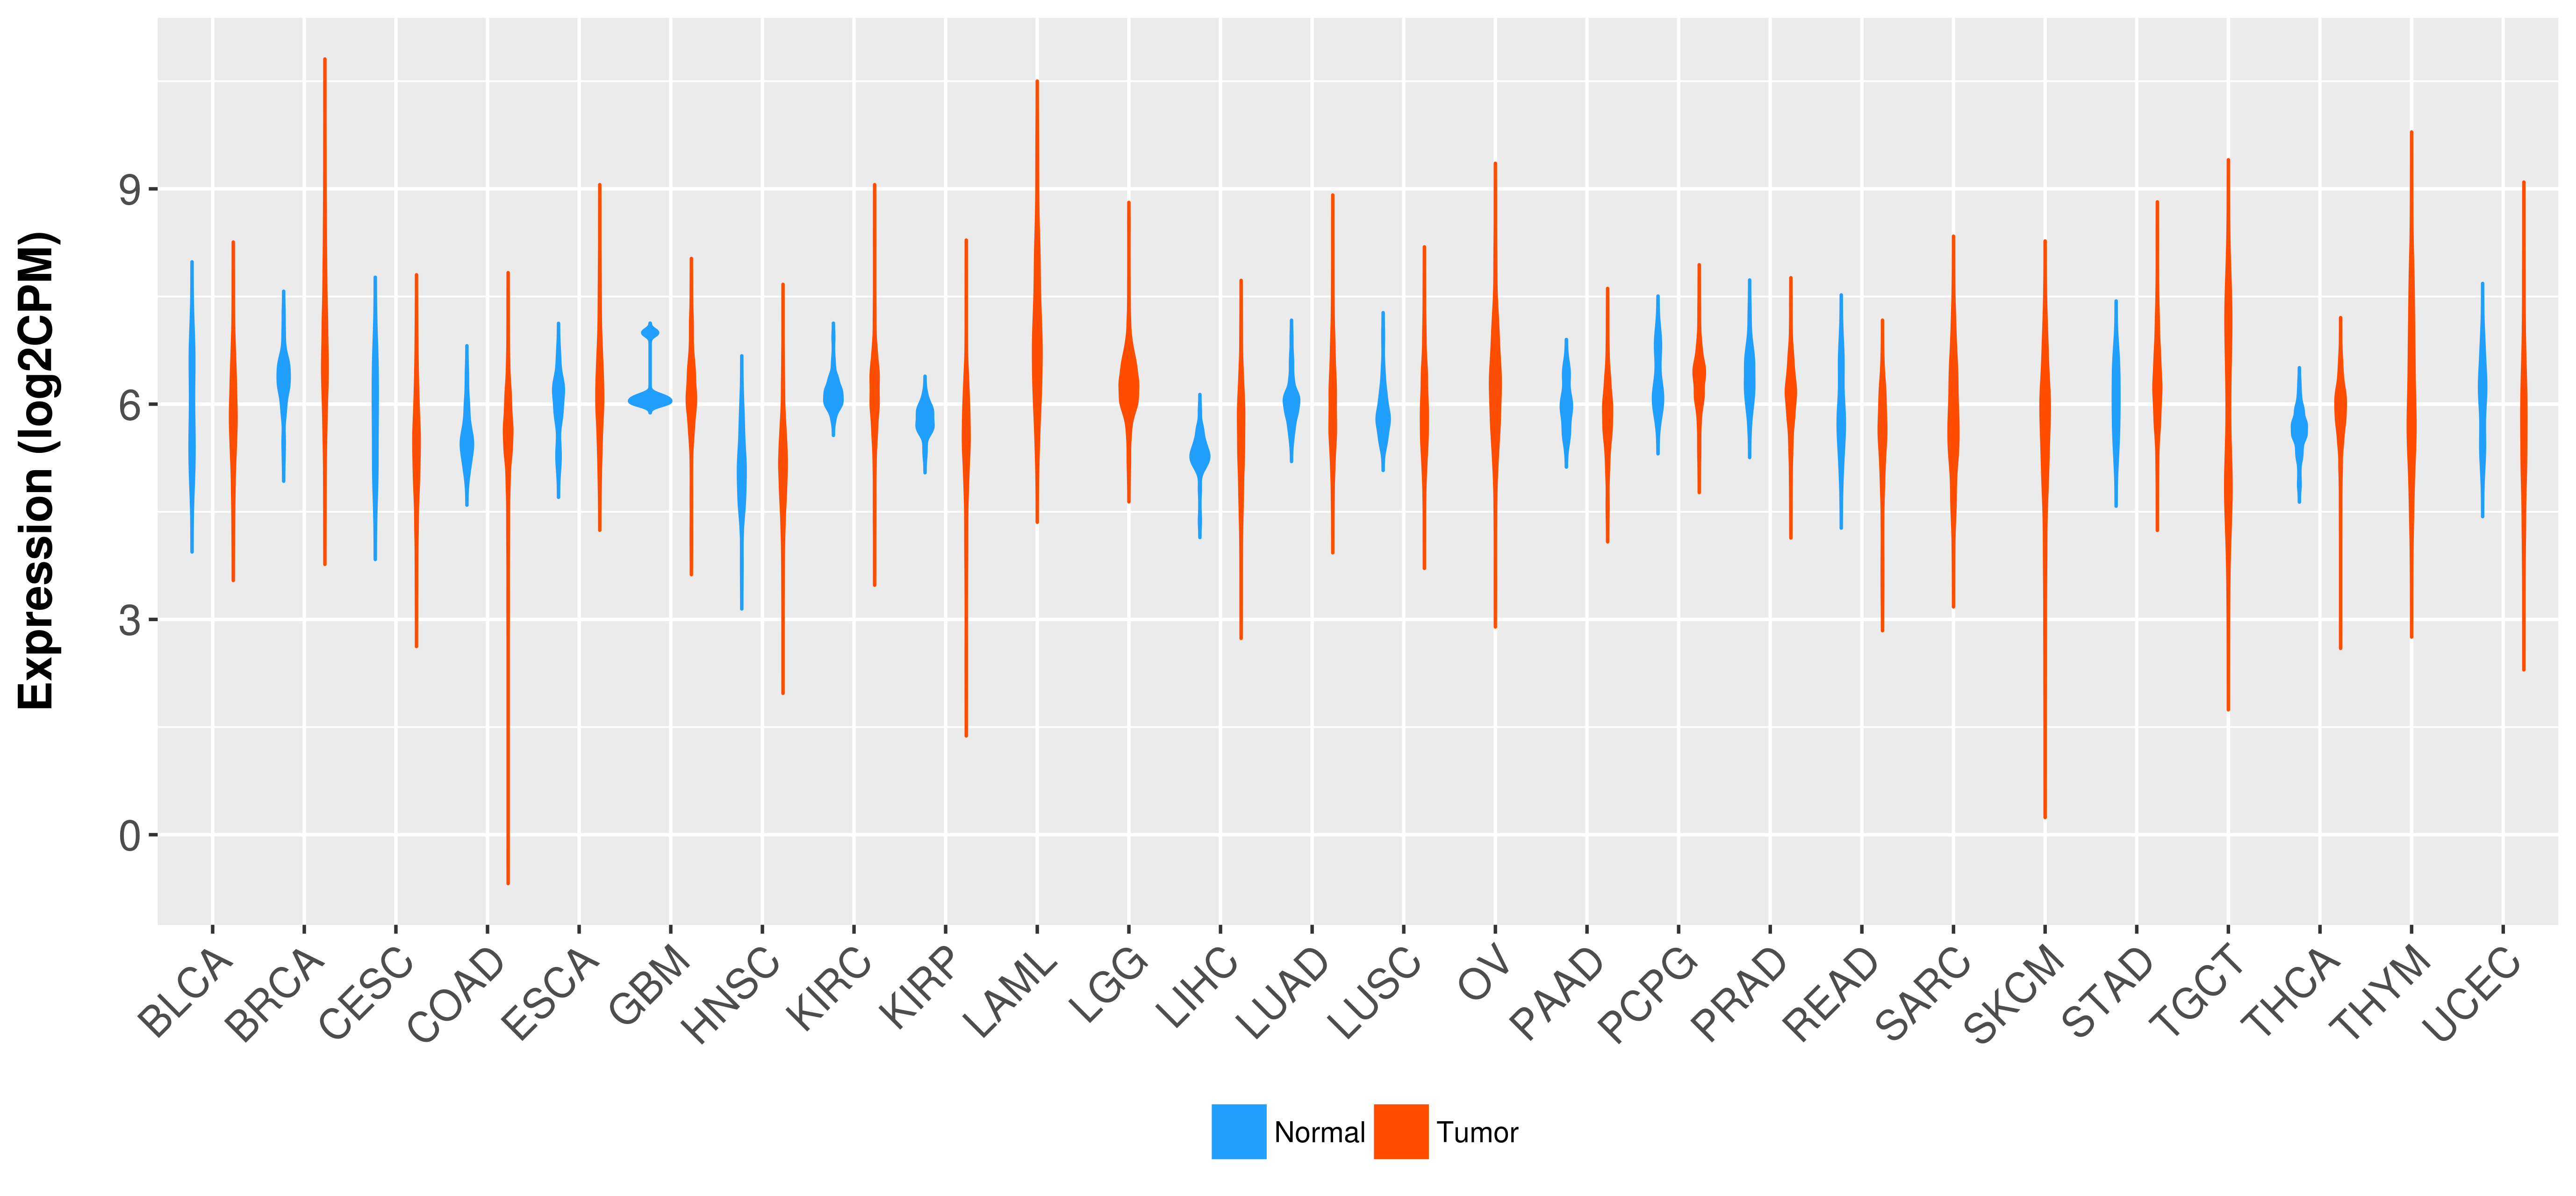
Cancer Full Name # N # T Median (N) Median (T) LogFC Adj. P Status
BLCABladder urothelial carcinoma194085.6565.85-0.0860.636NS
BRCABreast invasive carcinoma11211006.3626.660.4225.04e-07NS
CESCCervical and endocervical cancers33065.8695.442NANANA
COADColon adenocarcinoma414595.485.6210.0490.674NS
ESCAEsophageal carcinoma111856.1586.150.1940.453NS
GBMGlioblastoma multiforme51666.0746.137NANANA
HNSCHead and Neck squamous cell carcinoma445225.0655.1460.0310.778NS
KIRCKidney renal clear cell carcinoma725346.1276.144-0.0140.838NS
KIRPKidney renal papillary cell carcinoma322915.7965.549-0.3120.0222NS
LAMLAcute Myeloid Leukemia0173NA6.851NANANA
LGGBrain Lower Grade Glioma0530NA6.262NANANA
LIHCLiver hepatocellular carcinoma503735.3125.5780.2060.0387NS
LUADLung adenocarcinoma595176.0155.955-0.0310.733NS
LUSCLung squamous cell carcinoma515015.8065.860.0310.726NS
OVOvarian serous cystadenocarcinoma0307NA6.236NANANA
PAADPancreatic adenocarcinoma41795.9795.849NANANA
PCPGPheochromocytoma and Paraganglioma31846.1646.366NANANA
PRADProstate adenocarcinoma524986.3516.132-0.2882.18e-05NS
READRectum adenocarcinoma101675.845.661-0.3530.133NS
SARCSarcoma22635.8445.784NANANA
SKCMSkin Cutaneous Melanoma14726.1925.78NANANA
STADStomach adenocarcinoma354156.0336.2620.2560.0115NS
TGCTTesticular Germ Cell Tumors0156NA5.912NANANA
THCAThyroid carcinoma595095.6755.9310.2628.51e-06NS
THYMThymoma21205.9256.01NANANA
UCECUterine Corpus Endometrial Carcinoma355466.1355.677-0.4020.00898NS
> Cancer Cell Line Encyclopedia (CCLE)
 

There is no record.
> The Human Protein Atlas (HPA)


Tissue Expression Level (TPM)
Adipose tissue 32.8
Adrenal gland 42.2
Appendix 35.9
Bone marrow 13.9
Breast 45.5
Cerebral cortex 49.3
Cervix, uterine 43
Colon 26.3
Duodenum 21
Endometrium 53
Epididymis 36.8
Esophagus 24.8
Fallopian tube 37.4
Gallbladder 38.7
Heart muscle 14.2
Kidney 28.3
Liver 18.8
Lung 35.9
Lymph node 33
Ovary 27.3
Pancreas 5.6
Parathyroid gland 84.7
Placenta 42.2
Prostate 53.8
Rectum 24.8
Salivary gland 9
Seminal vesicle 37.1
Skeletal muscle 15.9
Skin 17.7
Small intestine 23.9
Smooth muscle 53.4
Spleen 52
Stomach 21.4
Testis 66.8
Thyroid gland 41
Tonsil 26.5
Urinary bladder 29.7
> Text Mining based Expression
 
PMID Expression Cancer Evidence
26693053overexpressionHepatocellular CarcinomaFurthermore, Immunohistochemical staining revealed that the expression levels of CBX8 (in 53/123 samples) and BMI1 (in 60/130 samples) were markedly increased in human HCC specimens.
27131799overexpressionSalivary Gland Mucoepidermoid CarcinomaIn MEC, CD44 and Bmi1 showed strong expression in all types of neoplastic cells and both markers revealed intense expression in tumour invasive front.
27131799overexpressionSalivary Gland Mucoepidermoid CarcinomaThe stem cell markers CD44, Bmi1, Oct4 and Nanog are frequently expressed in MEC in relation to normal salivary gland and Oct4 and Nanog expression may contribute to aggressiveness and worst prognosis in MEC patients.
27718152underexpressionSkin Basal Cell CarcinomaWe demonstrate downregulation of BMI1 mRNA expression in BCC samples compared with controls (p=0.0001), SCC (p=0.001), and melanoma (p=0.0001) samples.
27612478overexpressionLip and Oral Cavity CarcinomaThese tumors exhibited increased expression of CSC markers (CD44v3, CD44v6, Nanog, and Bmi1) and significantly reduced expression of PTEN and ATM in OSCC patients.
27166996overexpressionGastric CarcinomaWe additionally found that decreased miR-338-5p expression in GC tissues, relative to normal tissues, was significantly negatively correlated with increased BMI1 expression.
26935956overexpressionPlasma Cell MyelomaThe polycomb complex protein BMI-1 (BMI-1) is a putative oncogene reported to be overexpressed in multiple myeloma (MM).
26919246overexpressionHepatocellular CarcinomaBy contrast, BMI1 was significantly overexpressed in 66.7% of HCC tissues.
26690524overexpressionGlioblastomaOverexpression of CD133 mRNA and BMI1 protein was found in 47.6 and 76.2% patients respectively and TP53 mutations was seen in 57.1% of patients in our study.There was no correlation among TP53 mutations and expressions of CD133 and BMI1.
26500029overexpressionBladder CarcinomaBMI1 was found to be overexpressed in most UC cell lines and primary tumors by quantitative real-time polymerase chain reaction and immunohistochemistry.
26137120overexpressionNon-Small Cell Lung CarcinomamiR-203 was demonstrated to act as a tumor suppressor by regulating the expression of Bmi1. miR-203 expression levels were downregulated in NSCLC tissues while Bmi1 expression was upregulated in NSCLC tissues and cell lines.
25999024overexpressionEsophageal Squamous Cell CarcinomaThe BMI1 mRNA expression levels were markedly increased and negatively correlated with the miR-218 expression level in the ESCC tissues.
25968877overexpressionGastric CarcinomaBut high Bmi1 expression was significantly correlated with the clinical stage (pooled OR=3.04, 95%CI=1.31-7.07, P=0.010, random effect), tumor size (pooled OR=2.01, 95%CI=1.14-3.55, P=0.016, random effect), T classification (pooled OR=2.79, 95%CI=1.94-4.03, P<0.001, fixed effect), lymph node metastasis (pooled OR=2.24, 95%CI=1.47-3.39, P<0.001, random effect) and distant metastasis (pooled OR=5.05, 95%CI=1.29-19.70, P=0.020, random effect), and led to a poor overall survival (OS) in GC patients (RR=3.38, 95%CI=2.43-4.69, P<0.001, fixed effect).
25858624overexpressionGliomaThe BMI1 mRNA in glioma was remarkably up-regulated, 176.3% as much as that in peri-cancerous tissues (P<0.05).
25826085underexpressionBreast CarcinomaExpression of CSC markers, ALDH1, BMI1 and Nanog was decreased.
25722013underexpressionParathyroid Gland NeoplasmImpaired expression of the histone methyltransferases EZH2, BMI1, and RIZ1 have been described in parathyroid tumors.
25526772overexpressionGliomaOur investigation revealed BMI1 over-expression in 29 of 54 (53.7%) pediatric gliomas, 8 of 8 (100%) patient derived orthotopic xenograft (PDOX) mouse models, and in both CD133+ and CD133- glioma cells.
25475727aberrant expressionMelanomaWe found significantly deregulation of miR-203 and up-regulation of BMI1 in melanoma, particularly in metastatic melanoma.
25471937overexpressionHead and Neck Squamous Cell CarcinomaPopulations of enriched CSC-like cells displayed decreased levels of pSMAD1/5/8 and BMP signaling target gene ID1 while SMURF1, CD44, and BMI1 were highly expressed when compared to non-CSC populations.
25348805overexpressionDuctal Breast Carcinoma In SituWe found Bmi1 overexpression in 64% of grade III invasive ductal breast adenocarcinomas compared to normal breast tissues.
25286028overexpressionTongue CarcinomaOur data revealed that Bmi1 was aberrantly overexpressed in a significant portion of tongue cancers.
25285018overexpressionOvarian CarcinomaIn univariate survival analysis of the ovarian carcinoma cohorts, a significant association of intensive expression of BMI1 and EZH2 in first-onset lymph node metastases with shortened PFS was demonstrated (P=0.010, P=0.019); and a significant association of intensive expression of BMI1 and EZH2 in recurrent tumors with shortened OS was demonstrated (P=0.042, P=0.047).
25084695overexpressionAcute Myeloid Leukemia; Chronic Myelogenous Leukemia, BCR-ABL1 PositiveThe results showed that the expression of BMI1 was significantly higher in AML and CML versus control subjects (p<0.001 for both).
25054051overexpressionColorectal CarcinomaBmi1 is overexpressed in gastrointestinal cancers, including colorectal cancer (CRC); however, its role as a non-invasive biomarker in CRC has not been established.
25013381overexpressionPancreatic Ductal AdenocarcinomaWe predicted Bmi1 may be a target of miR-135a using bioinformatics tools and found that Bmi1 expression was markedly up-regulated in PDAC.
24982332overexpressionHead and Neck Squamous Cell CarcinomaThe mRNA levels of CDK4, cyclin D1, gankyrin, SEI1, BMI1 were significantly elevated in both HARM and SCCHN (in comparison with control specimens), and statistically significant correlations were found among these markers in gene expression.
24909638overexpressionPancreatic Intraductal Papillary-Mucinous Neoplasm with High Grade Dysplasia; Pancreatic Intraductal Papillary-Mucinous Neoplasm with an Associated Invasive CarcinomaPositive expression of Twist and Bmi1 was observed in 40.0% and 42.9% of IPMNs, respectively. Twist and Bmi1 expression was significantly higher in IPMNs with high-grade dysplasia (P<0.05) and invasive carcinoma (P<0.05) than that in IPMNs with low-grade dysplasia.
24719948overexpressionHepatocellular Carcinoma with Bile Duct Tumor ThrombiImmunohistochemical staining for Bmi1 showed Bmi1 was highly expressed in the B+ group in comparison with the C+ group and the V+ group, respectively.
24375660overexpressionThymic LymphomaFurthermore, the BMI1 expression level was up-regulated and inversely correlated with miR-200c in RITL samples.
24337040overexpressionBladder CarcinomaThe mRNA expression of Bmi1 was upregulated in SP cells when compared with that in the NSP cells.
24312366overexpressionMalignant Digestive System NeoplasmBmi1 is overexpressed in a variety of human cancers including gastrointestinal cancer.
24302590overexpressionHead and Neck Squamous Cell CarcinomaMoreover, BMI1 was highly expressed in both SCCHN and HARM, and BMI1 overexpression was associated with p16 downregulation in SCCHN (P<0.05).
24139839overexpressionGliomaBoth Bmi1 and EZH2 expressions in glioma tissues were significantly higher than those in corresponding nonneoplastic brain tissues (both P<0.001).
24122997overexpressionOral Squamous Cell CarcinomaEZH2 and BMI1 protein were up-regulated in OSCC tissues compared with epithelial dysplasia and normal epithelium.
23873108underexpressionDuctal Breast Carcinoma In SituBMI1 gene was co-regulated (down) with PR in the invasive ductal breast carcinoma with relative progression explicating it a diagnostic biomarker for ductal carcinoma of the breast.
23864317aberrant expressionNon-Small Cell Lung CarcinomaBmi1 was expressed in 78/80 (97.5%) cases of non-small-cell lung cancer and correlated with male gender and expression of Gli1.
23686310aberrant expressionMantle Cell LymphomaIn this study, we show that recurrent MCL cases significantly exhibit upregulation of BMI1/Bmi1.
23639414overexpressionOral Squamous Cell CarcinomaThe results showed that Bmi1 expression was observed in 32 (36.8%) of 87 cases of nonprogressing OLP and in 8 (88.9%) of 9 cases of progressing OLP. Bmi1 was not expressed in normal oral mucosa, but it was positively expressed in the 6 (100%) cases of OSCC.
23471304overexpressionMyelodysplastic SyndromeBMI1 overexpression was observed in CD34(+) cells from the majority of MDS patients with RUNX1 mutations, but not in D171N-transduced human CD34(+) cells.
23437065overexpressionPancreatic CarcinomaBmi1 was overexpressed in human PanINs, pancreatic cancers, and in several pancreatic cancer cell lines.
23138990overexpressionHepatocellular CarcinomaWe found that Bmi1 was much more highly expressed in HCC tissue compared to normal liver tissue.
23132836overexpressionMalignant GliomaBmi1, a key component of the Polycomb Repressive Complex 1, is highly expressed in undifferentiated neural stem cells (NSC) as well as in several human cancers including high-grade gliomas--highly aggressive brain tumors.
23046527aberrant expressionEsophageal Squamous Cell CarcinomaAmong 78 ESCC patients, 24 patients (30.8%) showed BMI1 positivity, mainly localised in the nuclei of tumour cells.
22766604overexpressionEsophageal Squamous Cell CarcinomaBmi1 and EZH2 were more highly expressed in tumor than in adjacent normal tissue (p<0.001).
22730165overexpressionLaryngeal Squamous Cell CarcinomaHigh BMI1 expression was detected in 11.7% of glottic tumors and in 50% of supraglottic tumors.
22574128overexpressionPituitary Gland AdenomaHuman pituitary adenomas show Bmi1 overexpression in over 50% of the cases, which indicates that Bmi1 could be causally involved in formation of these tumors similarly as in our mouse model.
22265735aberrant expressionGlioblastomaWe find that Bmi1 expression is increased in CD133- cells, and Bmi1 protein and transcript expression are highest during intermediate stages of differentiation as CD133+ BTICs lose their CD133 expression.
22120066overexpressionMyelodysplastic SyndromeIn this study, we reported that overexpression of BMI1 protein was detected in MDS patients, and inversely correlated with the apoptosis of CD34+ cells.
21866458overexpressionColorectal CarcinomaThe positive rate of Bmi1 expression in colorectal cancer tissues was 56.5%(48/85), significantly higher than that in the adjacent noncancerous tissues[17.6%(15/85), P<0.05)].
21856782overexpressionNeuroblastomaThe BMI1 gene is overexpressed in ≈ 90% of human neuroblastomas.
21755556aberrant expressionLaryngeal Squamous Cell CarcinomaBMI1 was highly enriched in CD133+ cells.
21482478overexpressionLaryngeal Squamous Cell CarcinomaBMI1 was highly expressed in laryngeal SCCs.
21165554aberrant expressionEsophageal Squamous Cell CarcinomaAberrant EZH2 and BMI1 protein expression was observed in 19 (14.0%) and 23 (16.9%), respectively, of the 136 ESCCs.
20600931overexpressionMedulloblastomaOverexpression of Bmi1 has been described in medulloblastoma, highly aggressive brain neoplasms of childhood, which are thought to originate from deregulated proliferation of granule cell precursors.
20426791overexpressionPancreatic CarcinomaIn the present study, we demonstrated that expression of BMI1 was markedly up-regulated in pancreatic cancer cell lines and surgically resected cancer specimens.
20170541overexpressionGastric CarcinomaBMI1 was found to be overexpressed in gastric cancer cell lines and gastric tumors.
27900059overexpressionSquamous Cell Lung CarcinomaHigh BMI1 expression was more frequent in SCC compared with that in AD (P=0.015).
Summary
SymbolBMI1
NameBMI1 proto-oncogene, polycomb ring finger
Aliases RNF51; PCGF4; polycomb group ring finger 4; B lymphoma Mo-MLV insertion region 1 homolog (mouse); FLVI2/BMI1 ......
Location10p12.2
External Links HGNC, NCBI, Ensembl, Uniprot, GeneCards
Cancer Gene Databases ONGene (Oncogene) , TSGene (Tumor suppressor gene) , NCG (Network of Cancer Genes)
Content > Somatic copy number alteration in primary tomur tissue
> The Cancer Genome Atlas (TCGA)


  Correlation between expression and SCNA as well as percentage of patients in different status.
Cancer Full Name # Sample R P % Loss % Neutral % Gain Status
BLCABladder urothelial carcinoma4040.4125.18e-1815.353.531.2Neutral
BRCABreast invasive carcinoma10750.0230.45712.763.224.1Neutral
CESCCervical and endocervical cancers2920.3441.5e-0922.667.89.6Neutral
COADColon adenocarcinoma4490.2583e-0816.374.88.9Neutral
ESCAEsophageal carcinoma1830.4779.14e-1226.84726.2Neutral
GBMGlioblastoma multiforme1470.3645.7e-0687.110.92Loss
HNSCHead and Neck squamous cell carcinoma5140.3922.28e-2032.5589.5Neutral
KIRCKidney renal clear cell carcinoma5250.1620.00019212.484.82.9Neutral
KIRPKidney renal papillary cell carcinoma2880.2831.05e-065.291.73.1Neutral
LAMLAcute Myeloid Leukemia1660.1050.1790.697.61.8Neutral
LGGBrain Lower Grade Glioma5130.4692.21e-2915.872.112.1Neutral
LIHCLiver hepatocellular carcinoma3640.3176.21e-109.172.818.1Neutral
LUADLung adenocarcinoma5120.251.03e-0821.354.923.8Neutral
LUSCLung squamous cell carcinoma4980.4813.59e-3041.440.218.5Loss
OVOvarian serous cystadenocarcinoma3000.3996.7e-131247.740.3Gain
PAADPancreatic adenocarcinoma1770.1440.056219.2746.8Neutral
PCPGPheochromocytoma and Paraganglioma1620.3961.79e-070.692.66.8Neutral
PRADProstate adenocarcinoma4910.1863.31e-05987.43.7Neutral
READRectum adenocarcinoma1640.1230.11718.9756.1Neutral
SARCSarcoma2550.3784.36e-1043.545.111.4Loss
SKCMSkin Cutaneous Melanoma3670.339.09e-1152.642.84.6Loss
STADStomach adenocarcinoma4130.3873.56e-1615.361.323.5Neutral
TGCTTesticular Germ Cell Tumors1500.4246.23e-085243.34.7Loss
THCAThyroid carcinoma4970.1010.02411.298.40.4Neutral
THYMThymoma119-0.0110.9081.796.61.7Neutral
UCECUterine Corpus Endometrial Carcinoma5370.2532.64e-097.169.323.6Neutral
Summary
SymbolBMI1
NameBMI1 proto-oncogene, polycomb ring finger
Aliases RNF51; PCGF4; polycomb group ring finger 4; B lymphoma Mo-MLV insertion region 1 homolog (mouse); FLVI2/BMI1 ......
Location10p12.2
External Links HGNC, NCBI, Ensembl, Uniprot, GeneCards
Cancer Gene Databases ONGene (Oncogene) , TSGene (Tumor suppressor gene) , NCG (Network of Cancer Genes)
Content > Methylation level in the promoter region of CR
> Methylation level in the promoter region of CR


  Correlation between expression and methylation as well as differential methylation analysis.
Cancer Full Name R P # N # T Delta beta (T vs N) P value (T vs N) Status
BLCABladder urothelial carcinoma-0.3399.15e-1317408-0.1671.59e-05NS/NA
BRCABreast invasive carcinoma-0.487083785-0.0792.84e-38NS/NA
CESCCervical and endocervical cancers-0.45203306NANANS/NA
COADColon adenocarcinoma-0.1960.000469192970.0220.000964NS/NA
ESCAEsophageal carcinoma-0.4441.24e-109185NANANS/NA
GBMGlioblastoma multiforme-0.3470.00484164NANANS/NA
HNSCHead and Neck squamous cell carcinoma-0.2871.3e-11205220.0033.29e-09NS/NA
KIRCKidney renal clear cell carcinoma-0.2445.14e-06243190.0031.07e-05NS/NA
KIRPKidney renal papillary cell carcinoma-0.1890.0010723275-0.0350.0863NS/NA
LAMLAcute Myeloid Leukemia-0.65100170NANANS/NA
LGGBrain Lower Grade Glioma-0.3113.3e-130530NANANS/NA
LIHCLiver hepatocellular carcinoma-0.3091.73e-1041373-0.1581.03e-14NS/NA
LUADLung adenocarcinoma-0.2683.19e-09214560.0940.000625NS/NA
LUSCLung squamous cell carcinoma-0.3192.7e-108370NANANS/NA
OVOvarian serous cystadenocarcinoma-0.3830.31209NANANS/NA
PAADPancreatic adenocarcinoma-0.2994.25e-054179NANANS/NA
PCPGPheochromocytoma and Paraganglioma-0.2770.0001283184NANANS/NA
PRADProstate adenocarcinoma-0.2862.07e-11354980.0042.48e-06NS/NA
READRectum adenocarcinoma-0.3590.00025299NANANS/NA
SARCSarcoma-0.3631.75e-090263NANANS/NA
SKCMSkin Cutaneous Melanoma-0.286.79e-101471NANANS/NA
STADStomach adenocarcinoma-0.3951.22e-150372NANANS/NA
TGCTTesticular Germ Cell Tumors-0.55800156NANANS/NA
THCAThyroid carcinoma-0.2051.01e-0650509-0.0070.0328NS/NA
THYMThymoma-0.4969.95e-092120NANANS/NA
UCECUterine Corpus Endometrial Carcinoma-0.442034431-0.0626.03e-15NS/NA
Summary
SymbolBMI1
NameBMI1 proto-oncogene, polycomb ring finger
Aliases RNF51; PCGF4; polycomb group ring finger 4; B lymphoma Mo-MLV insertion region 1 homolog (mouse); FLVI2/BMI1 ......
Location10p12.2
External Links HGNC, NCBI, Ensembl, Uniprot, GeneCards
Cancer Gene Databases ONGene (Oncogene) , TSGene (Tumor suppressor gene) , NCG (Network of Cancer Genes)
Content > Primary tumor tissue from TCGA
> Normal tumor tissue from HPA
>The Cancer Genome Atlas (TCGA)
 
There is no record.
> The Human Protein Atlas (HPA)


Tissue Level Level Name
Adrenal gland 2 Medium
Appendix 2 Medium
Bone marrow 3 High
Breast 2 Medium
Bronchus 3 High
Caudate 2 Medium
Cerebellum 2 Medium
Cerebral cortex 2 Medium
Cervix, uterine 2 Medium
Colon 2 Medium
Duodenum 1 Low
Endometrium 2 Medium
Epididymis 2 Medium
Esophagus 1 Low
Fallopian tube 2 Medium
Gallbladder 2 Medium
Heart muscle 1 Low
Hippocampus 2 Medium
Kidney 3 High
Liver 1 Low
Lung 2 Medium
Lymph node 2 Medium
Nasopharynx 3 High
Oral mucosa 1 Low
Ovary 2 Medium
Pancreas 2 Medium
Parathyroid gland 2 Medium
Placenta 3 High
Prostate 2 Medium
Rectum 1 Low
Salivary gland 1 Low
Seminal vesicle 2 Medium
Skeletal muscle 2 Medium
Skin 3 High
Small intestine 1 Low
Smooth muscle 1 Low
Soft tissue 3 High
Spleen 2 Medium
Stomach 1 Low
Testis 2 Medium
Thyroid gland 2 Medium
Tonsil 2 Medium
Urinary bladder 2 Medium
Vagina 1 Low
Summary
SymbolBMI1
NameBMI1 proto-oncogene, polycomb ring finger
Aliases RNF51; PCGF4; polycomb group ring finger 4; B lymphoma Mo-MLV insertion region 1 homolog (mouse); FLVI2/BMI1 ......
Location10p12.2
External Links HGNC, NCBI, Ensembl, Uniprot, GeneCards
Cancer Gene Databases ONGene (Oncogene) , TSGene (Tumor suppressor gene) , NCG (Network of Cancer Genes)
Content > Association between expresson and subtype
> Overall survival analysis based on expression
> Association between expresson and stage
> Association between expresson and grade
> Subtype


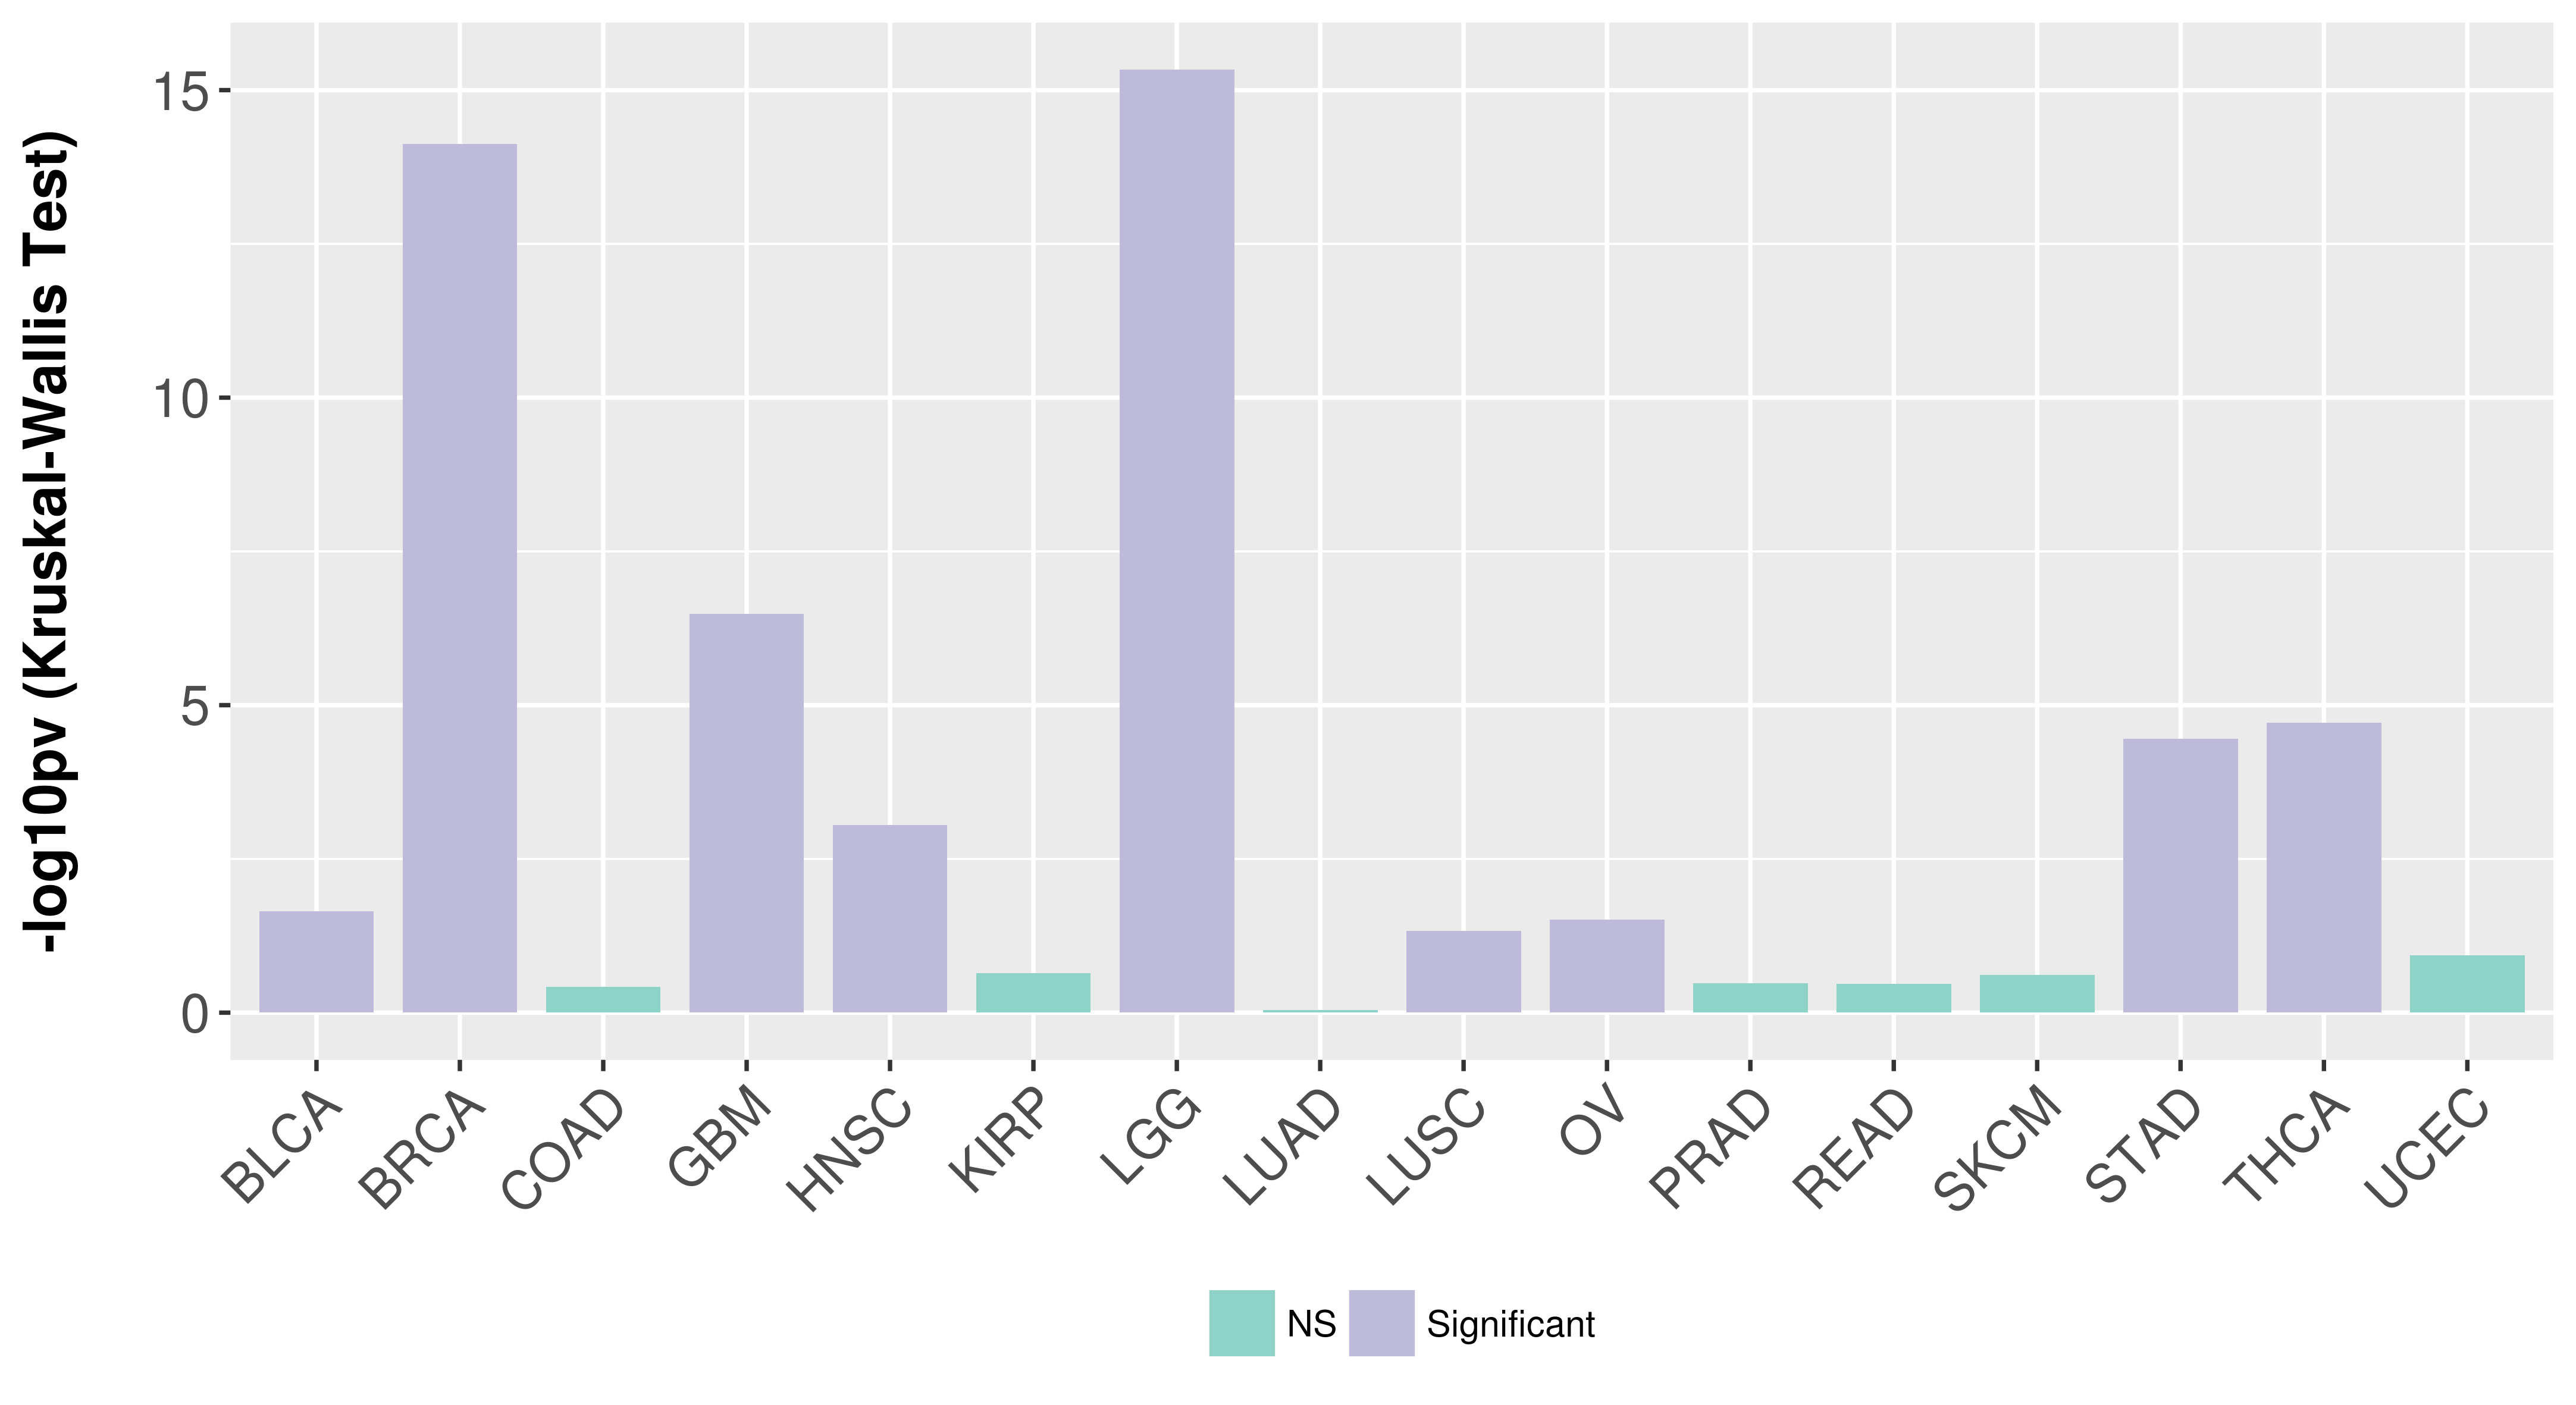
  Association between expresson and subtype.
Cancer Full Name # Patients P Value (Kruskal-Wallis) Association Source
BLCABladder urothelial carcinoma1280.0225Significant24476821
BRCABreast invasive carcinoma5217.5e-15Significant23000897
COADColon adenocarcinoma1490.379NS22810696
GBMGlioblastoma multiforme1573.3e-07Significant26824661
HNSCHead and Neck squamous cell carcinoma2790.000886Significant25631445
KIRPKidney renal papillary cell carcinoma1610.227NS26536169
LGGBrain Lower Grade Glioma5134.67e-16Significant26824661
LUADLung adenocarcinoma2300.913NS25079552
LUSCLung squamous cell carcinoma1780.0466Significant22960745
OVOvarian serous cystadenocarcinoma2870.0304Significant21720365
PRADProstate adenocarcinoma3330.33NS26544944
READRectum adenocarcinoma670.34NS22810696
SKCMSkin Cutaneous Melanoma3150.243NS26091043
STADStomach adenocarcinoma2773.53e-05Significant25079317
THCAThyroid carcinoma3911.93e-05Significant25417114
UCECUterine Corpus Endometrial Carcinoma2320.118NS23636398
> Overall survival
 

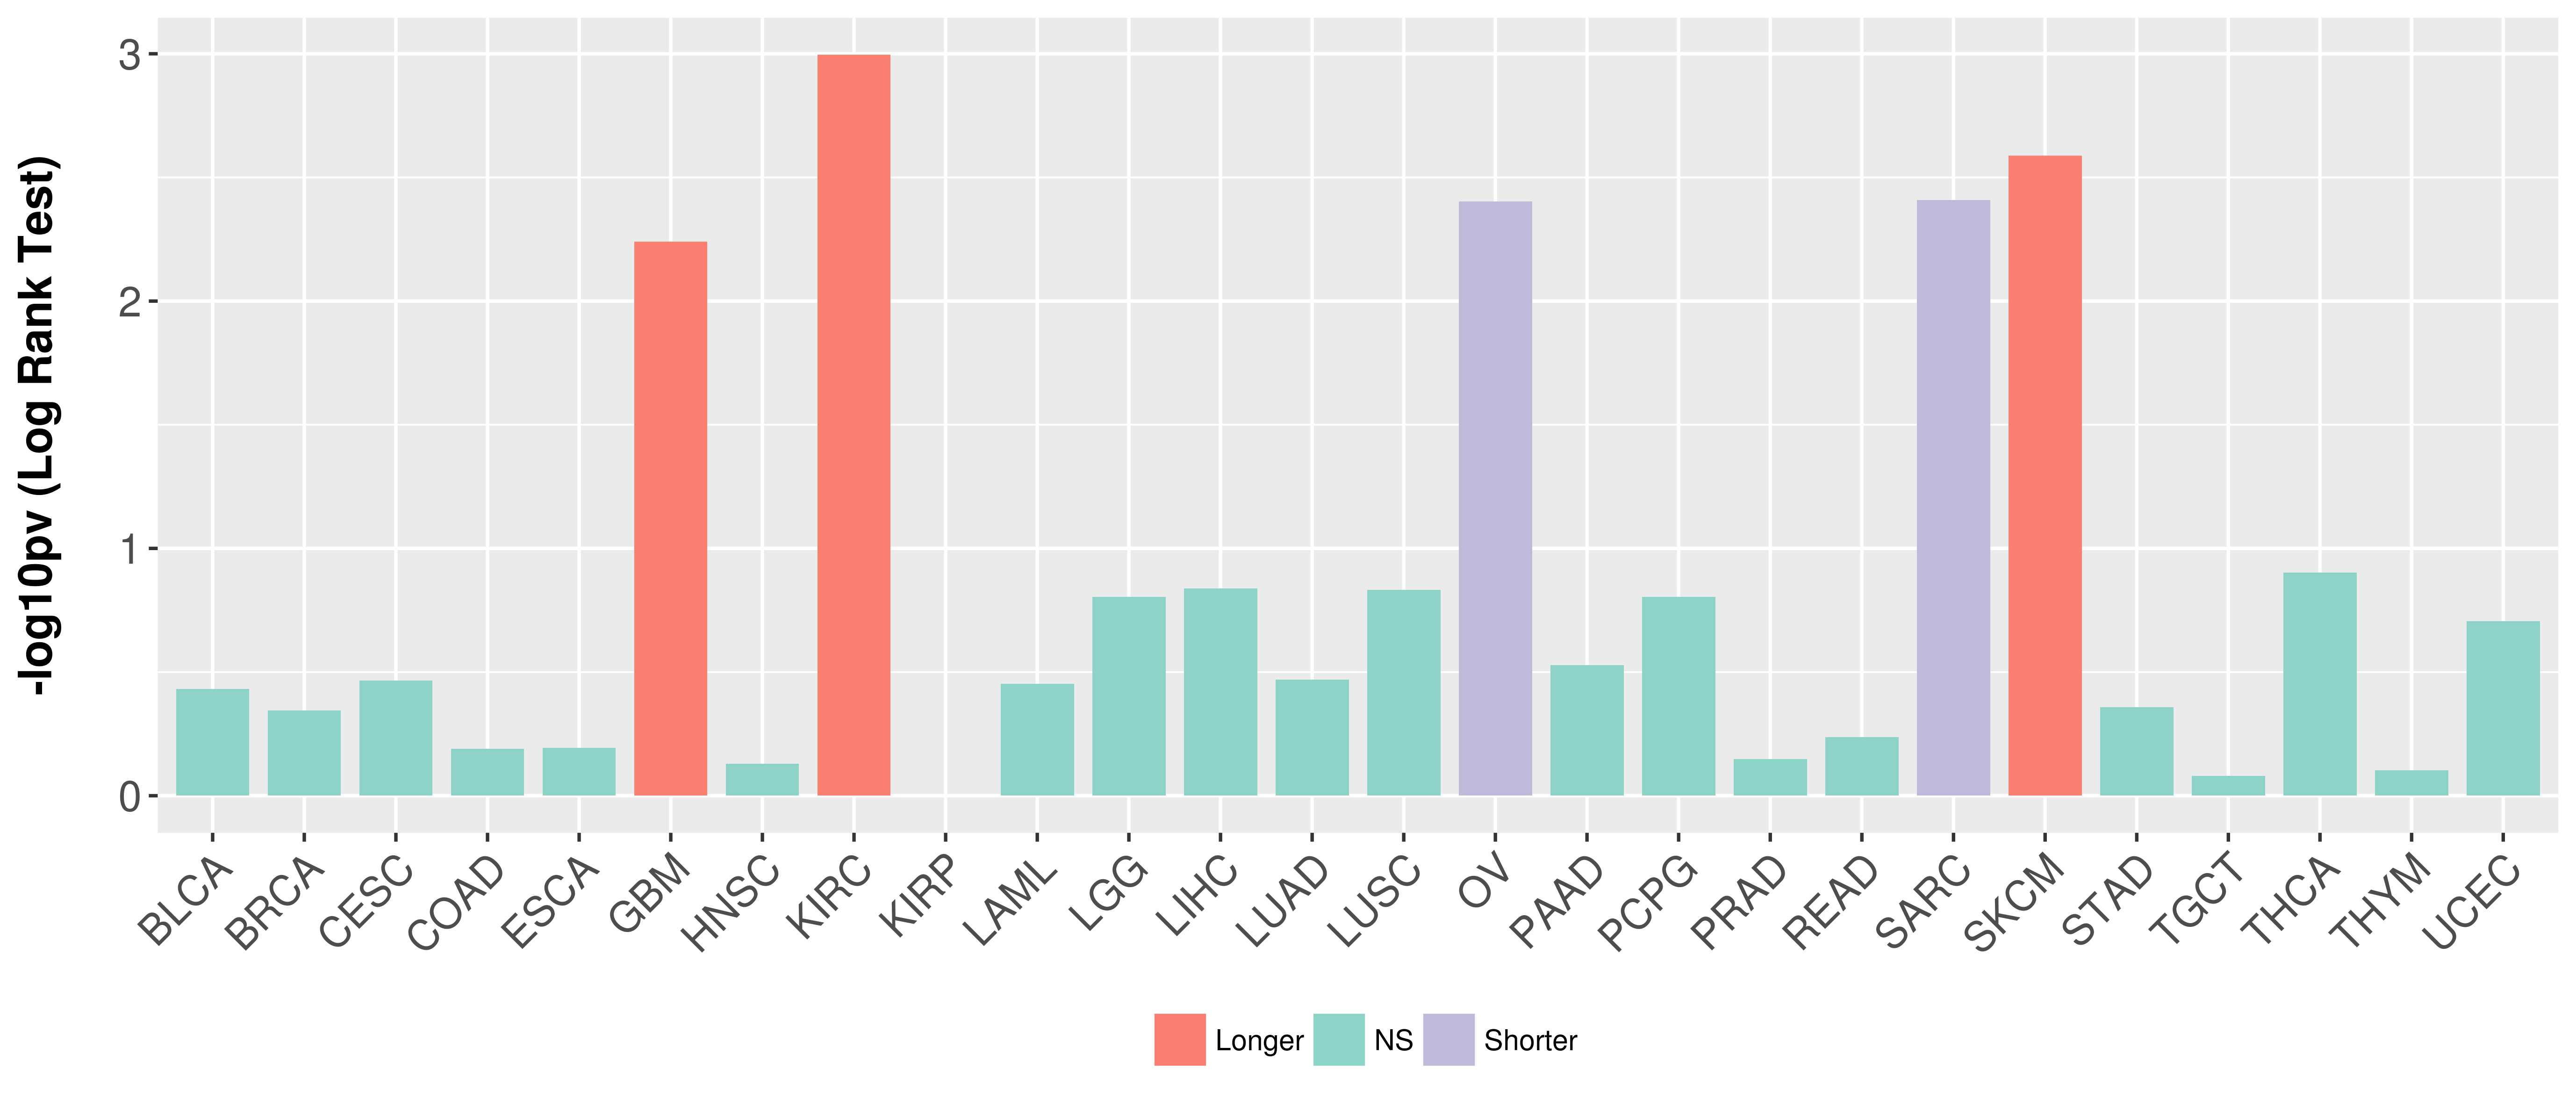
  Overall survival analysis based on expression.
Cancer Full Name # Patients Hazard Ratio P Value (Log Rank Test) Association
BLCABladder urothelial carcinoma405 0.8310.37NS
BRCABreast invasive carcinoma1079 1.1910.453NS
CESCCervical and endocervical cancers291 1.3740.342NS
COADColon adenocarcinoma439 1.1510.646NS
ESCAEsophageal carcinoma184 0.8690.641NS
GBMGlioblastoma multiforme158 0.5050.00576Longer
HNSCHead and Neck squamous cell carcinoma518 0.9390.744NS
KIRCKidney renal clear cell carcinoma531 0.5210.00101Longer
KIRPKidney renal papillary cell carcinoma287 1.0010.998NS
LAMLAcute Myeloid Leukemia149 1.3060.352NS
LGGBrain Lower Grade Glioma511 0.6950.157NS
LIHCLiver hepatocellular carcinoma365 1.4230.145NS
LUADLung adenocarcinoma502 1.2150.339NS
LUSCLung squamous cell carcinoma494 0.750.147NS
OVOvarian serous cystadenocarcinoma303 1.8350.00396Shorter
PAADPancreatic adenocarcinoma177 0.7430.297NS
PCPGPheochromocytoma and Paraganglioma179 1615474834.40.157NS
PRADProstate adenocarcinoma497 0.7110.71NS
READRectum adenocarcinoma159 1.4670.579NS
SARCSarcoma259 2.3220.00391Shorter
SKCMSkin Cutaneous Melanoma459 0.5550.00258Longer
STADStomach adenocarcinoma388 1.1960.439NS
TGCTTesticular Germ Cell Tumors134 1.3520.83NS
THCAThyroid carcinoma500 0.3690.125NS
THYMThymoma119 0.8020.789NS
UCECUterine Corpus Endometrial Carcinoma543 1.4870.197NS
> Stage
 

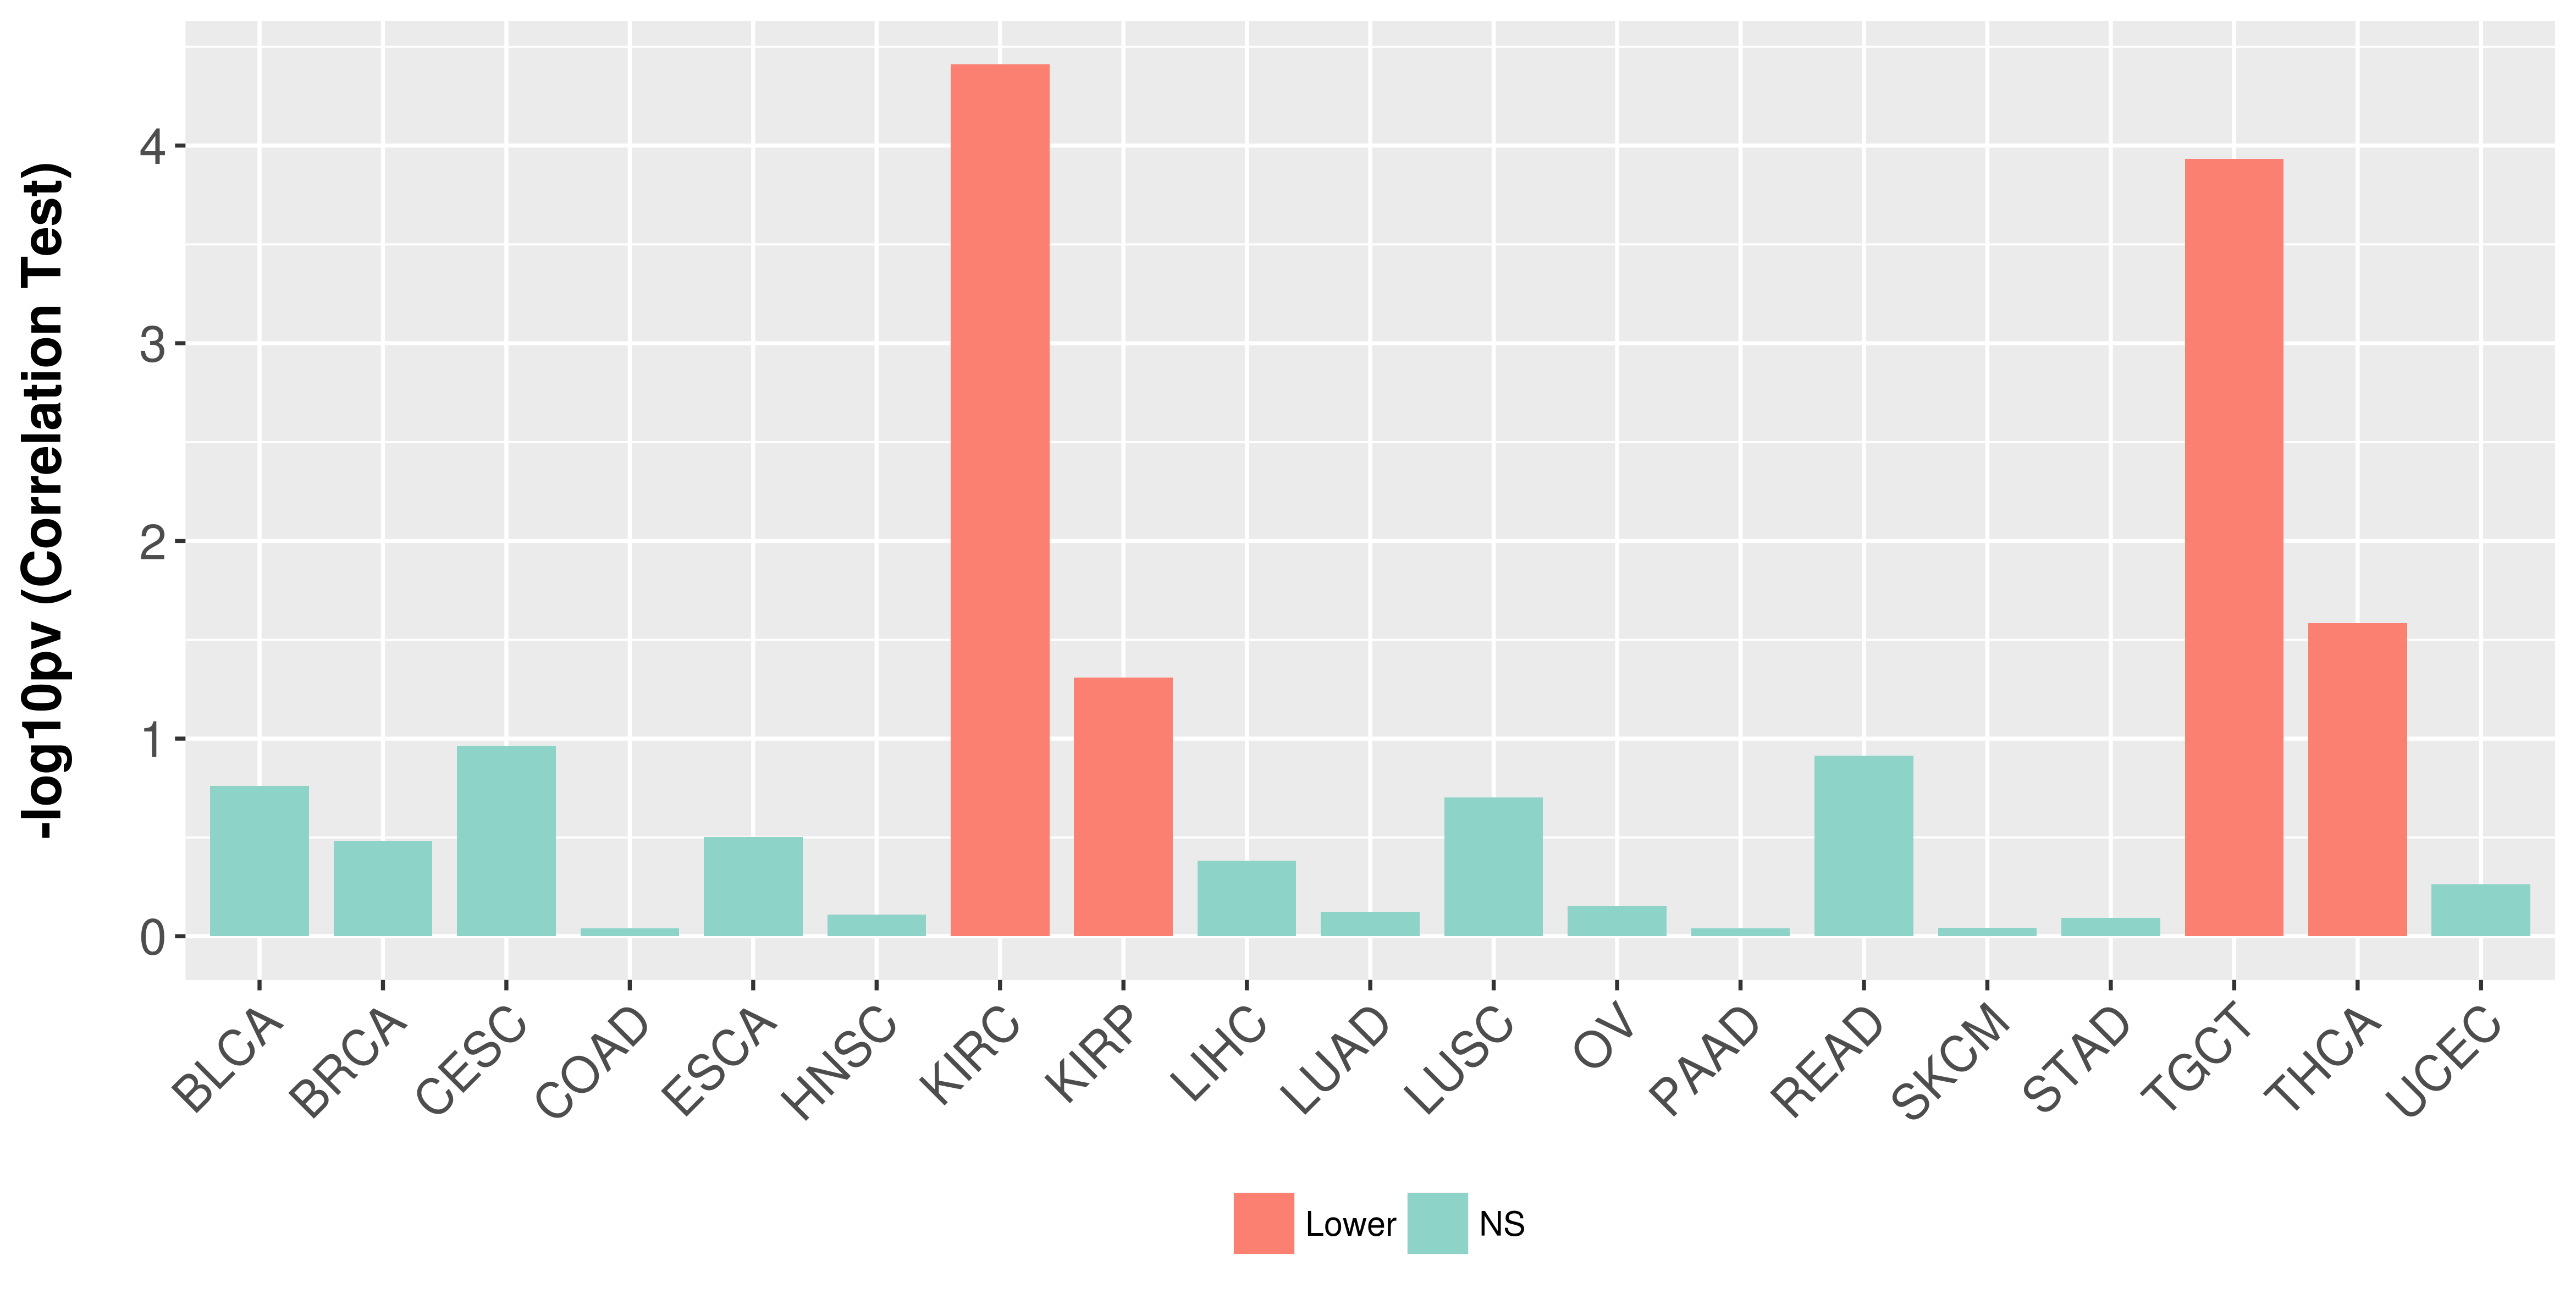
  Association between expresson and stage.
Cancer Full Name # Patients R Value (Spearman) P Value (Spearman) Association
BLCABladder urothelial carcinoma406 -0.0680.173NS
BRCABreast invasive carcinoma1071 0.030.33NS
CESCCervical and endocervical cancers167 -0.1240.109NS
COADColon adenocarcinoma445 -0.0050.912NS
ESCAEsophageal carcinoma162 0.0790.315NS
HNSCHead and Neck squamous cell carcinoma448 0.0130.778NS
KIRCKidney renal clear cell carcinoma531 -0.1783.89e-05Lower
KIRPKidney renal papillary cell carcinoma260 -0.1220.0491Lower
LIHCLiver hepatocellular carcinoma347 0.0440.415NS
LUADLung adenocarcinoma507 -0.0140.754NS
LUSCLung squamous cell carcinoma497 0.0580.198NS
OVOvarian serous cystadenocarcinoma302 -0.0220.7NS
PAADPancreatic adenocarcinoma176 0.0090.909NS
READRectum adenocarcinoma156 0.1240.122NS
SKCMSkin Cutaneous Melanoma410 -0.0060.905NS
STADStomach adenocarcinoma392 0.0130.805NS
TGCTTesticular Germ Cell Tumors81 -0.4150.000117Lower
THCAThyroid carcinoma499 -0.10.026Lower
UCECUterine Corpus Endometrial Carcinoma501 -0.0270.547NS
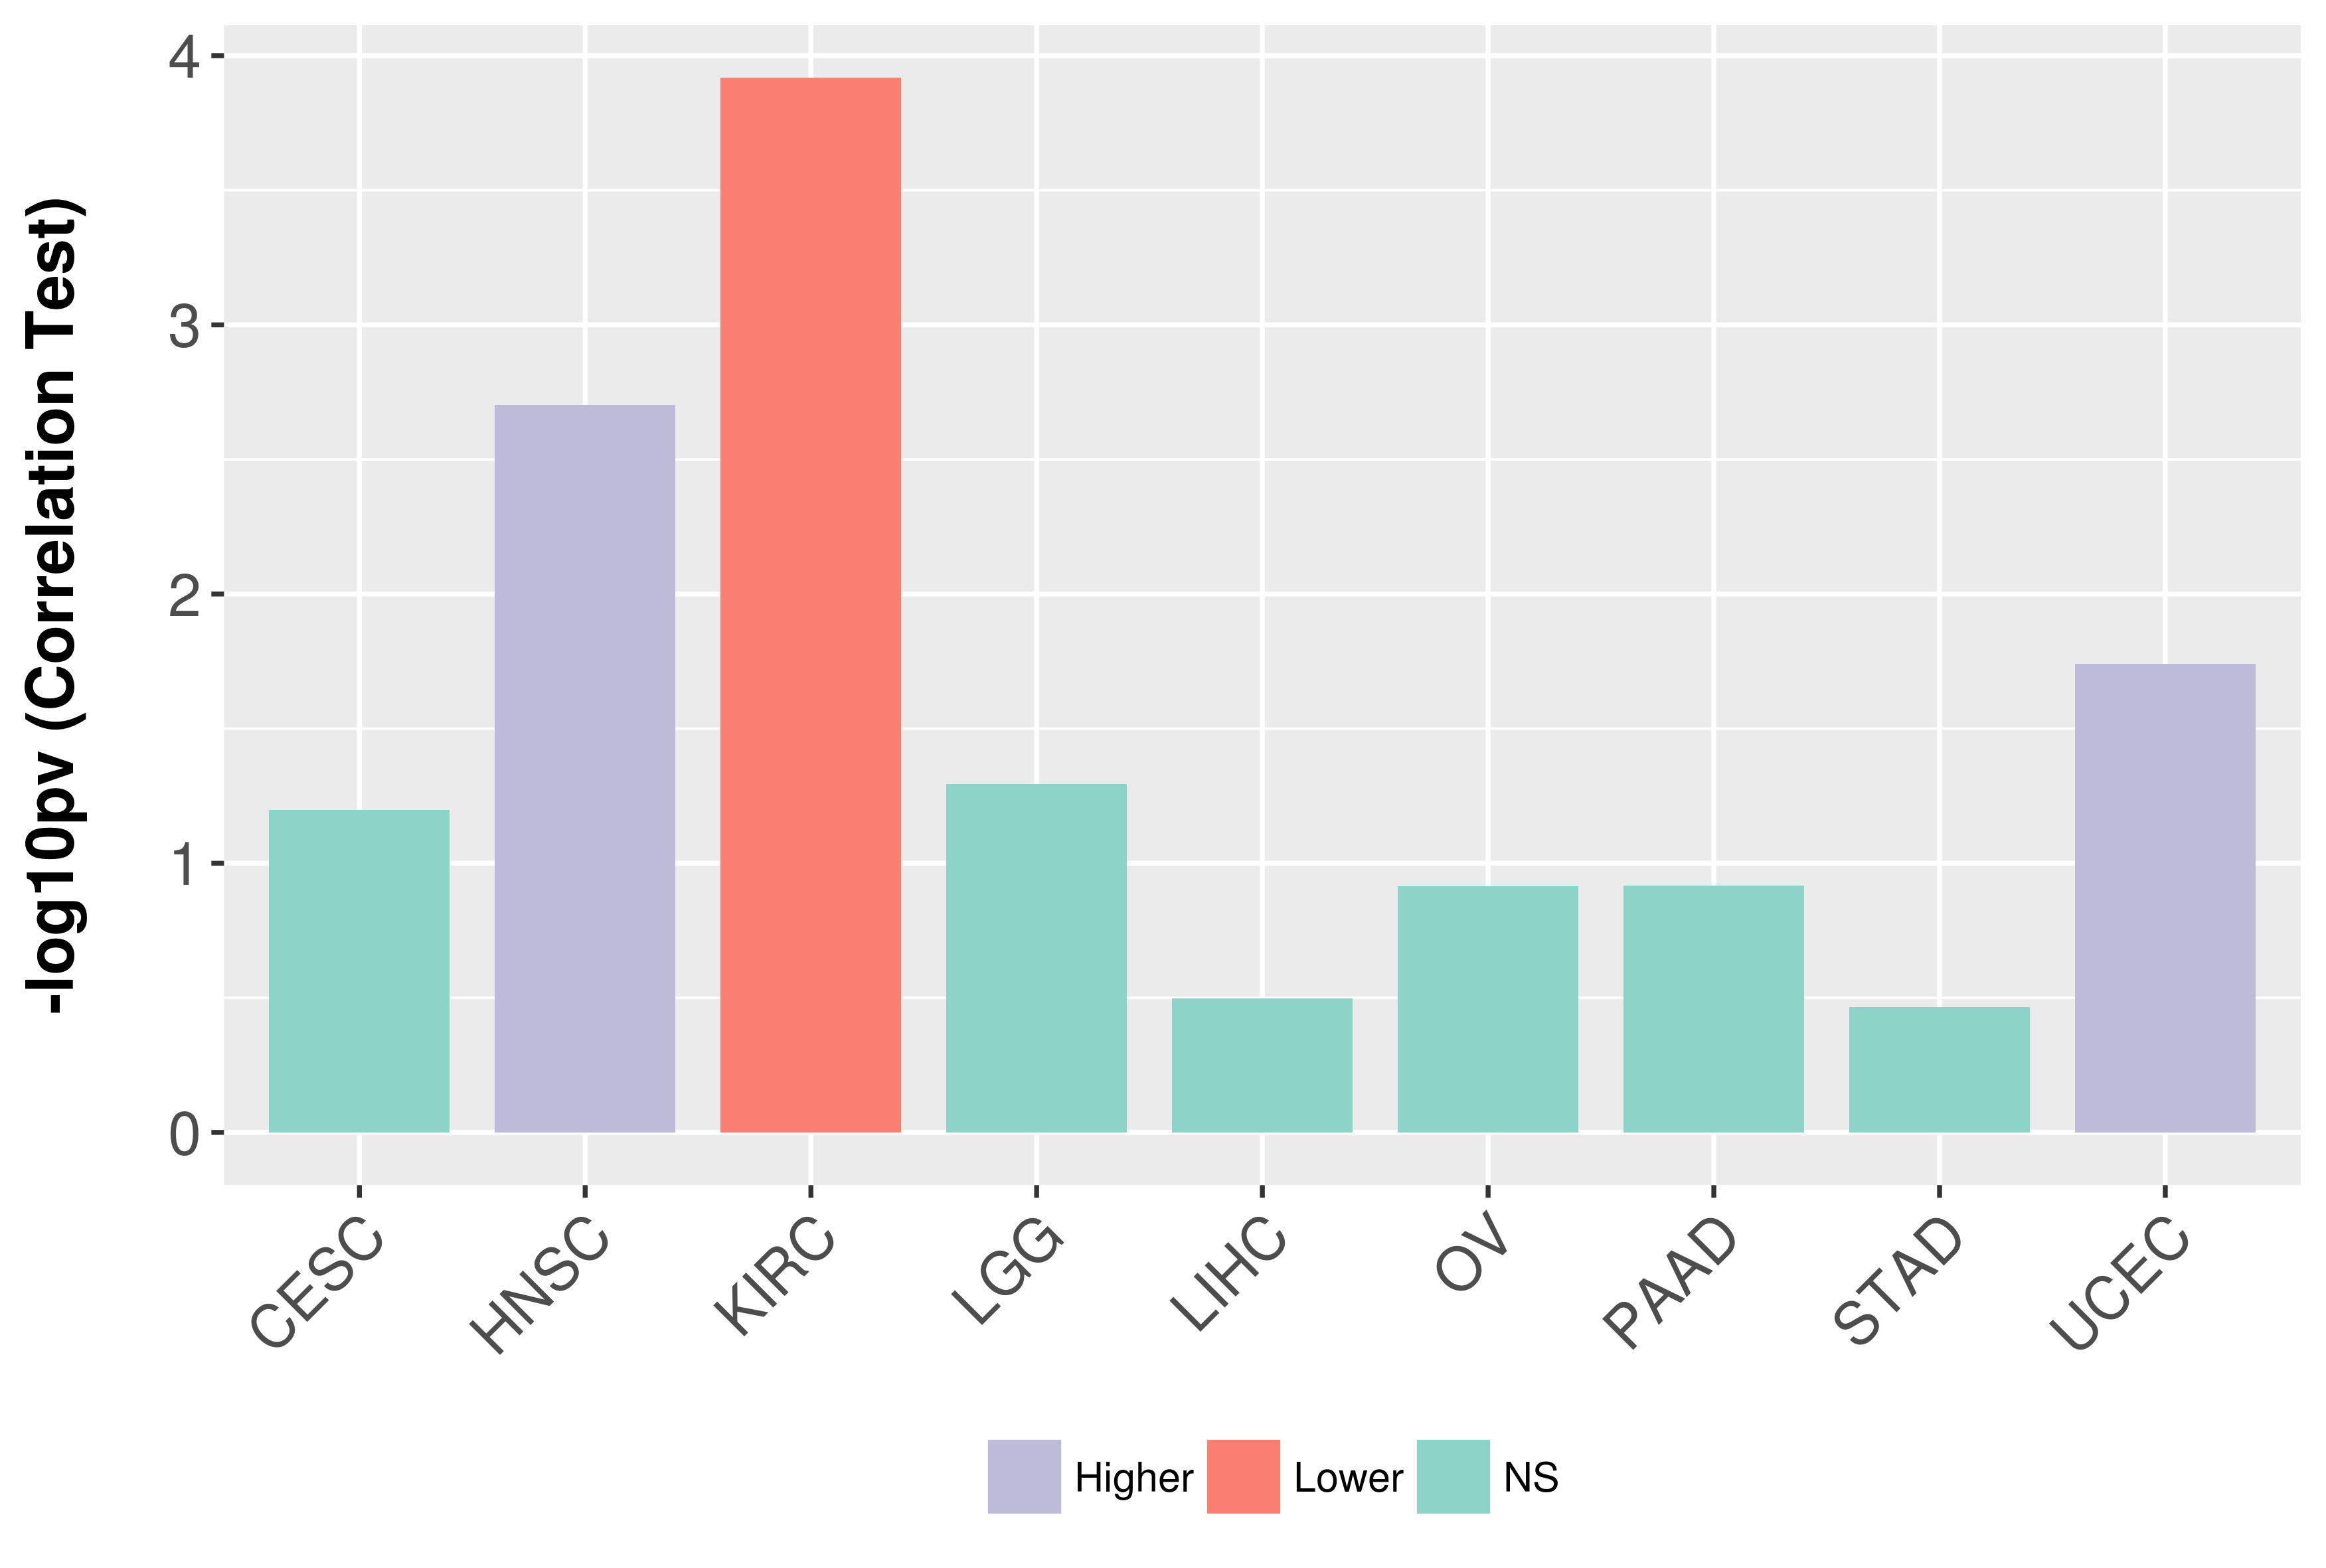
> Grade
 

  Association between expresson and grade.
Cancer Full Name # Patients R Value (Spearman) P Value (Spearman) Association
CESCCervical and endocervical cancers272 0.1130.0635NS
HNSCHead and Neck squamous cell carcinoma498 0.1380.00198Higher
KIRCKidney renal clear cell carcinoma525 -0.1670.000121Lower
LGGBrain Lower Grade Glioma514 -0.0860.0508NS
LIHCLiver hepatocellular carcinoma366 -0.0520.317NS
OVOvarian serous cystadenocarcinoma296 -0.090.122NS
PAADPancreatic adenocarcinoma176 -0.1170.121NS
STADStomach adenocarcinoma406 -0.0470.343NS
UCECUterine Corpus Endometrial Carcinoma534 0.1020.0182Higher
Summary
SymbolBMI1
NameBMI1 proto-oncogene, polycomb ring finger
Aliases RNF51; PCGF4; polycomb group ring finger 4; B lymphoma Mo-MLV insertion region 1 homolog (mouse); FLVI2/BMI1 ......
Location10p12.2
External Links HGNC, NCBI, Ensembl, Uniprot, GeneCards
Cancer Gene Databases ONGene (Oncogene) , TSGene (Tumor suppressor gene) , NCG (Network of Cancer Genes)
Content > Targets inferred by reverse engineering method
> Targets identified by ChIP-seq data
> Targets inferred by reverse engineering method
 
> Targets identified by ChIP-seq data
 
Summary
SymbolBMI1
NameBMI1 proto-oncogene, polycomb ring finger
Aliases RNF51; PCGF4; polycomb group ring finger 4; B lymphoma Mo-MLV insertion region 1 homolog (mouse); FLVI2/BMI1 ......
Location10p12.2
External Links HGNC, NCBI, Ensembl, Uniprot, GeneCards
Cancer Gene Databases ONGene (Oncogene) , TSGene (Tumor suppressor gene) , NCG (Network of Cancer Genes)
Content > Drugs from DrugBank database
> Drugs from DrugBank database
 
There is no record for BMI1.
Summary
SymbolBMI1
NameBMI1 proto-oncogene, polycomb ring finger
Aliases RNF51; PCGF4; polycomb group ring finger 4; B lymphoma Mo-MLV insertion region 1 homolog (mouse); FLVI2/BMI1 ......
Location10p12.2
External Links HGNC, NCBI, Ensembl, Uniprot, GeneCards
Cancer Gene Databases ONGene (Oncogene) , TSGene (Tumor suppressor gene) , NCG (Network of Cancer Genes)
Content > Protein-Protein Interaction Network
> miRNA Regulatory Relationship
> Interactions from Text Mining
> Protein-Protein Interaction Network
 
> miRNA Regulatory Relationship
 
> Interactions from Text Mining
 
PMID Cancer Hierarchy Gene Relation to CR Evidence
27166996Gastric CarcinomapartnermiR-338-5pnegative correlationWe additionally found that decreased miR-338-5p expression in GC tissues, relative to normal tissues, was significantly negatively correlated with increased BMI1 expression.
26919246Hepatocellular CarcinomaupstreammiR-200bnegative regulationA luciferase reporter assay was used to validate BMI1 as a direct target of microRNA-200b. Furthermore, microRNA-200b was activated in HCC cells after treatment with 5-azacytidine, whereas BMI1 expression was clearly downregulated.
26137120Non-Small Cell Lung CarcinomaupstreammiR-203negative regulationmiR-203 was demonstrated to act as a tumor suppressor by regulating the expression of Bmi1. miR-203 expression levels were downregulated in NSCLC tissues while Bmi1 expression was upregulated in NSCLC tissues and cell lines.
25999024Esophageal Squamous Cell CarcinomapartnermiR-218negative correlationThe BMI1 mRNA expression levels were markedly increased and negatively correlated with the miR-218 expression level in the ESCC tissues.
25475727MelanomaupstreammiR-203negative regulationWe also identified BMI1 as a downstream target gene of miR-203, which bound to the 3'UTR of BMI1. Overexpression of miR-203 was associated with decreased BMI1 expression and impaired cell invasion and tumor sphere formation activities.
24375660Thymic LymphomaupstreammiR-200cnegative regulationTaken together, we conclude that down-regulated expression of miR-200c and up-regulation of its direct target BMI1 in radiation-induced thymic lymphoma, which may indicate a novel therapeutic method for RITL through induction of miR-200c or inhibition of BMI1.
24312366Malignant Digestive System NeoplasmupstreammiR-30e*negative regulationLuciferase assays using miR-30e* mimic revealed that Bmi1 was a direct target for miR-30e* by interactions with the putative miR-30e* binding sites in the Bmi1 3' untranslated region. qRT-PCR analysis of resected cancer specimens showed that miR-30e* expression was downregulated in tumor regions compared with non-tumor regions, and Bmi1 expression was inversely correlated with miR-30e* expression in gastric cancer tissues, but not in colon cancer tissues.
24302590Head and Neck Squamous Cell Carcinomadownstreamp16; p14negative regulationThese results indicate that RD deletion and BMI1 overexpression frequently occur in the early stage of oral carcinogenesis and BMI1 overexpression may downregulate the transcription of p16 and p14 through interfering with RD.
23873108Ductal Breast Carcinoma In SitupartnerPRco-regulationBMI1 gene was co-regulated (down) with PR in the invasive ductal breast carcinoma with relative progression explicating it a diagnostic biomarker for ductal carcinoma of the breast.
23686310Mantle Cell LymphomaupstreammiR-16regulationOn screening for upstream regulators of BMI1, we found that expression of microRNA-16 (miR-16) was downregulated in MCL SP cells by regulating Bmi1 in the SPs, leading to reductions in tumor size following lymphoma xenografts.
22265735GlioblastomapartnerCD133negative correlationWe find that Bmi1 expression is increased in CD133- cells, and Bmi1 protein and transcript expression are highest during intermediate stages of differentiation as CD133+ BTICs lose their CD133 expression.
22120066Myelodysplastic Syndromedownstreamp16; phospho-p53; CASP3; CASP9negative regulationOverexpression of BMI1 antagonised apoptosis by downregulating several apoptosis-related proteins, such as p16(INK4a), phospho-p53 (Ser46) and caspase 3/9.
21856782NeuroblastomaupstreamN-myc; MYCpositive regulationOverexpression of MYCN or MYC transactivated the BMI1 promoter and up-regulated BMI1 gene expression.
21755556Laryngeal Squamous Cell CarcinomapartnerCD133positive correlationBMI1 was highly enriched in CD133+ cells.
20170541Gastric CarcinomapartnerMel-18negative correlationOverexpression of BMI1 correlated with advanced clinical stage and lymph node metastasis; while the expression of Mel-18 negatively correlated with BMI1.