Help
1. Information for Chromatin Regulators (CRs)
1.1 Function
1.2 Mutation
1.3 Post-translation modification (PTM)
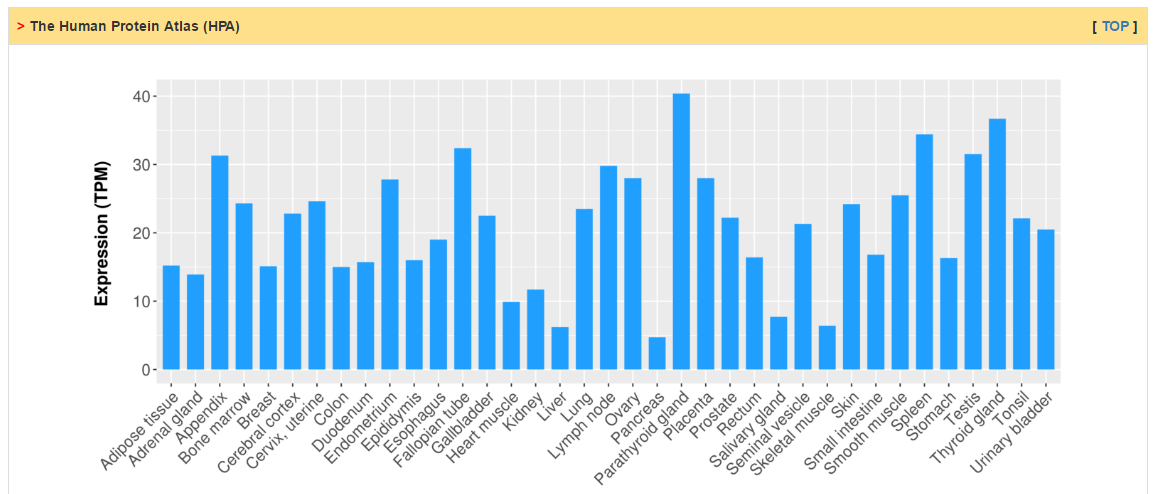
1.4 RNA expression
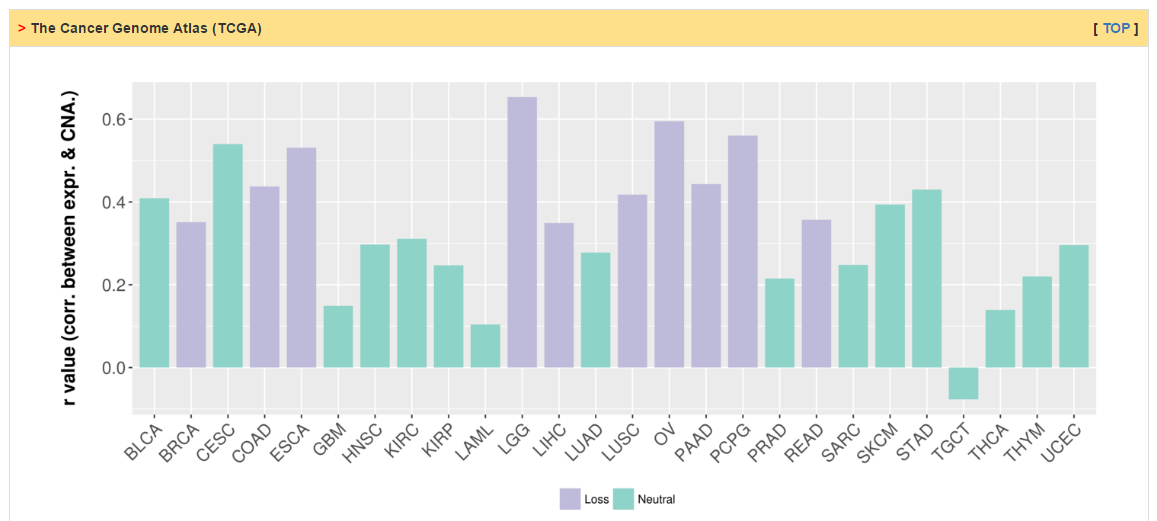
1.5 Somatic copy number alteration (SCNA)
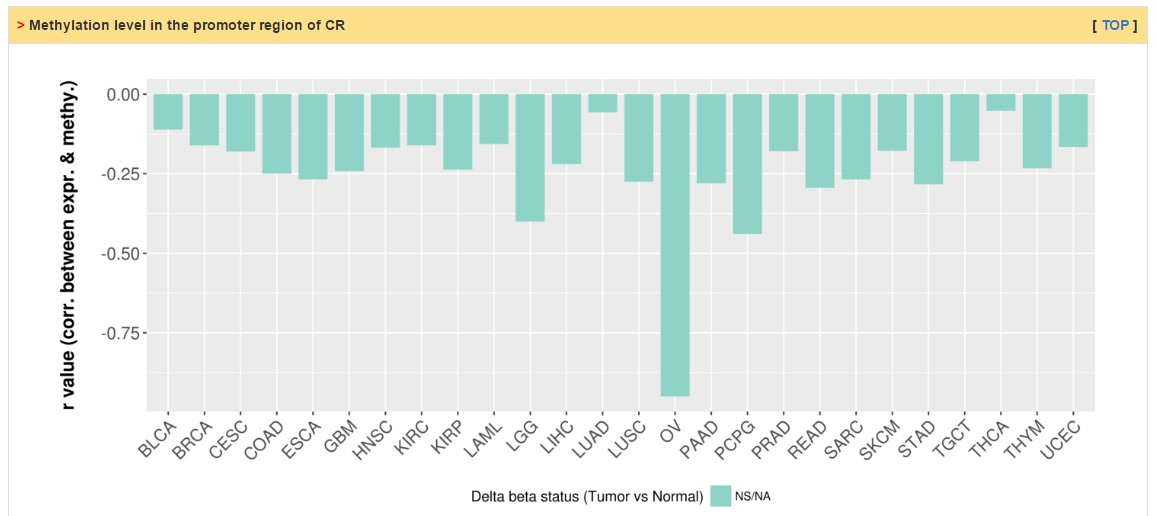
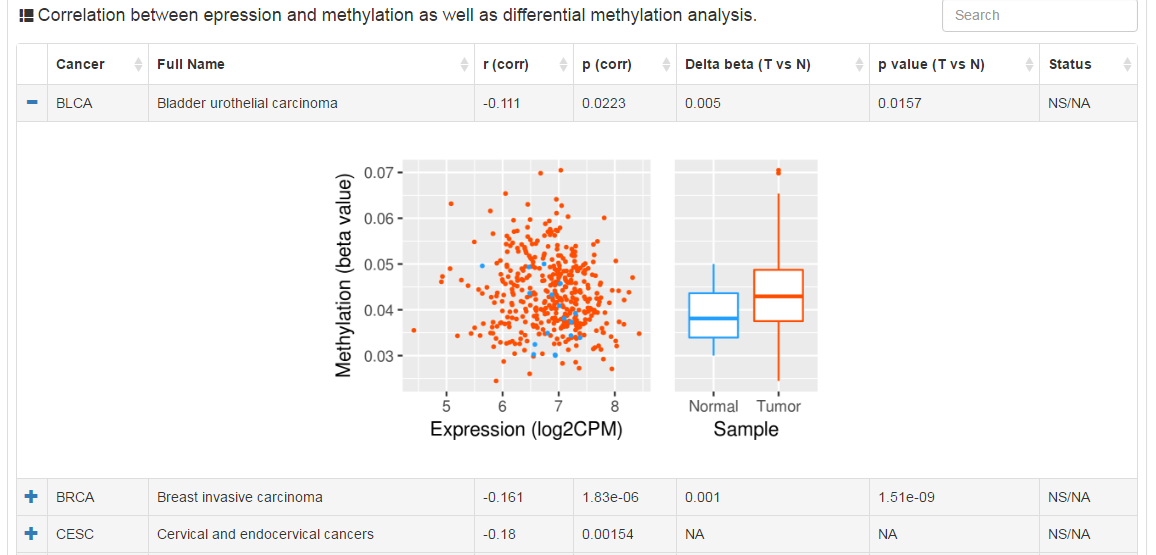
1.6 Methylation
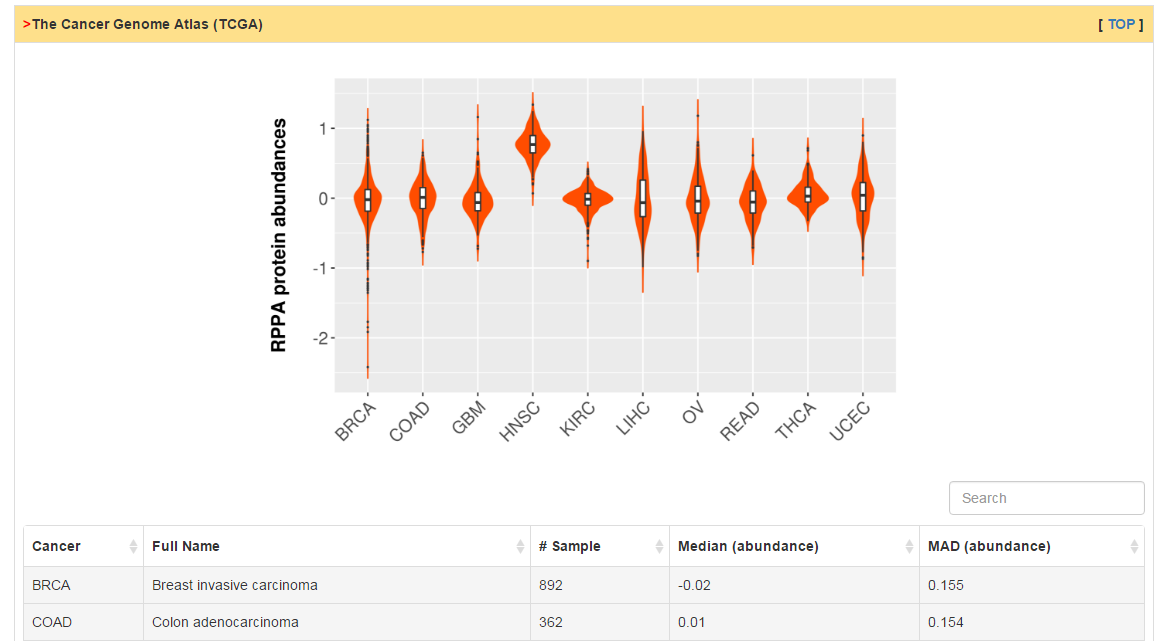
1.7 Proteomics
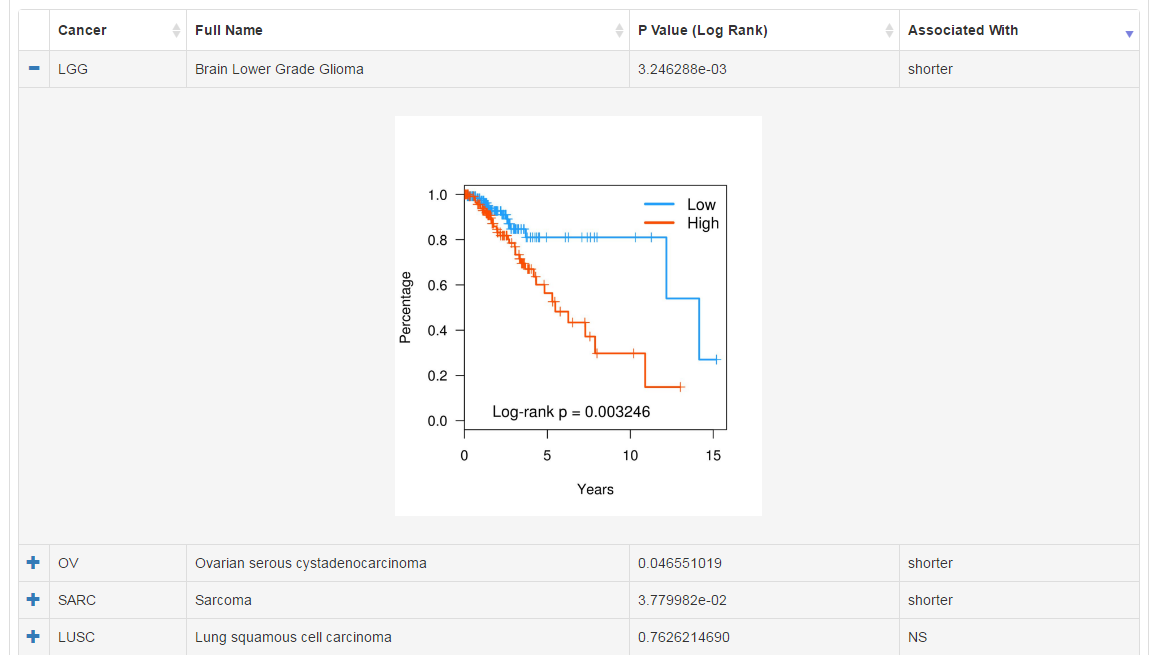
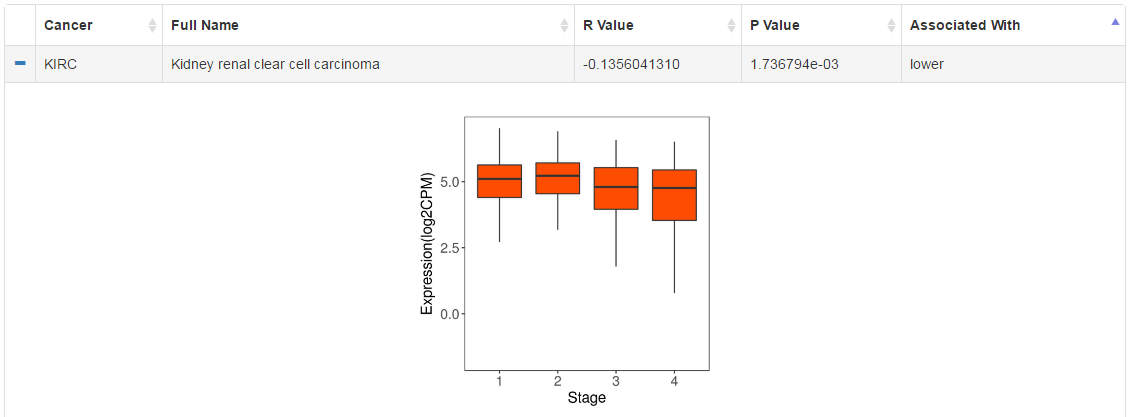
1.8 Clinical
1.9 Putative Targets
1.10 Drug
1.11 Interactions
2. Browse all CRs by
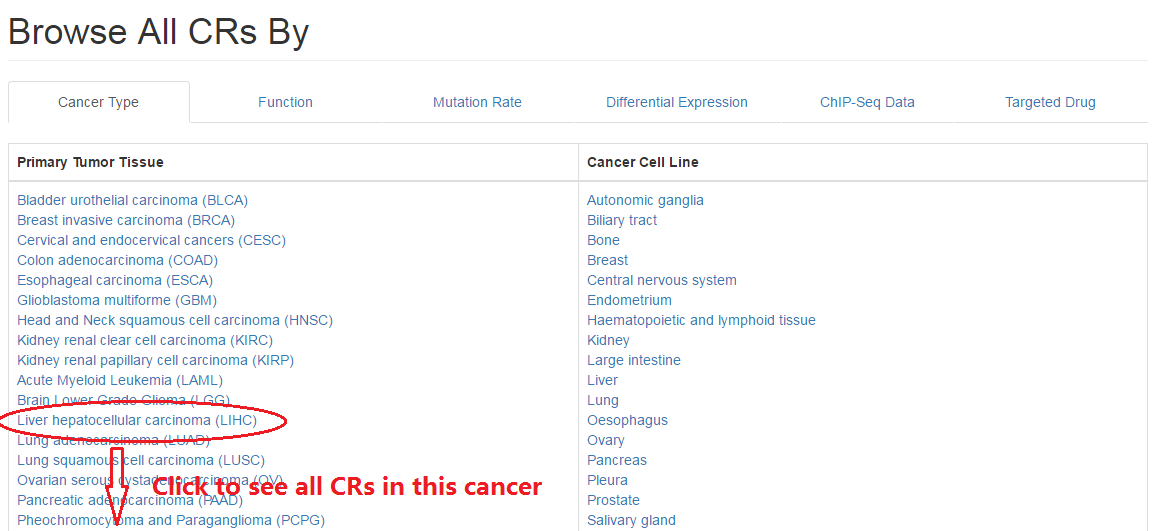
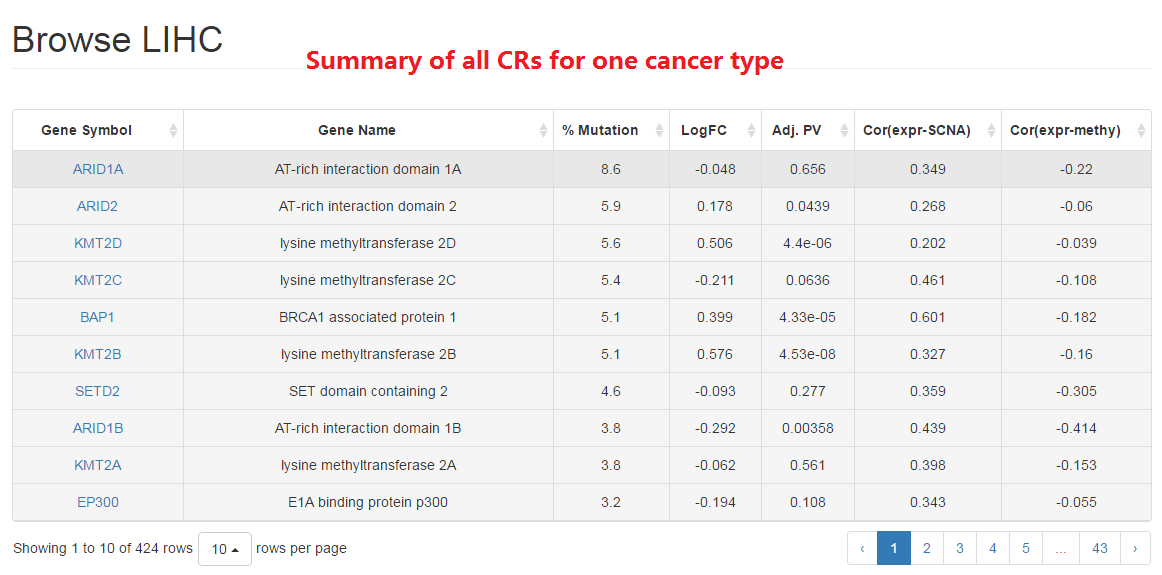
2.1 Cancer type
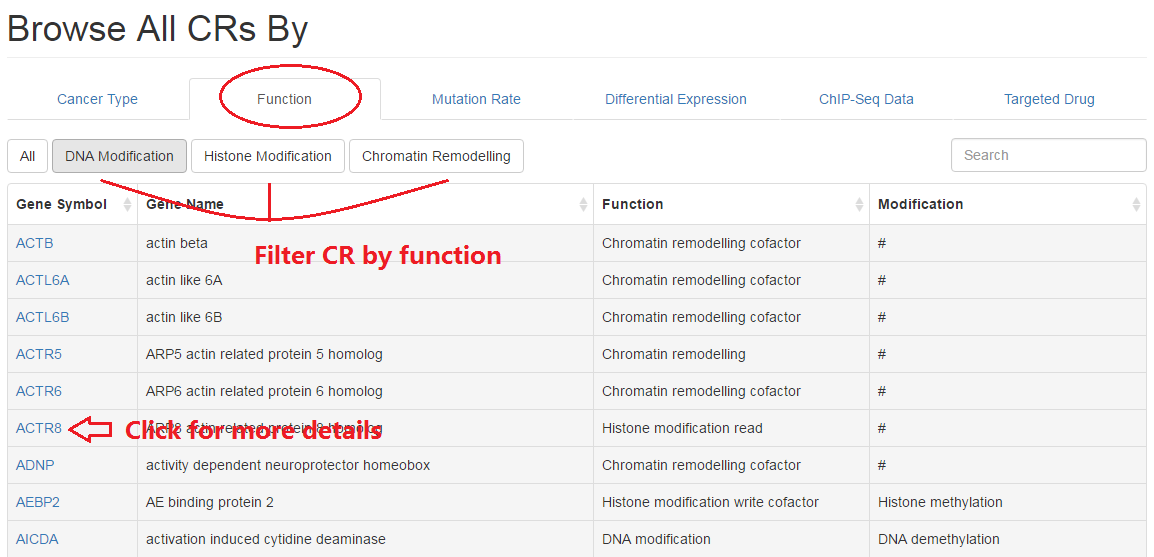
2.2 Molecular function
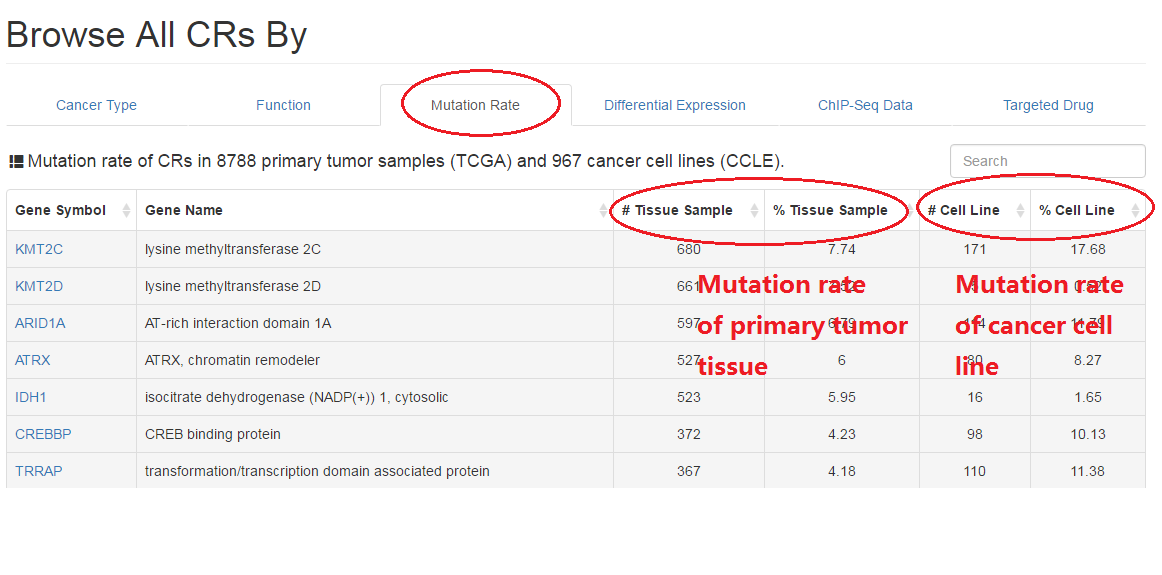
2.3 Non silent mutation rate
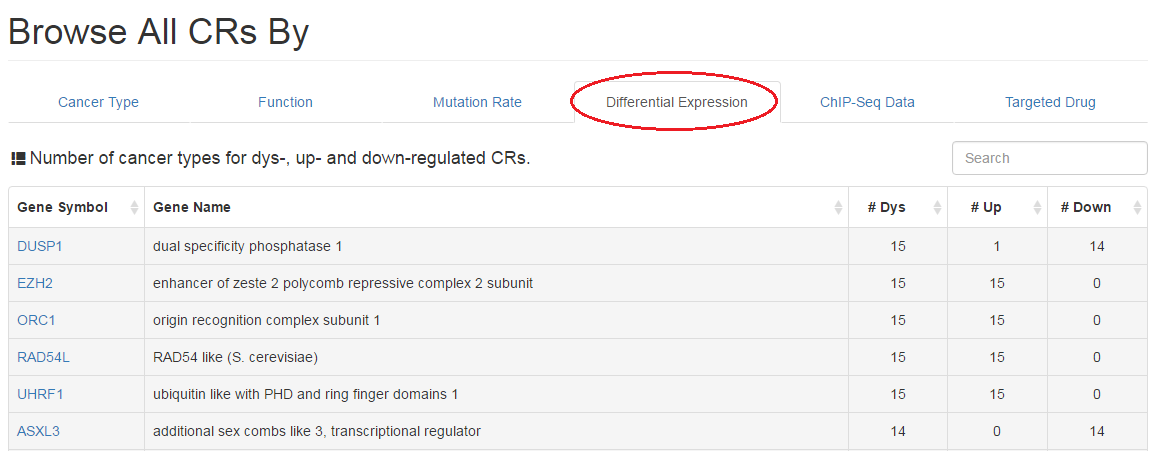
2.4 Differential expression analysis
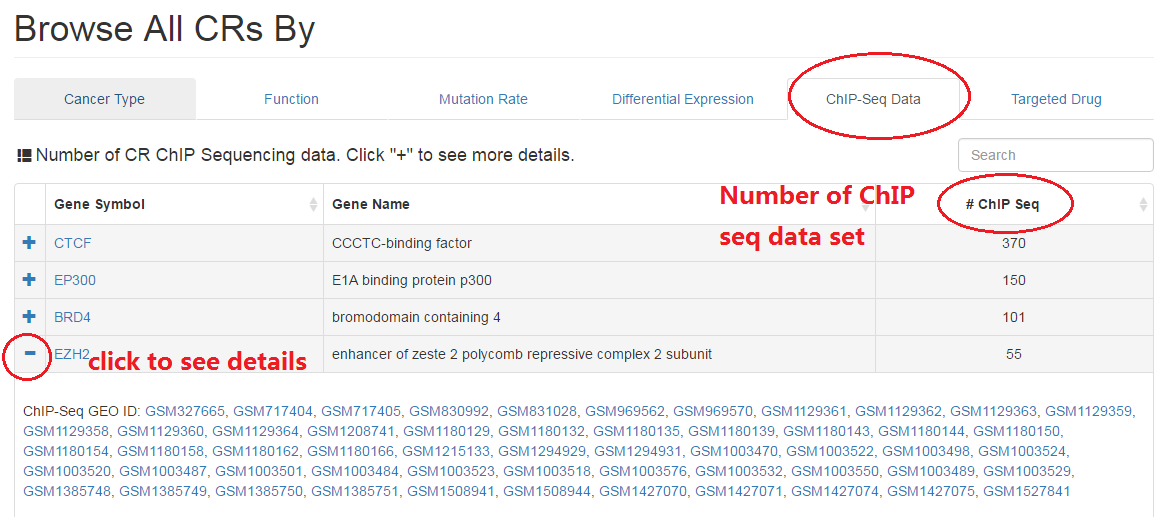
2.5 ChIP Sequencing data
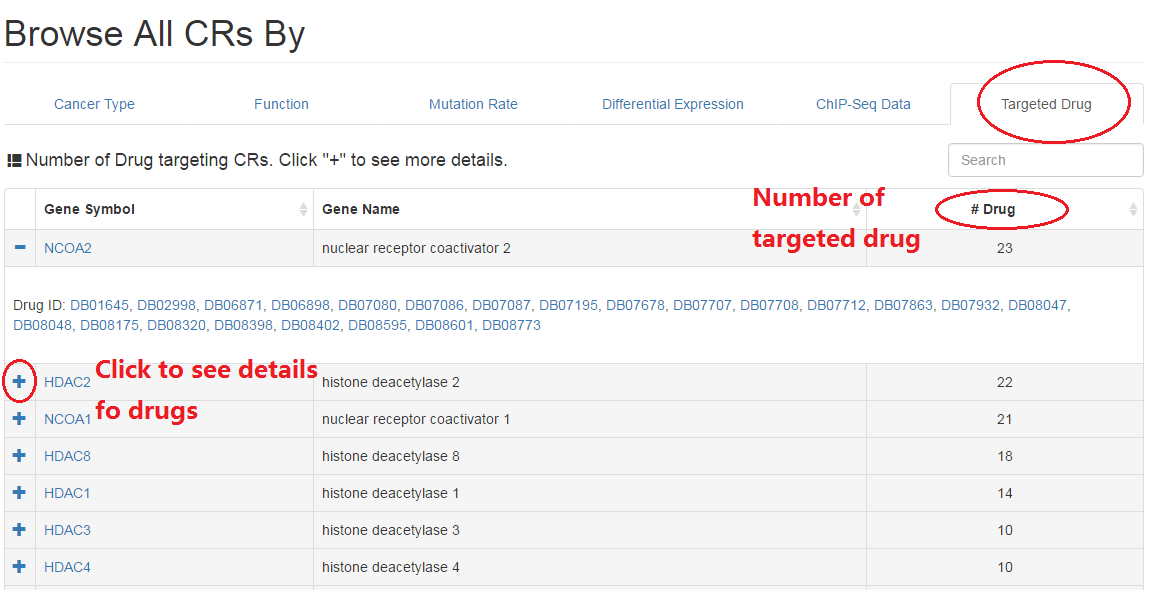
2.6 Drugs
3. Search database
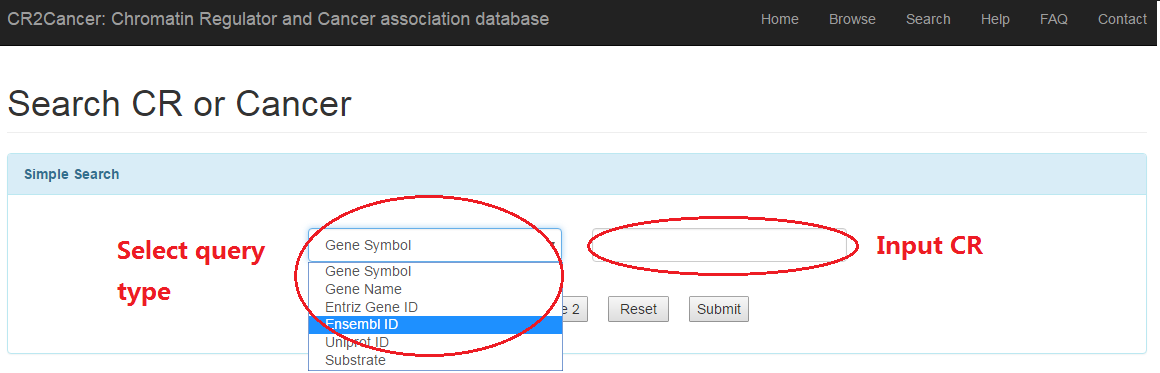
3.1 Simple search
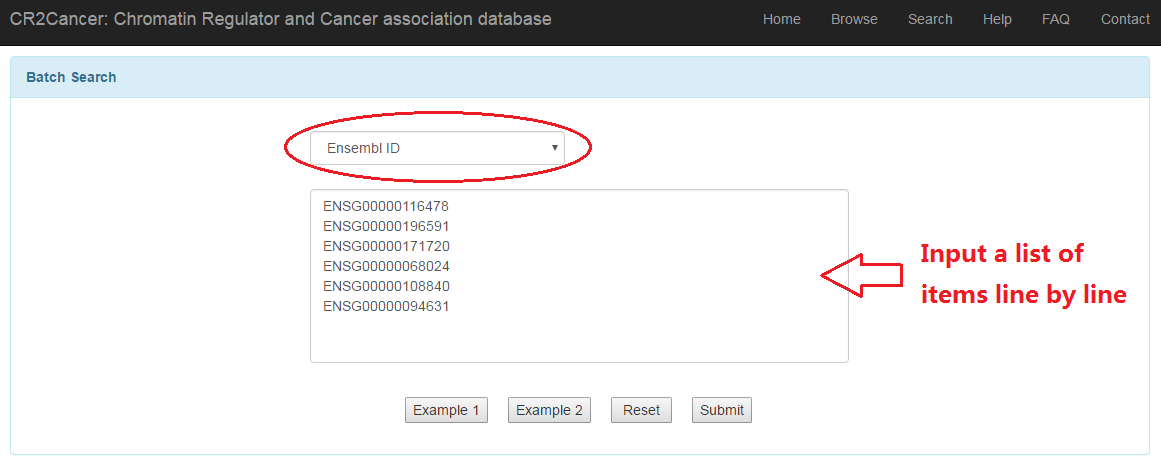
3.2 Batch search
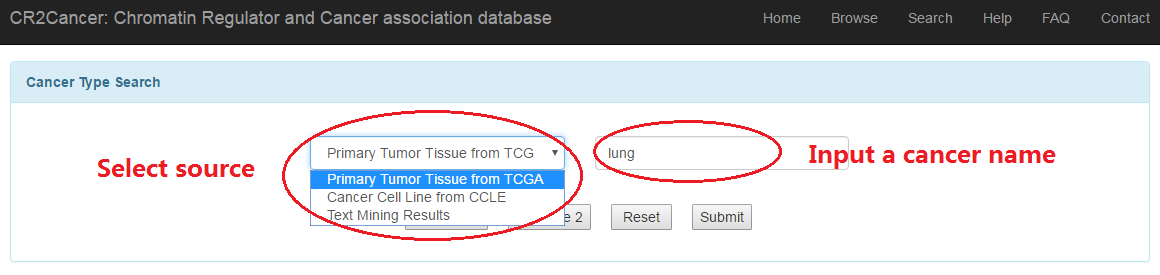
3.3 Cancer type search
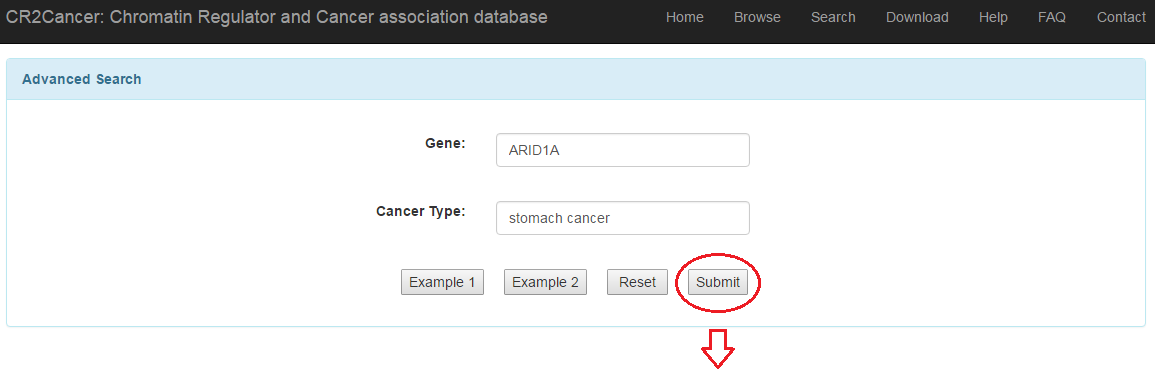
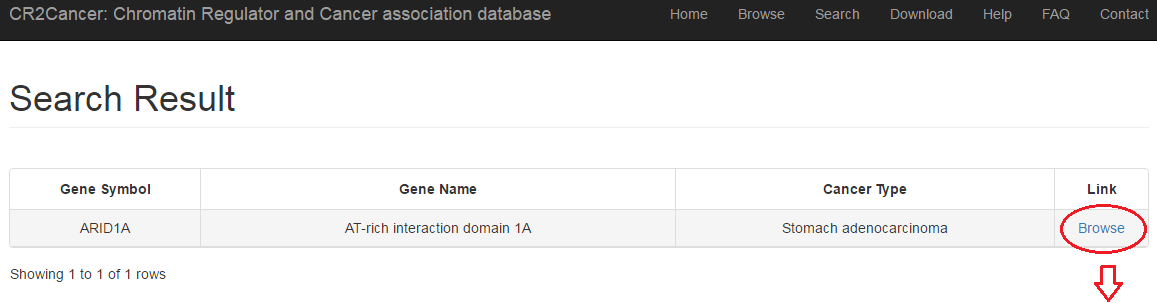
3.4 Advanced search
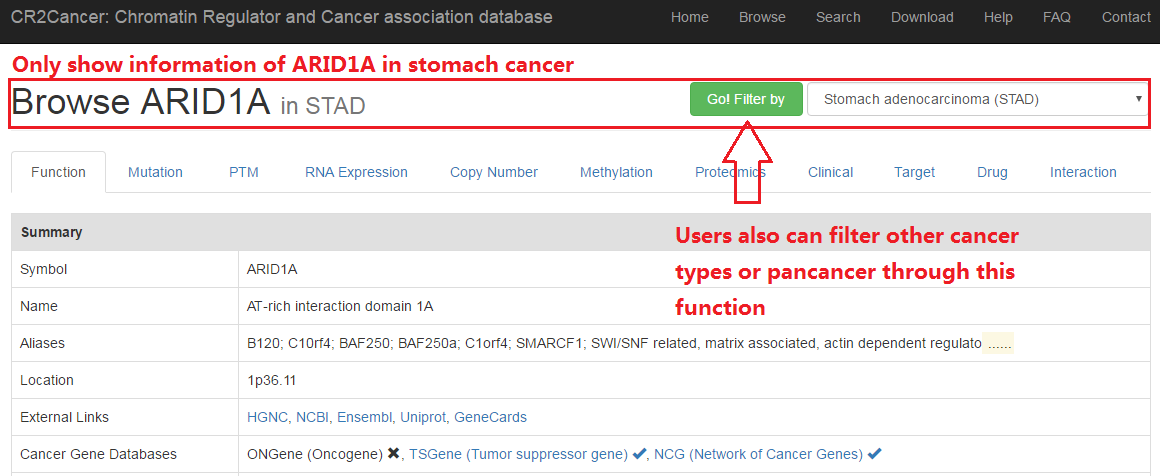
Users can get basic infomation of CRs, including gene symbol, name, location and several links to public database.
Additionally, protein domain and function as well as GO and pathways are also included in this page.
 |
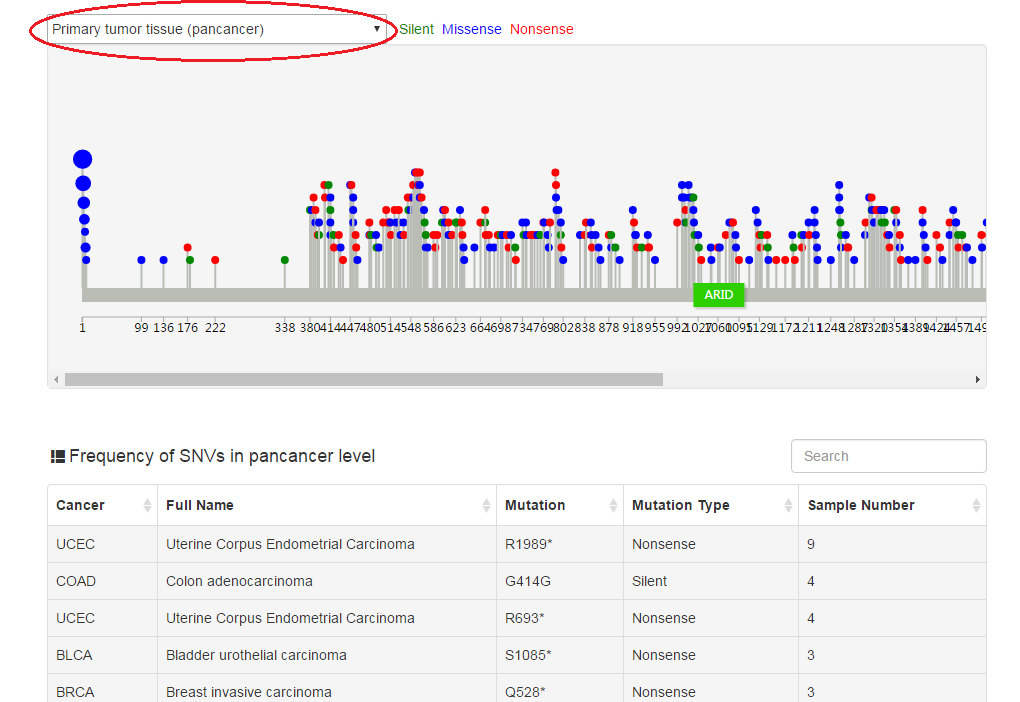
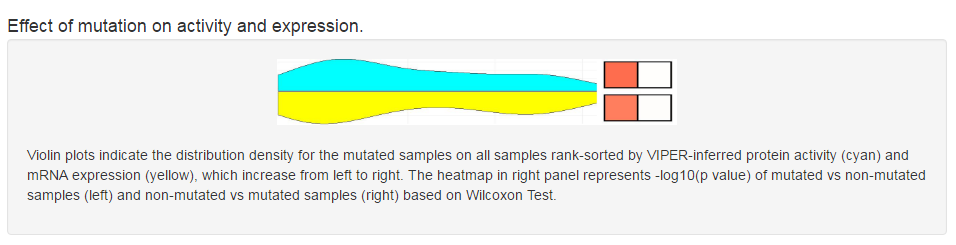
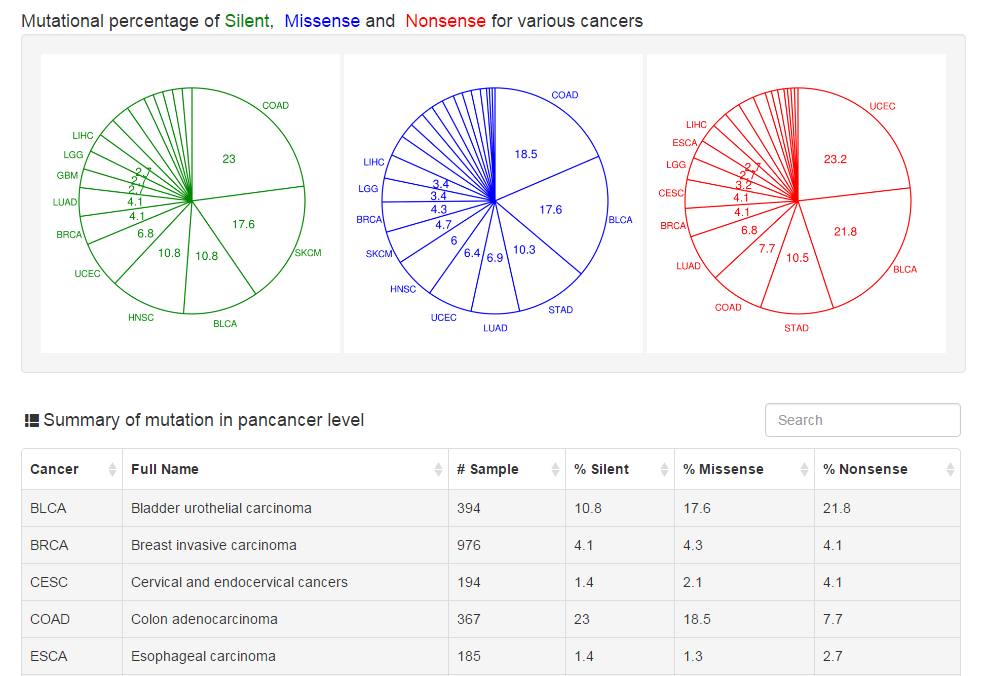
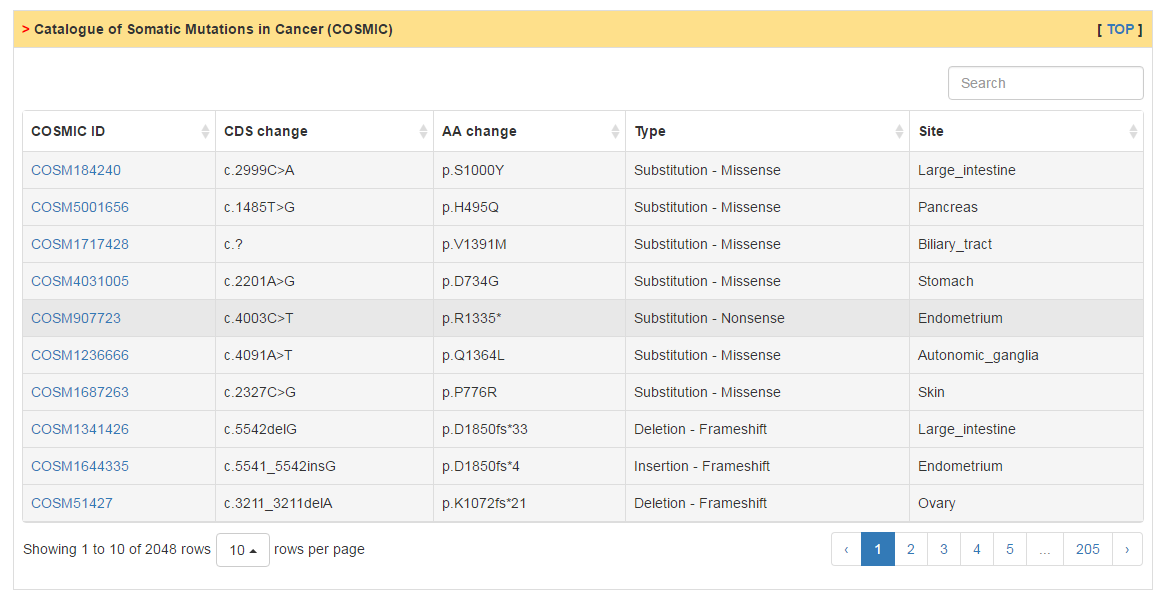
Users can scan the mutation landscape of CRs in pan-cancer level or specific cancer for primary tumor tissue and cancer cell line. For the single primary tumor, we also explore the effect of mutation on expression and activity using an excellent package VIPER developed last year. In addition, we also collected mutation data from COSMIC database and publications.
    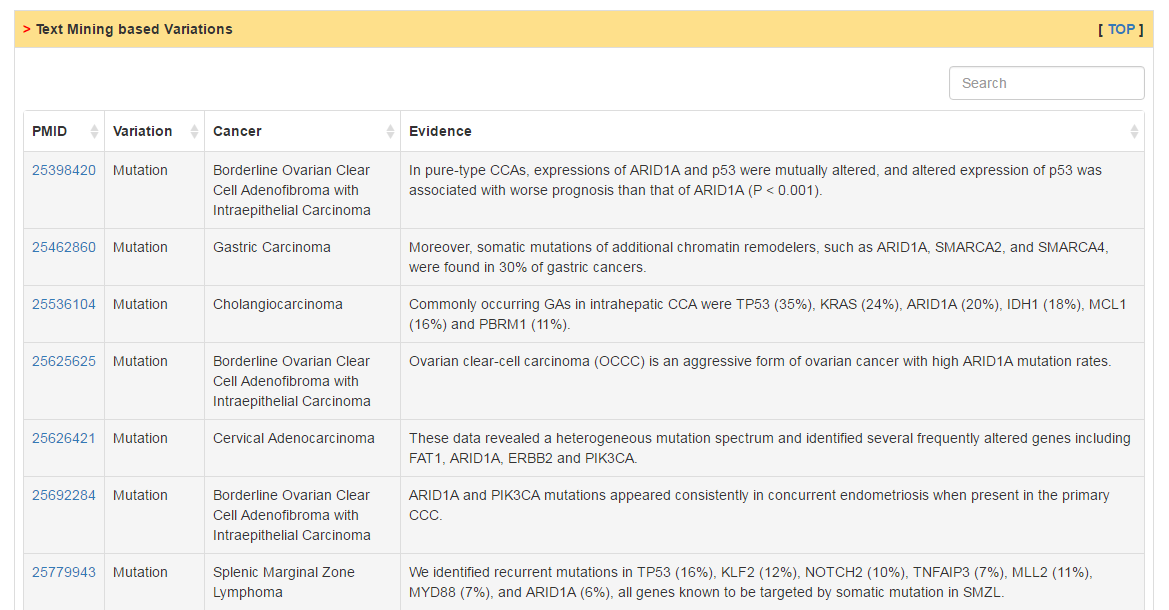 |
Users can check the post-translation modification site of CRs and whether they are affected by mutation through clicking the two buttons above table.
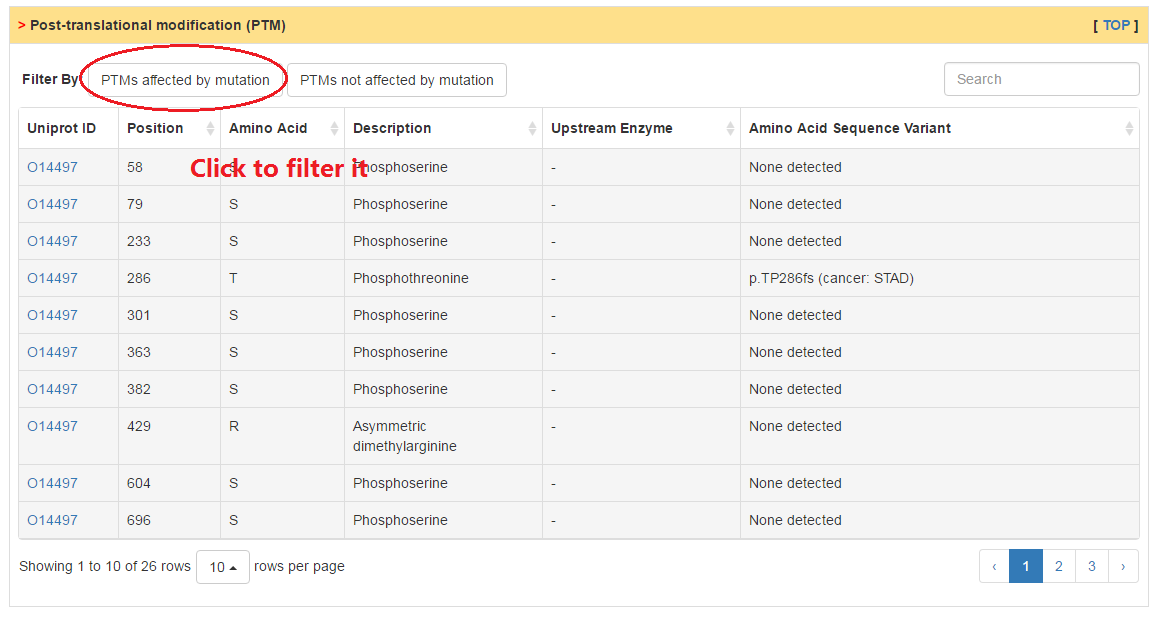 |
Users can check RNA expression level of CRs in normal and tumor tissue as well as cancer cell lines. Differential expression analysis are conducted for all cancers with more than 10 normal samples. The column of status show whether current CR is differentially expressed. The cutoff of logFC and adj. p value are 0.58 and 0.05, respectively.
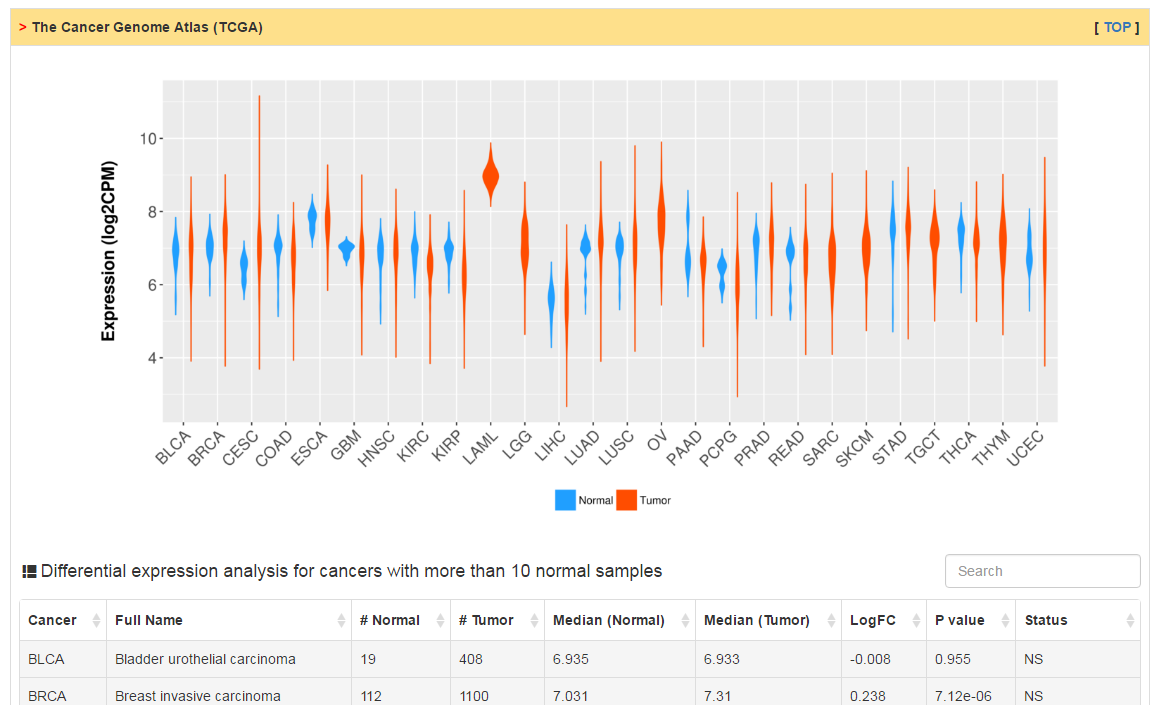 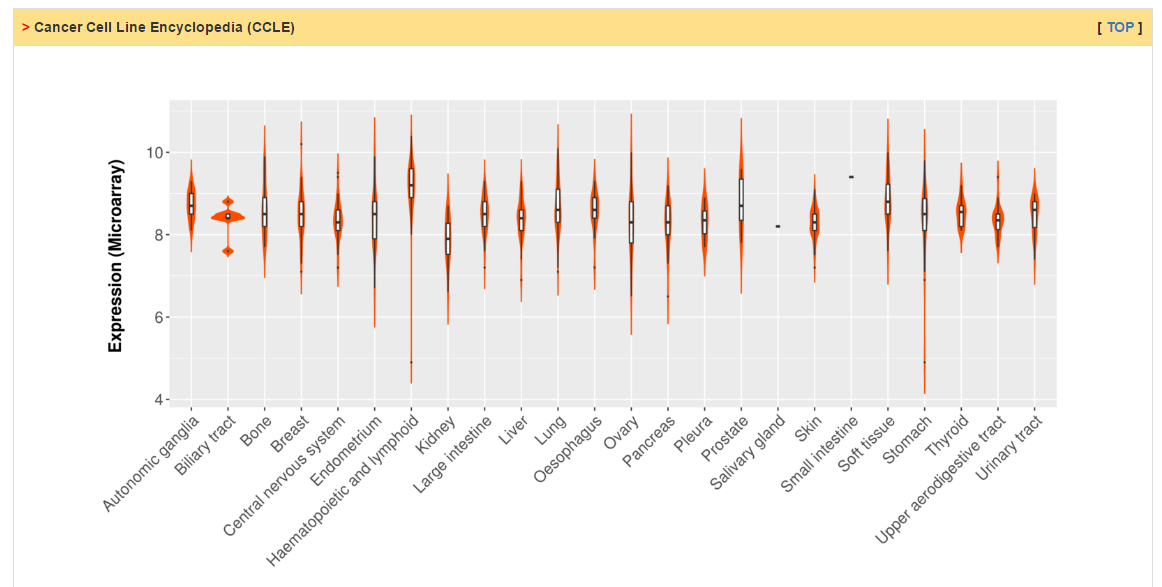   |
Users can explore the correlation between somatic copy number change and expression level. The columns of Loss, Neutral and Gain shows the percentage of patients with -1/2, 0 and +1/2 copy number threshold based on GISTIC output. The status of CR is decided by two steps: (1) There exists strong correlation (r > 0.3 and p value < 0.05) between mRNA levels and SCNA; (2) the percentage of Loss or Gain is greater than 33%. Click "+" to see more details.
  |
Users can explore the correlation between methylation and expression level. The column of delta beta value and p value (t test) shows the difference of methylation level between tumor and normal samples. The status of CR is decided by two steps: (1) There exists strong correlation (r < -0.3 and p value < 0.05) between mRNA levels and methylation; (2) The absolute value of delta beta value is greater than 0.2 and t test p value less than 0.05.
  |
This part shows proteomics data for primary tumor tissue from TCGA and normal tissue from HPA.
  |
We have correlated RNA expression level of CRs with clinical data (subtype, survival, stage and grade) in pancancer level. Click the "+" sign to check the visualization of analysis results.
   |
The putative targets of CRs are inferred by two strategies, mutual information based reverse engineering method and ChIP-Sequencing data analysis. Users can predict targets from different dataset through the top box.
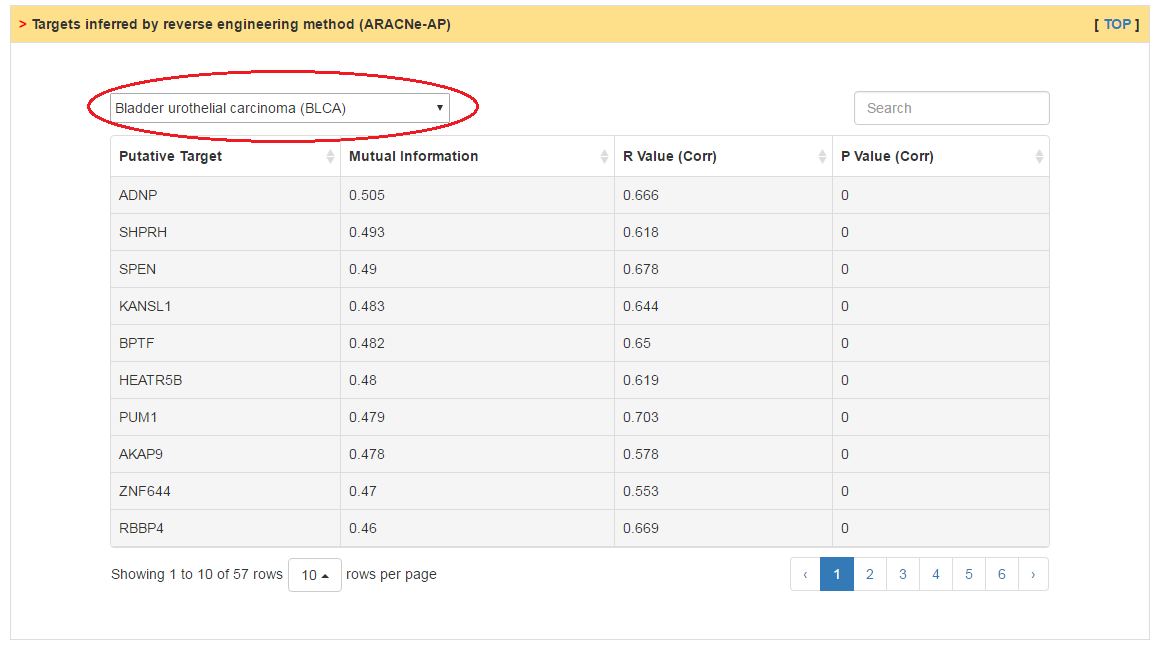 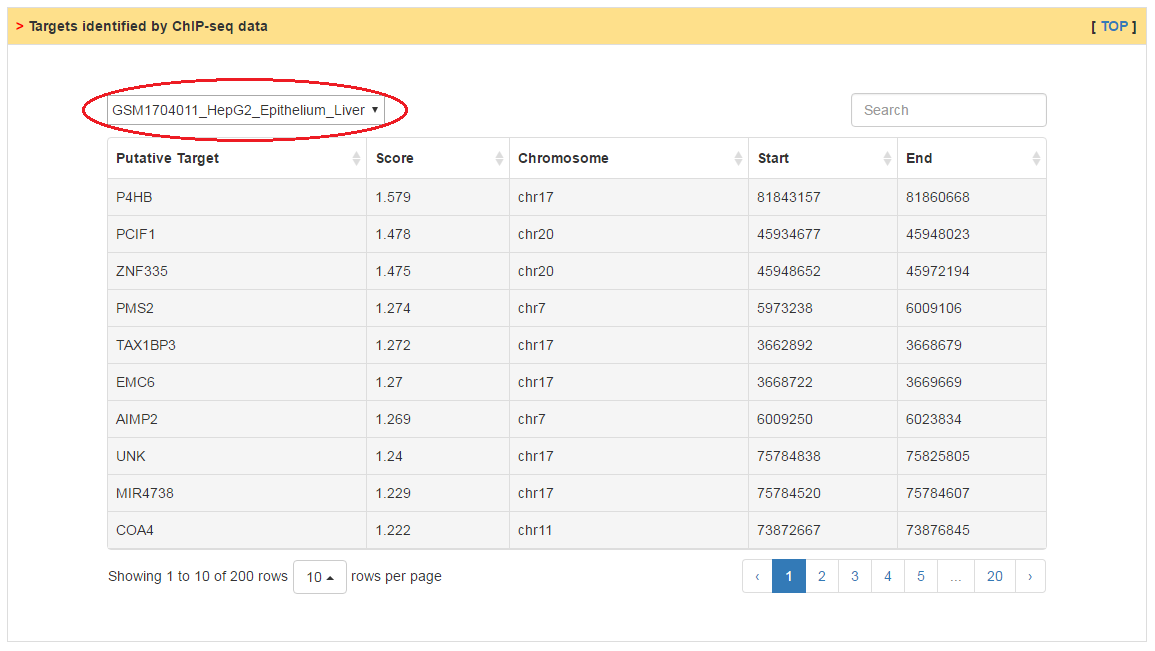 |
In this part, users can get drugs targeting the current CR as well as all targets of these drugs.
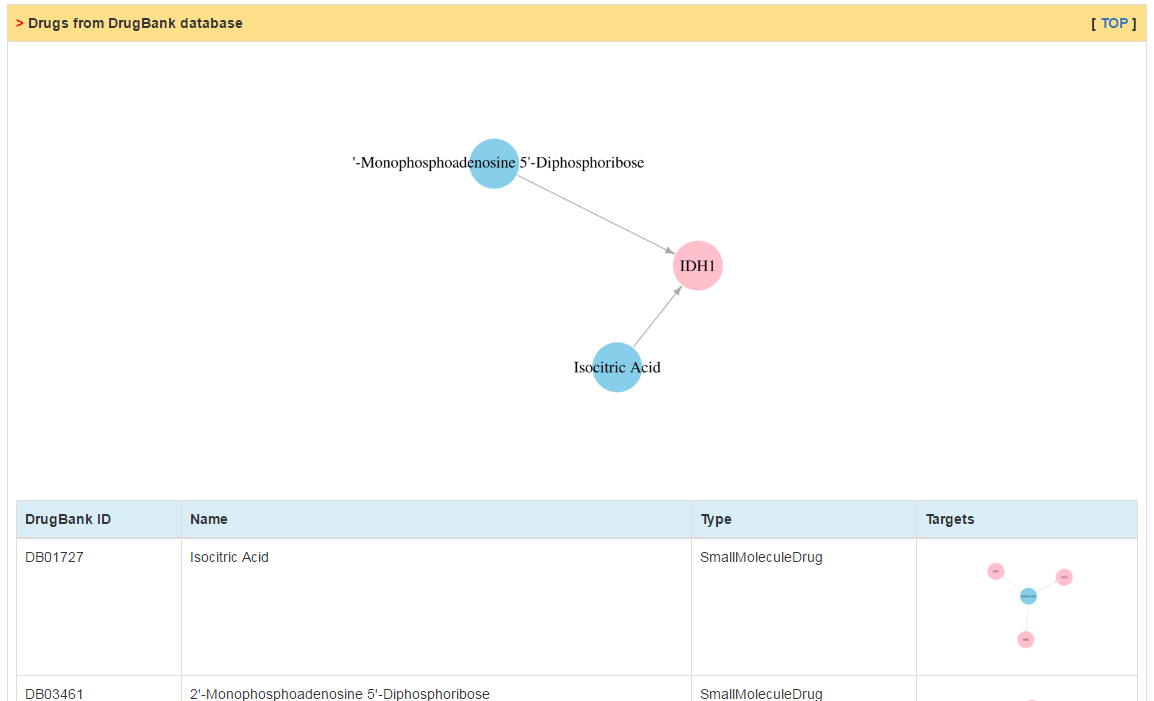 |
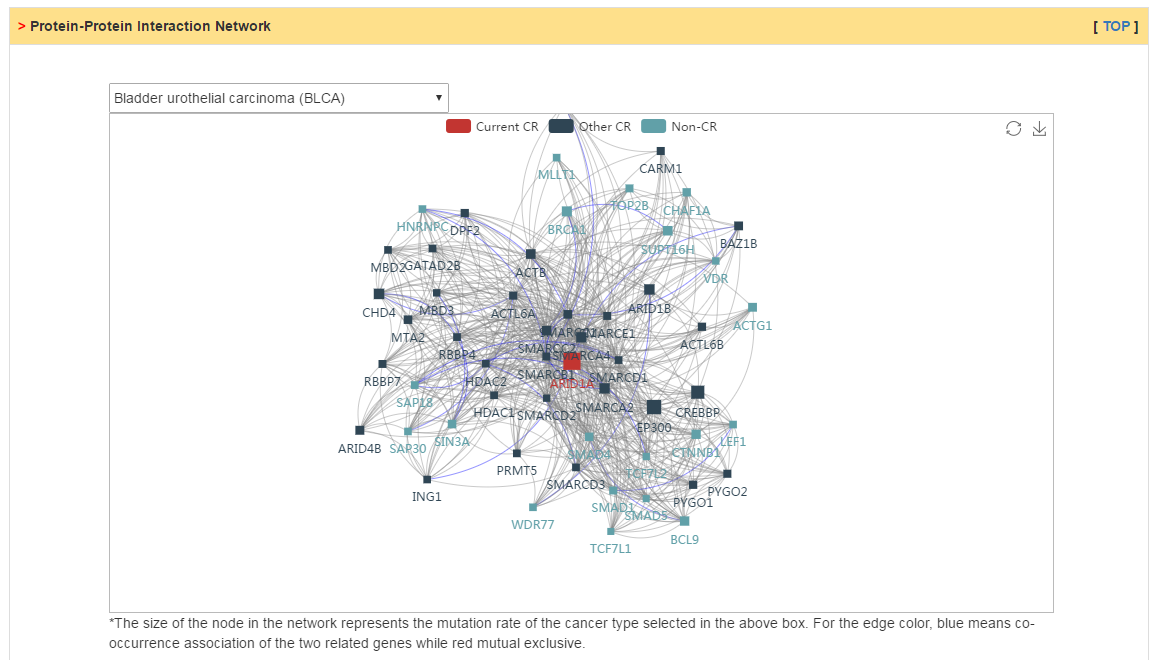
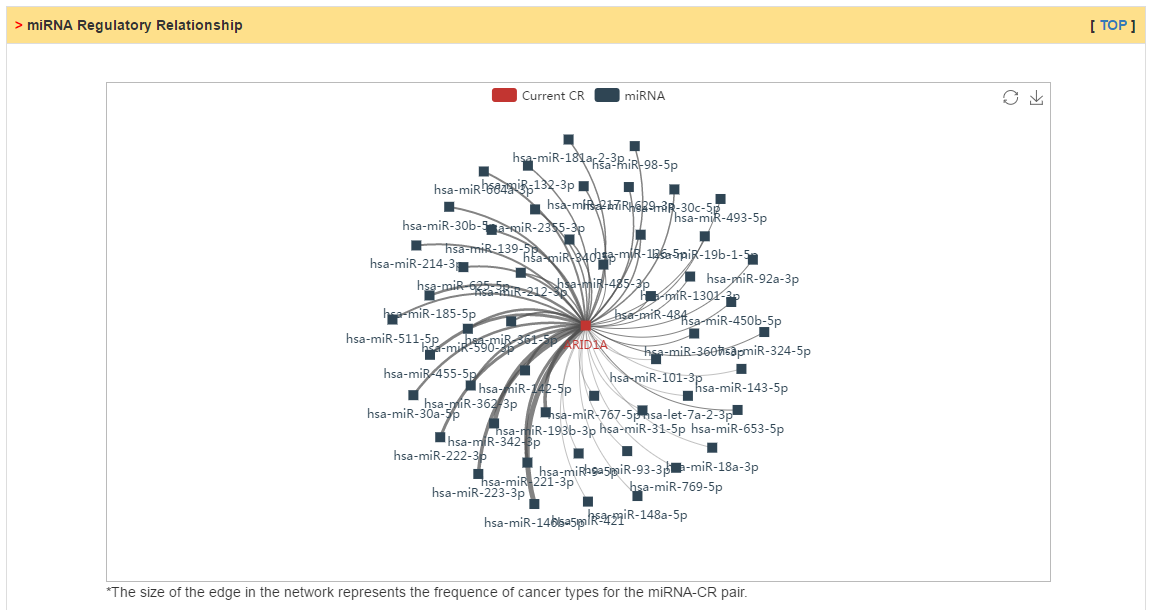
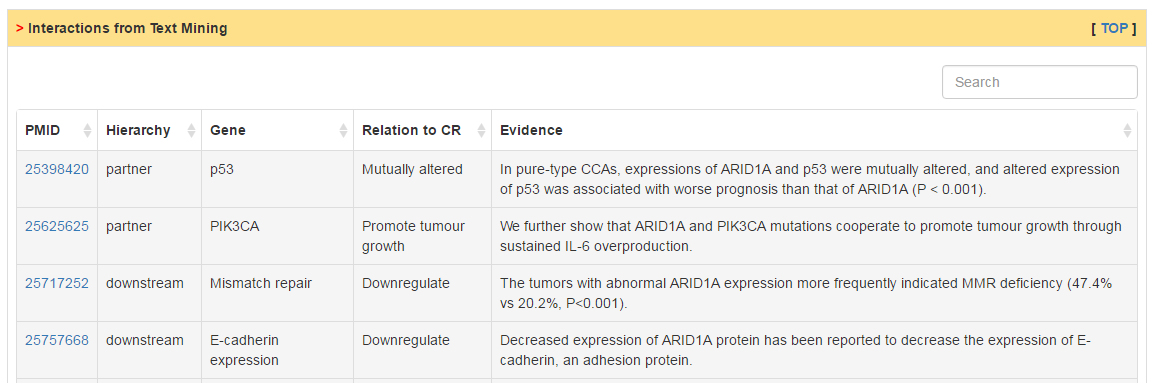
Users can explore three kinds of CR related interactions: (1) protein-protein interactions; (2) miRNA-CR regulatory relations; (3) text mining based interactions. In PPI network, mouseover on the node would show the mutation rate in selected cancer and edge color represent whether mutation of two genes is co-occurrence (blue) or mutual exclusive (red). In miRNA regulatory network, the edge means that the miRNA can target the CR by prediction of different sequence based method. The edge size represents the frequence of cancer types in which there exist negative correlation between miRNA and CR. Lastly, we also extracted relations refering by CR in cancer initiation and progression from literatures.
   |
  |
 |
 |
 |
 |
 |
|
3.1 Simple search: users can search CR based on basic terms such as gene symbol, ensembl ID and so on.
[ TOP ]
|
|---|
 |
 |
 |
   |
  |