Browse HDGFL2 in pancancer

Summary
SymbolHDGFL2
NameHDGF like 2
Aliases
Location19p13.3
External Links HGNC, NCBI, Ensembl, Uniprot, GeneCards
Cancer Gene Databases ONGene (Oncogene) , TSGene (Tumor suppressor gene) , NCG (Network of Cancer Genes)
Content > Domain, Function and Classification
> Gene Ontology
> KEGG and Reactome Pathway
> Domain, Function and Classification
 
Domain PF11467 Lens epithelium-derived growth factor (LEDGF)
PF00855 PWWP domain
Function

Involved in cellular growth control, through the regulation of cyclin D1 expression.

Classification
Class Modification Substrate Product PubMed
Histone modification read # H3K79me3, H4K20me3, H3K36me3 # 21720545
> Gene Ontology
 
Biological Process GO:0001558 regulation of cell growth
GO:0016049 cell growth
GO:0030307 positive regulation of cell growth
GO:0045927 positive regulation of growth
Molecular Function GO:0003682 chromatin binding
Cellular Component -
> KEGG and Reactome Pathway
 
KEGG -
Reactome -
Summary
SymbolHDGFL2
NameHDGF like 2
Aliases
Location19p13.3
External Links HGNC, NCBI, Ensembl, Uniprot, GeneCards
Cancer Gene Databases ONGene (Oncogene) , TSGene (Tumor suppressor gene) , NCG (Network of Cancer Genes)
Content > Mutation landscape in primary tumor tissue from TCGA
> Mutation landscape in cancer cell line from CCLE
> All mutations from COSMIC database V81
> Variations from text mining
> The Cancer Genome Atlas (TCGA)
 
> Cancer Cell Line Encyclopedia (CCLE)
 
There is no record.
> Catalogue of Somatic Mutations in Cancer (COSMIC)
 
There is no record for HDGFL2.
> Text Mining based Variations
 
There is no record for HDGFL2.
Summary
SymbolHDGFL2
NameHDGF like 2
Aliases
Location19p13.3
External Links HGNC, NCBI, Ensembl, Uniprot, GeneCards
Cancer Gene Databases ONGene (Oncogene) , TSGene (Tumor suppressor gene) , NCG (Network of Cancer Genes)
Content > Post-translational modification (PTM)
> Post-translational modification (PTM)
 
 Filter By:
Uniprot ID Position Amino Acid Description Upstream Enzyme Affected By Mutation Amino Acid Sequence Variant
Q7Z4V5370SPhosphoserine-NoNone detected
Q7Z4V5454SPhosphoserine-Yesp.S454A (cancer: UCEC)
Q7Z4V5458SPhosphoserine-NoNone detected
Q7Z4V5625SPhosphoserine-NoNone detected
Q7Z4V5633SPhosphoserine-NoNone detected
Q7Z4V5634SPhosphoserine-NoNone detected
Q7Z4V5640SPhosphoserine-NoNone detected
Q7Z4V5664SPhosphoserine-NoNone detected
Summary
SymbolHDGFL2
NameHDGF like 2
Aliases
Location19p13.3
External Links HGNC, NCBI, Ensembl, Uniprot, GeneCards
Cancer Gene Databases ONGene (Oncogene) , TSGene (Tumor suppressor gene) , NCG (Network of Cancer Genes)
Content > Expression analysis in primary tumor tissue from TCGA
> Expression level in cancer cell line from CCLE
> Expression level in human normal tissue from HPA
> Text mining based expression change
> The Cancer Genome Atlas (TCGA)


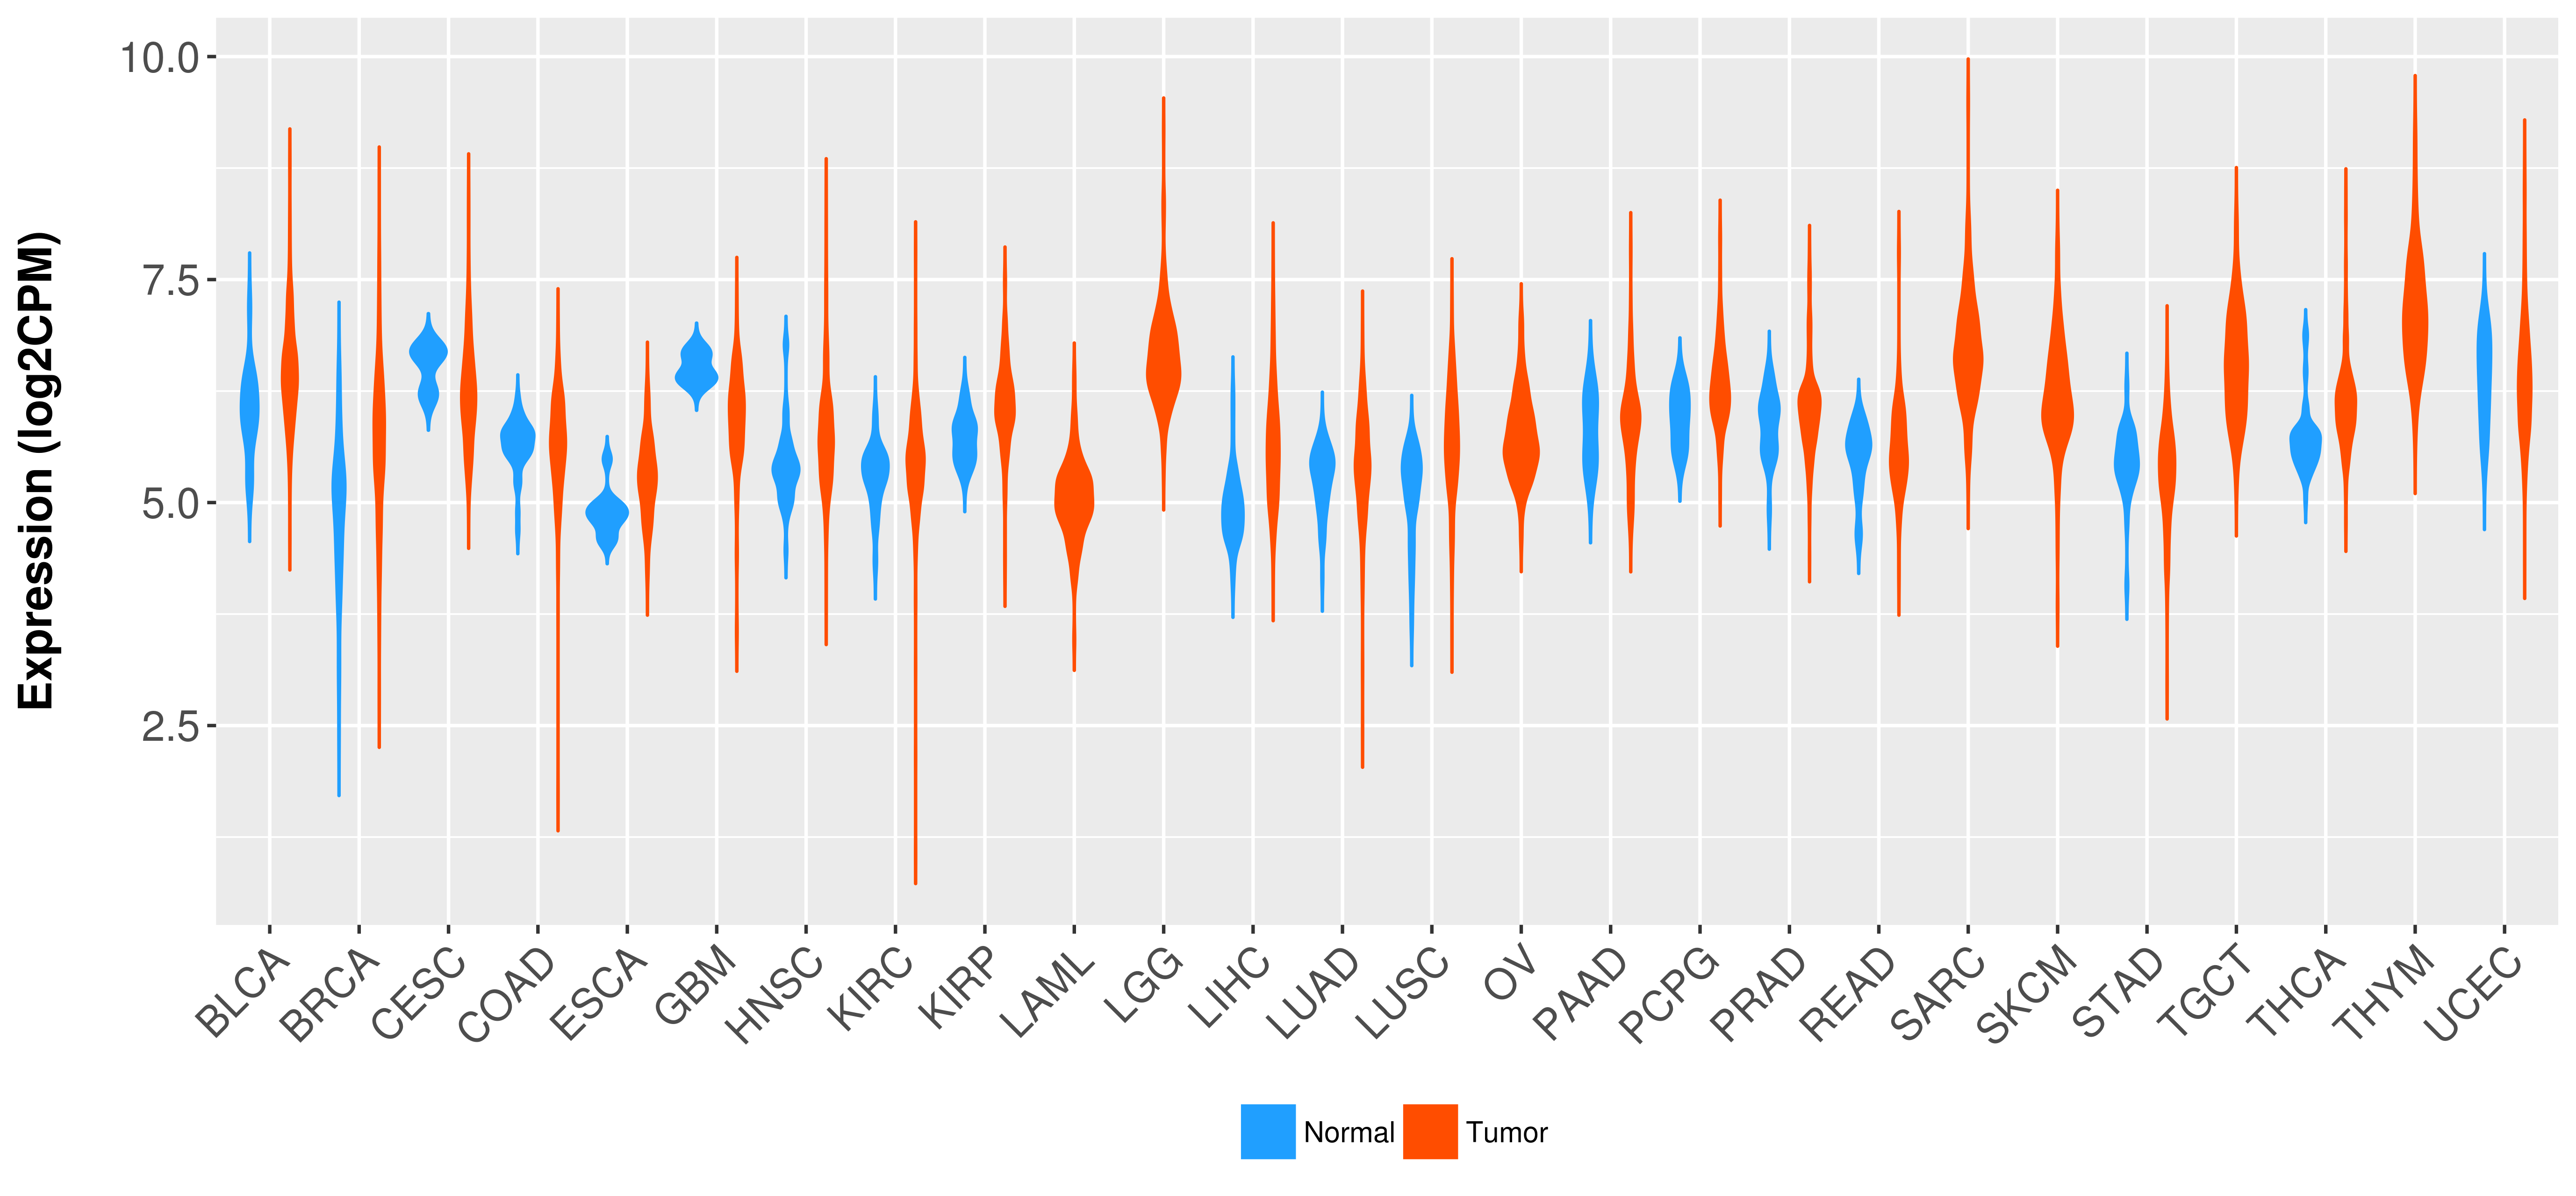
  Differential expression analysis for cancers with more than 10 normal samples
Cancer Full Name # N # T Median (N) Median (T) LogFC Adj. P Status
BLCABladder urothelial carcinoma194085.9936.4260.4470.00144NS
BRCABreast invasive carcinoma11211005.0775.7290.7472.11e-20Over
CESCCervical and endocervical cancers33066.6716.192NANANA
COADColon adenocarcinoma414595.6935.680.0030.978NS
ESCAEsophageal carcinoma111854.885.2820.3990.0122NS
GBMGlioblastoma multiforme51666.4235.975NANANA
HNSCHead and Neck squamous cell carcinoma445225.3695.6980.3410.000592NS
KIRCKidney renal clear cell carcinoma725345.3355.4540.1460.029NS
KIRPKidney renal papillary cell carcinoma322915.7366.0830.3699.23e-05NS
LAMLAcute Myeloid Leukemia0173NA5.033NANANA
LGGBrain Lower Grade Glioma0530NA6.573NANANA
LIHCLiver hepatocellular carcinoma503734.9055.580.6825.03e-13Over
LUADLung adenocarcinoma595175.3635.4520.170.0296NS
LUSCLung squamous cell carcinoma515015.2825.6980.5813.82e-11Over
OVOvarian serous cystadenocarcinoma0307NA5.674NANANA
PAADPancreatic adenocarcinoma41795.8285.92NANANA
PCPGPheochromocytoma and Paraganglioma31845.9656.257NANANA
PRADProstate adenocarcinoma524985.9476.0350.1670.0227NS
READRectum adenocarcinoma101675.6065.5590.0950.623NS
SARCSarcoma22636.2116.665NANANA
SKCMSkin Cutaneous Melanoma14725.9946.148NANANA
STADStomach adenocarcinoma354155.4685.367-0.1290.218NS
TGCTTesticular Germ Cell Tumors0156NA6.545NANANA
THCAThyroid carcinoma595095.6766.0760.3872.8e-09NS
THYMThymoma21206.5187.094NANANA
UCECUterine Corpus Endometrial Carcinoma355466.4546.315-0.0130.918NS
> Cancer Cell Line Encyclopedia (CCLE)
 

There is no record.
> The Human Protein Atlas (HPA)


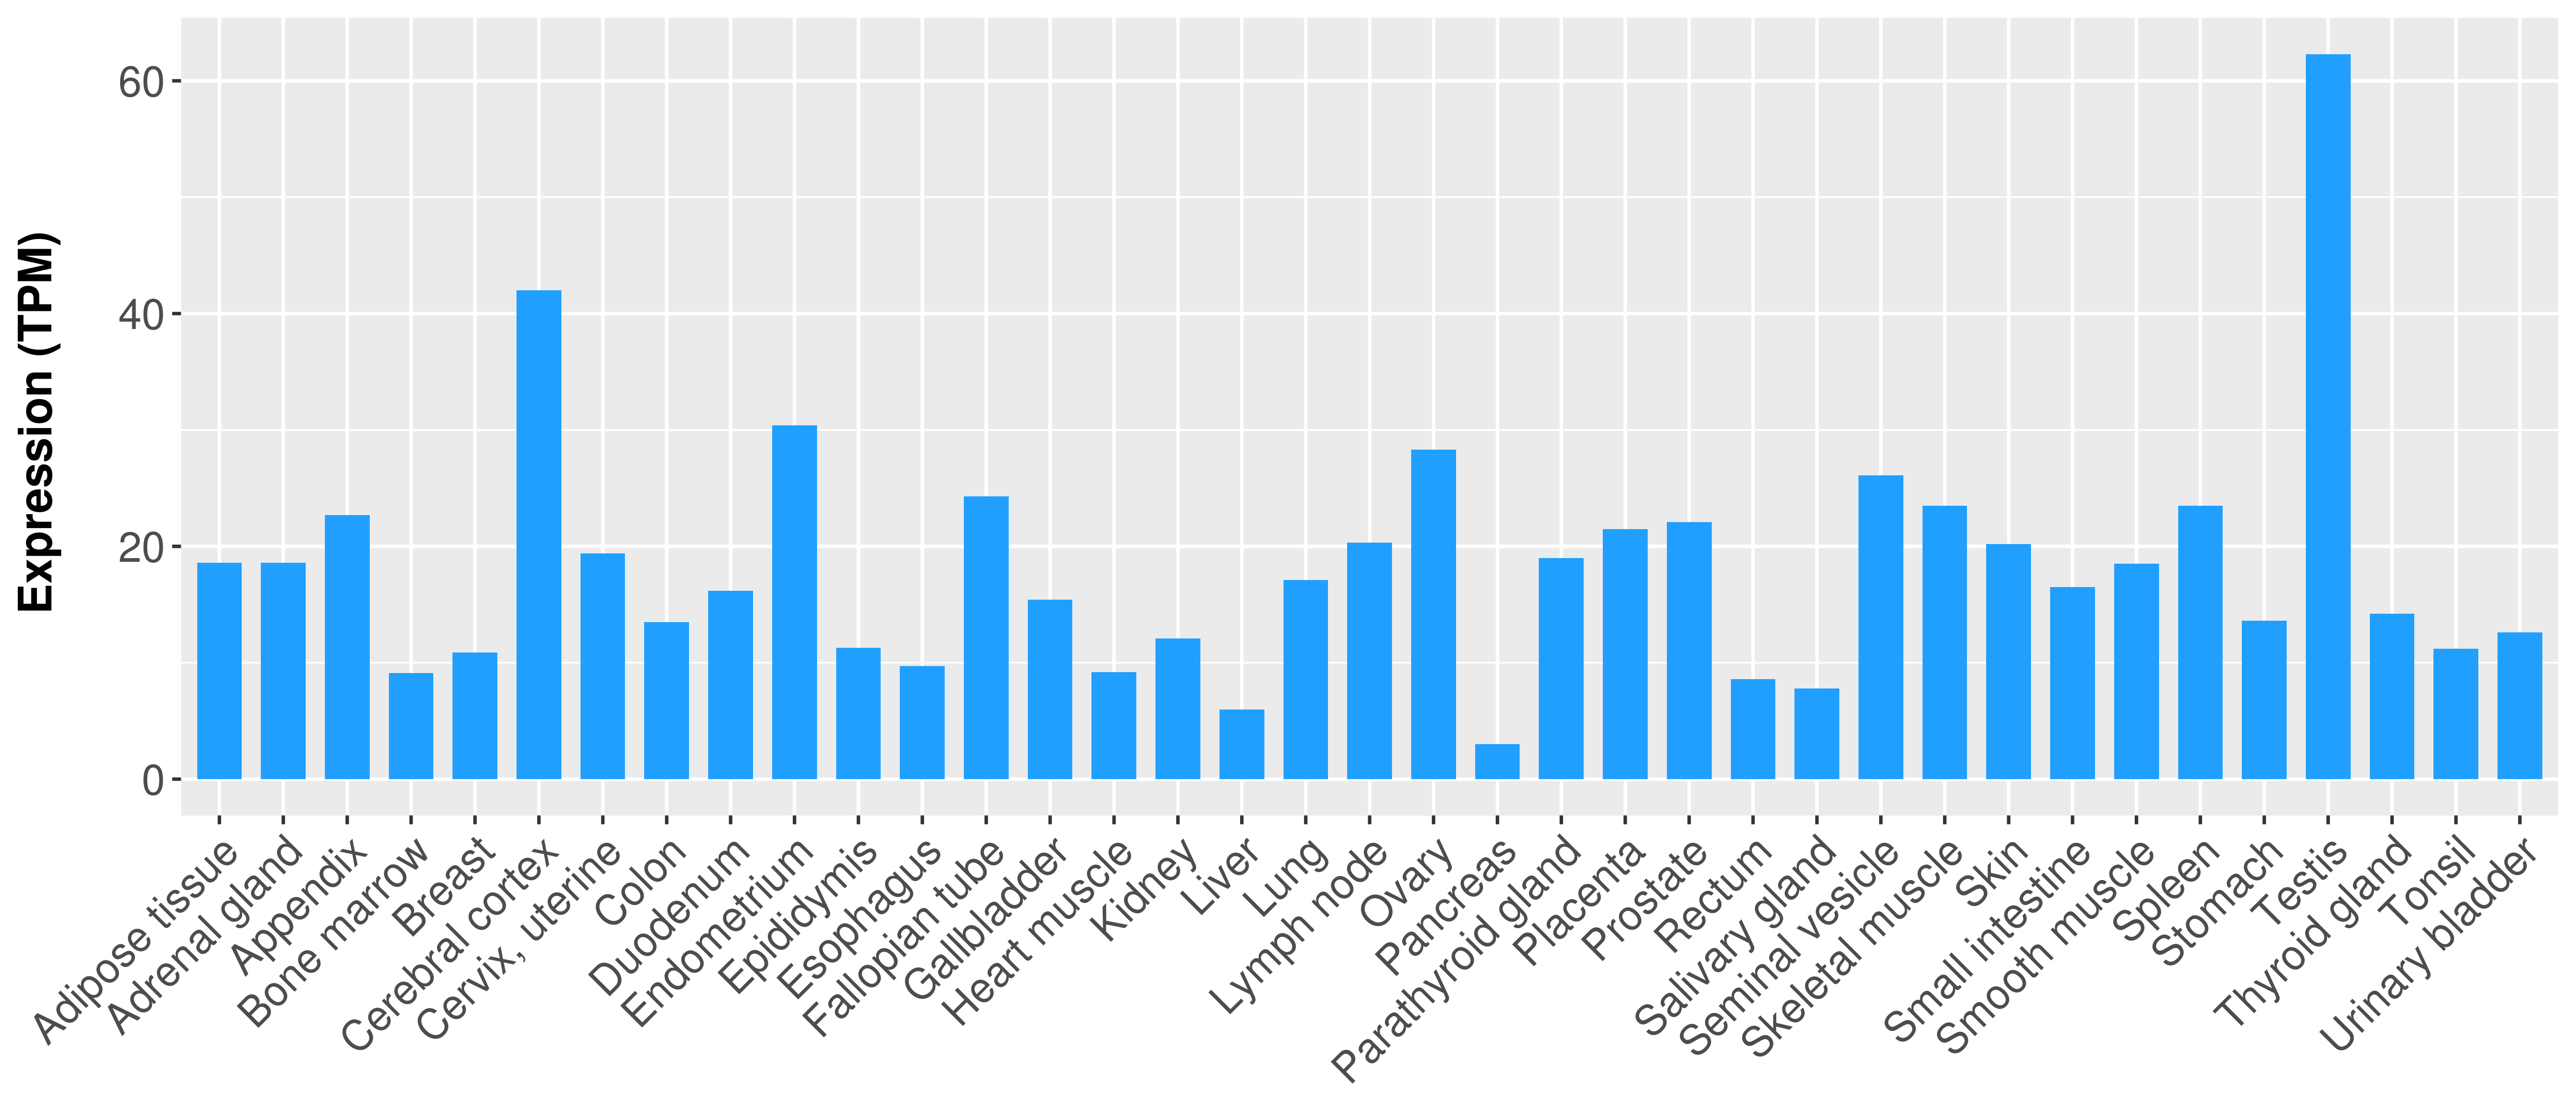
Tissue Expression Level (TPM)
Adipose tissue 18.6
Adrenal gland 18.6
Appendix 22.7
Bone marrow 9.1
Breast 10.9
Cerebral cortex 42
Cervix, uterine 19.4
Colon 13.5
Duodenum 16.2
Endometrium 30.4
Epididymis 11.3
Esophagus 9.7
Fallopian tube 24.3
Gallbladder 15.4
Heart muscle 9.2
Kidney 12.1
Liver 6
Lung 17.1
Lymph node 20.3
Ovary 28.3
Pancreas 3
Parathyroid gland 19
Placenta 21.5
Prostate 22.1
Rectum 8.6
Salivary gland 7.8
Seminal vesicle 26.1
Skeletal muscle 23.5
Skin 20.2
Small intestine 16.5
Smooth muscle 18.5
Spleen 23.5
Stomach 13.6
Testis 62.3
Thyroid gland 14.2
Tonsil 11.2
Urinary bladder 12.6
> Text Mining based Expression
 
There is no record.
Summary
SymbolHDGFL2
NameHDGF like 2
Aliases
Location19p13.3
External Links HGNC, NCBI, Ensembl, Uniprot, GeneCards
Cancer Gene Databases ONGene (Oncogene) , TSGene (Tumor suppressor gene) , NCG (Network of Cancer Genes)
Content > Somatic copy number alteration in primary tomur tissue
> The Cancer Genome Atlas (TCGA)


  Correlation between expression and SCNA as well as percentage of patients in different status.
Cancer Full Name # Sample R P % Loss % Neutral % Gain Status
BLCABladder urothelial carcinoma4040.4437.35e-2134.450.714.9Loss
BRCABreast invasive carcinoma10750.3016.48e-2427.857.614.6Neutral
CESCCervical and endocervical cancers2920.5291.81e-2234.654.810.6Loss
COADColon adenocarcinoma4490.3213.32e-1213.171.715.1Neutral
ESCAEsophageal carcinoma1830.5252.23e-1447.539.313.1Loss
GBMGlioblastoma multiforme1470.3919.95e-078.855.835.4Gain
HNSCHead and Neck squamous cell carcinoma5140.393.68e-2029.261.39.5Neutral
KIRCKidney renal clear cell carcinoma5250.0370.392388.28.8Neutral
KIRPKidney renal papillary cell carcinoma2880.1730.003267.6911.4Neutral
LAMLAcute Myeloid Leukemia1660.2560.0008842.494.63Neutral
LGGBrain Lower Grade Glioma5130.2752.44e-104.373.522.2Neutral
LIHCLiver hepatocellular carcinoma3640.4141.68e-1623.462.913.7Neutral
LUADLung adenocarcinoma5120.2384.81e-0853.742.63.7Loss
LUSCLung squamous cell carcinoma4980.4036.76e-2142.24017.9Loss
OVOvarian serous cystadenocarcinoma3000.5721.82e-2783.710.36Loss
PAADPancreatic adenocarcinoma1770.2560.00059818.675.16.2Neutral
PCPGPheochromocytoma and Paraganglioma1620.2030.009590.684.614.8Neutral
PRADProstate adenocarcinoma4910.1815.25e-057.590.81.6Neutral
READRectum adenocarcinoma1640.4892.99e-1121.360.418.3Neutral
SARCSarcoma2550.3974.84e-1114.547.837.6Gain
SKCMSkin Cutaneous Melanoma3670.3823.17e-1425.158.316.6Neutral
STADStomach adenocarcinoma4130.2941.12e-0937.356.26.5Loss
TGCTTesticular Germ Cell Tumors150-0.0820.31831.344.724Neutral
THCAThyroid carcinoma4970.2311.83e-071.6971.4Neutral
THYMThymoma1190.030.7453.494.12.5Neutral
UCECUterine Corpus Endometrial Carcinoma5370.2532.7e-0928.169.32.6Neutral
Summary
SymbolHDGFL2
NameHDGF like 2
Aliases
Location19p13.3
External Links HGNC, NCBI, Ensembl, Uniprot, GeneCards
Cancer Gene Databases ONGene (Oncogene) , TSGene (Tumor suppressor gene) , NCG (Network of Cancer Genes)
Content > Methylation level in the promoter region of CR
> Methylation level in the promoter region of CR
 
There is no record.
Summary
SymbolHDGFL2
NameHDGF like 2
Aliases
Location19p13.3
External Links HGNC, NCBI, Ensembl, Uniprot, GeneCards
Cancer Gene Databases ONGene (Oncogene) , TSGene (Tumor suppressor gene) , NCG (Network of Cancer Genes)
Content > Primary tumor tissue from TCGA
> Normal tumor tissue from HPA
>The Cancer Genome Atlas (TCGA)
 
There is no record.
> The Human Protein Atlas (HPA)


Tissue Level Level Name
Adrenal gland 3 High
Appendix 3 High
Bone marrow 1 Low
Breast 3 High
Bronchus 3 High
Caudate 3 High
Cerebellum 3 High
Cerebral cortex 3 High
Cervix, uterine 3 High
Colon 3 High
Duodenum 3 High
Endometrium 3 High
Epididymis 3 High
Esophagus 3 High
Fallopian tube 3 High
Gallbladder 3 High
Heart muscle 3 High
Hippocampus 3 High
Kidney 3 High
Liver 3 High
Lung 3 High
Lymph node 3 High
Nasopharynx 3 High
Oral mucosa 3 High
Ovary 3 High
Pancreas 3 High
Parathyroid gland 3 High
Placenta 3 High
Prostate 3 High
Rectum 3 High
Salivary gland 3 High
Seminal vesicle 3 High
Skeletal muscle 3 High
Skin 3 High
Small intestine 3 High
Smooth muscle 2 Medium
Soft tissue 3 High
Spleen 3 High
Stomach 3 High
Testis 3 High
Thyroid gland 3 High
Tonsil 3 High
Urinary bladder 3 High
Vagina 3 High
Summary
SymbolHDGFL2
NameHDGF like 2
Aliases
Location19p13.3
External Links HGNC, NCBI, Ensembl, Uniprot, GeneCards
Cancer Gene Databases ONGene (Oncogene) , TSGene (Tumor suppressor gene) , NCG (Network of Cancer Genes)
Content > Association between expresson and subtype
> Overall survival analysis based on expression
> Association between expresson and stage
> Association between expresson and grade
> Subtype


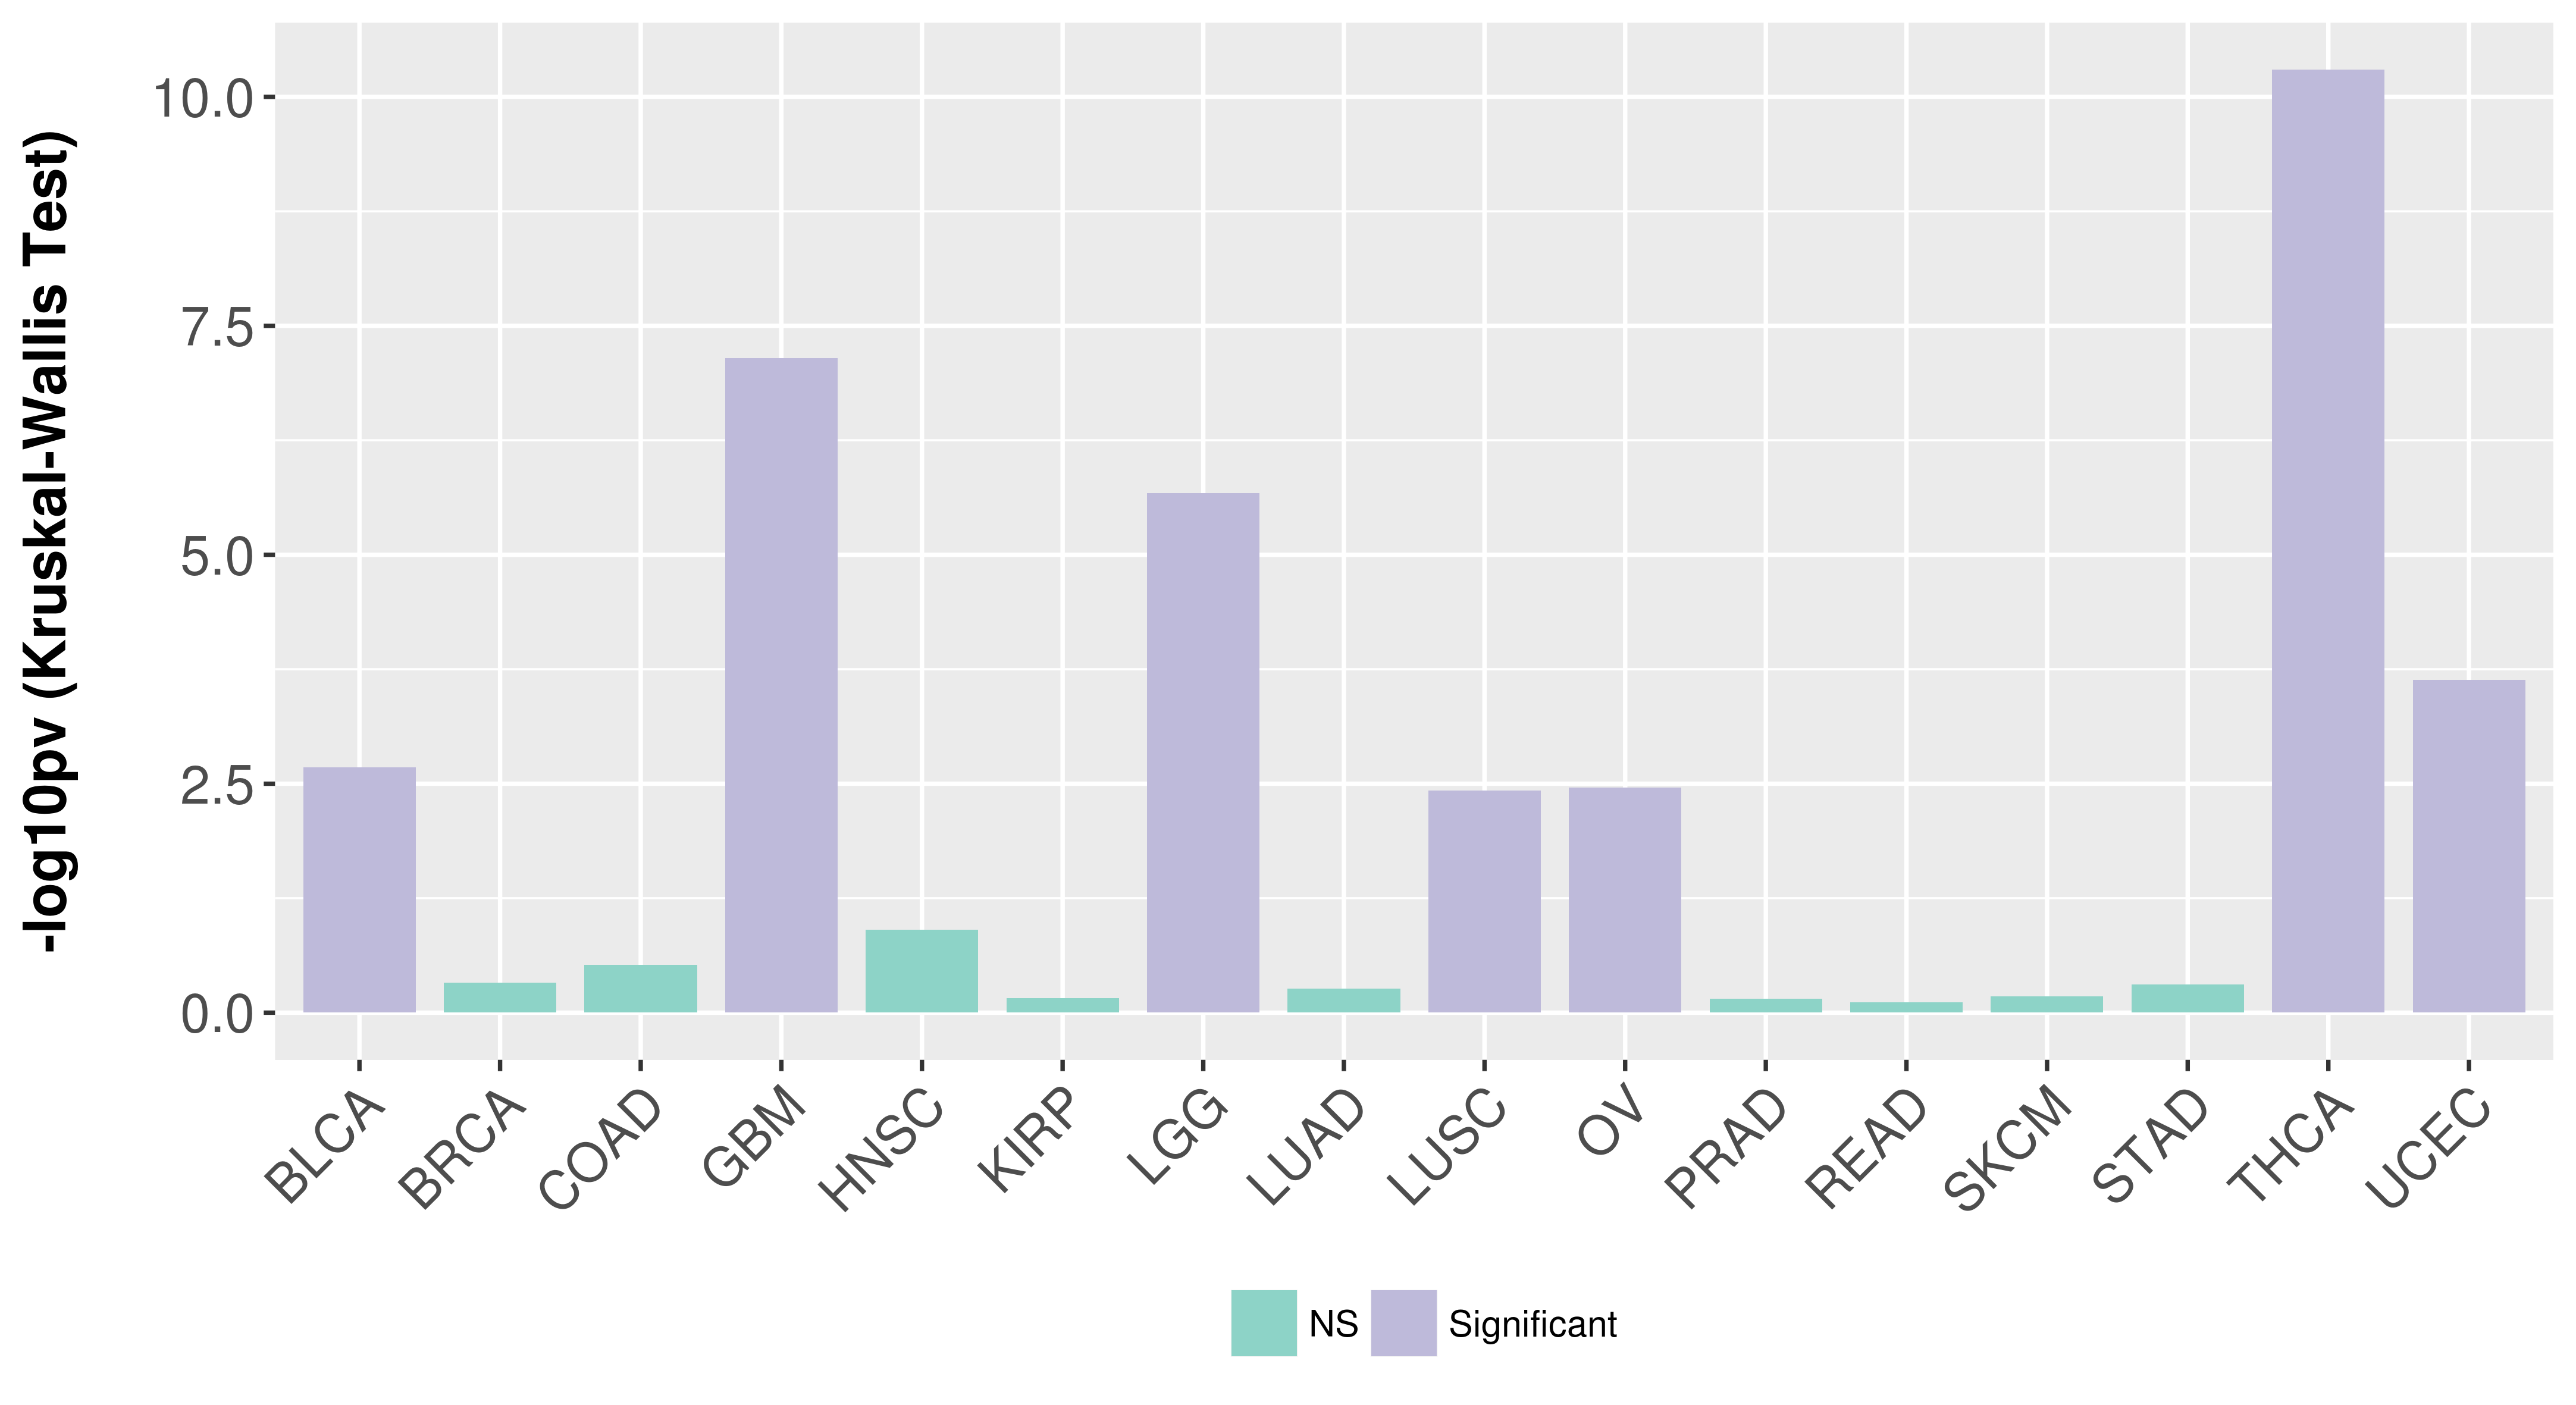
  Association between expresson and subtype.
Cancer Full Name # Patients P Value (Kruskal-Wallis) Association Source
BLCABladder urothelial carcinoma1280.00211Significant24476821
BRCABreast invasive carcinoma5210.467NS23000897
COADColon adenocarcinoma1490.301NS22810696
GBMGlioblastoma multiforme1577.11e-08Significant26824661
HNSCHead and Neck squamous cell carcinoma2790.124NS25631445
KIRPKidney renal papillary cell carcinoma1610.691NS26536169
LGGBrain Lower Grade Glioma5132.13e-06Significant26824661
LUADLung adenocarcinoma2300.549NS25079552
LUSCLung squamous cell carcinoma1780.00373Significant22960745
OVOvarian serous cystadenocarcinoma2870.0035Significant21720365
PRADProstate adenocarcinoma3330.708NS26544944
READRectum adenocarcinoma670.775NS22810696
SKCMSkin Cutaneous Melanoma3150.663NS26091043
STADStomach adenocarcinoma2770.49NS25079317
THCAThyroid carcinoma3915.06e-11Significant25417114
UCECUterine Corpus Endometrial Carcinoma2320.000233Significant23636398
> Overall survival
 

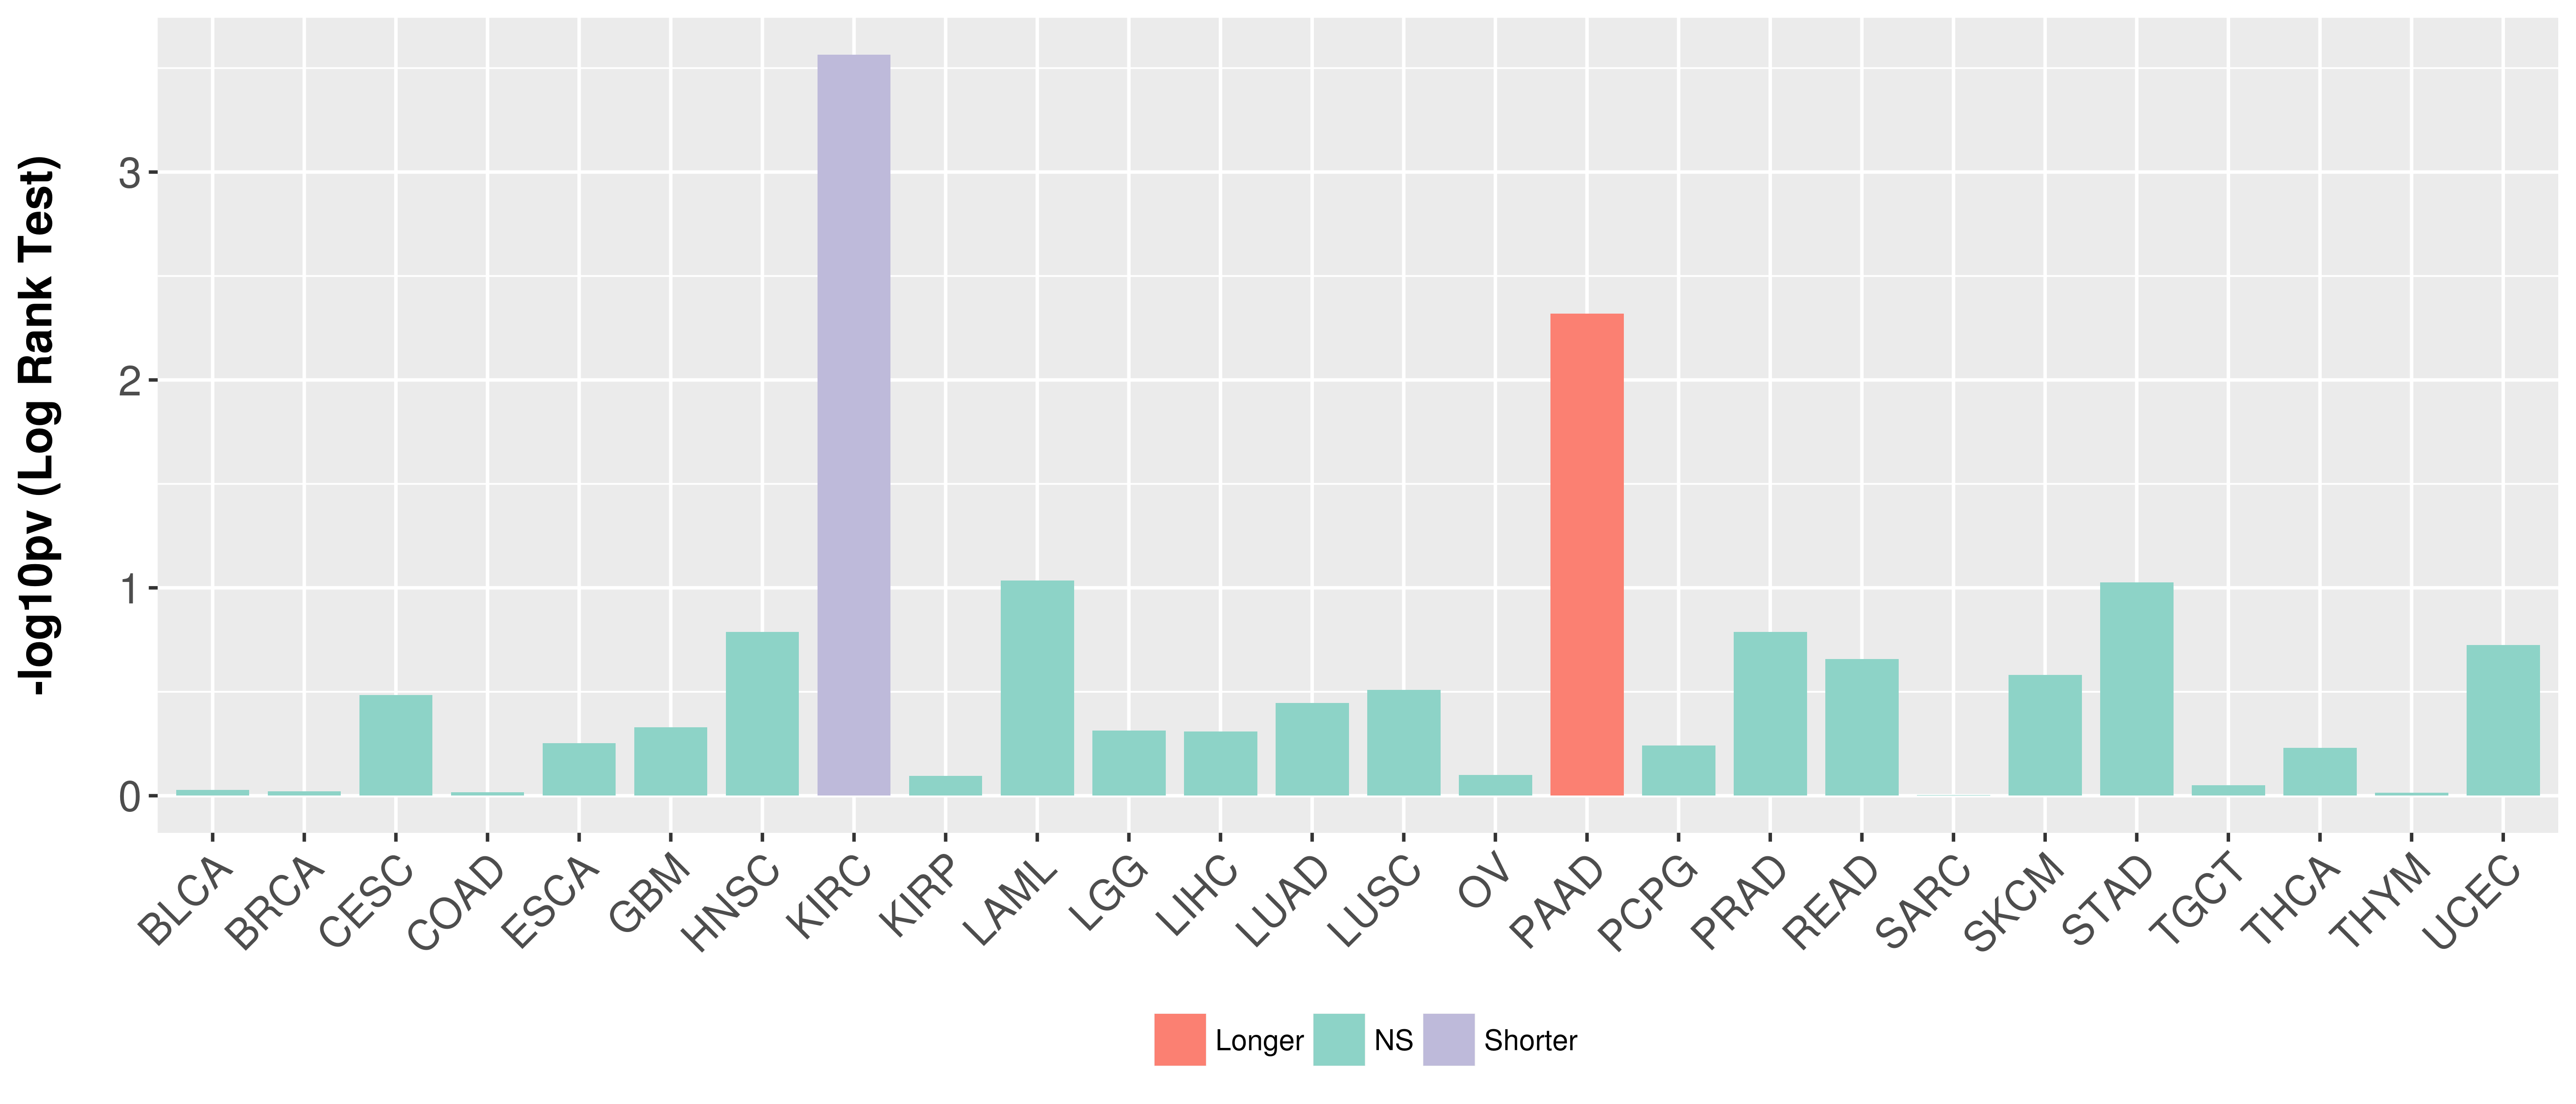
  Overall survival analysis based on expression.
Cancer Full Name # Patients Hazard Ratio P Value (Log Rank Test) Association
BLCABladder urothelial carcinoma405 0.9850.94NS
BRCABreast invasive carcinoma1079 0.9860.95NS
CESCCervical and endocervical cancers291 0.6920.328NS
COADColon adenocarcinoma439 0.9850.96NS
ESCAEsophageal carcinoma184 0.8210.558NS
GBMGlioblastoma multiforme158 0.8310.469NS
HNSCHead and Neck squamous cell carcinoma518 0.7540.163NS
KIRCKidney renal clear cell carcinoma531 2.1990.000273Shorter
KIRPKidney renal papillary cell carcinoma287 0.8930.803NS
LAMLAcute Myeloid Leukemia149 1.5930.092NS
LGGBrain Lower Grade Glioma511 0.8470.485NS
LIHCLiver hepatocellular carcinoma365 1.1920.49NS
LUADLung adenocarcinoma502 1.220.358NS
LUSCLung squamous cell carcinoma494 0.8220.309NS
OVOvarian serous cystadenocarcinoma303 1.0550.793NS
PAADPancreatic adenocarcinoma177 0.440.00479Longer
PCPGPheochromocytoma and Paraganglioma179 1.9730.572NS
PRADProstate adenocarcinoma497 4.2130.163NS
READRectum adenocarcinoma159 1.9390.22NS
SARCSarcoma259 1.0010.995NS
SKCMSkin Cutaneous Melanoma459 1.2330.263NS
STADStomach adenocarcinoma388 0.7010.0941NS
TGCTTesticular Germ Cell Tumors134 0.8220.889NS
THCAThyroid carcinoma500 0.710.589NS
THYMThymoma119 1.0610.967NS
UCECUterine Corpus Endometrial Carcinoma543 0.6790.188NS
> Stage
 

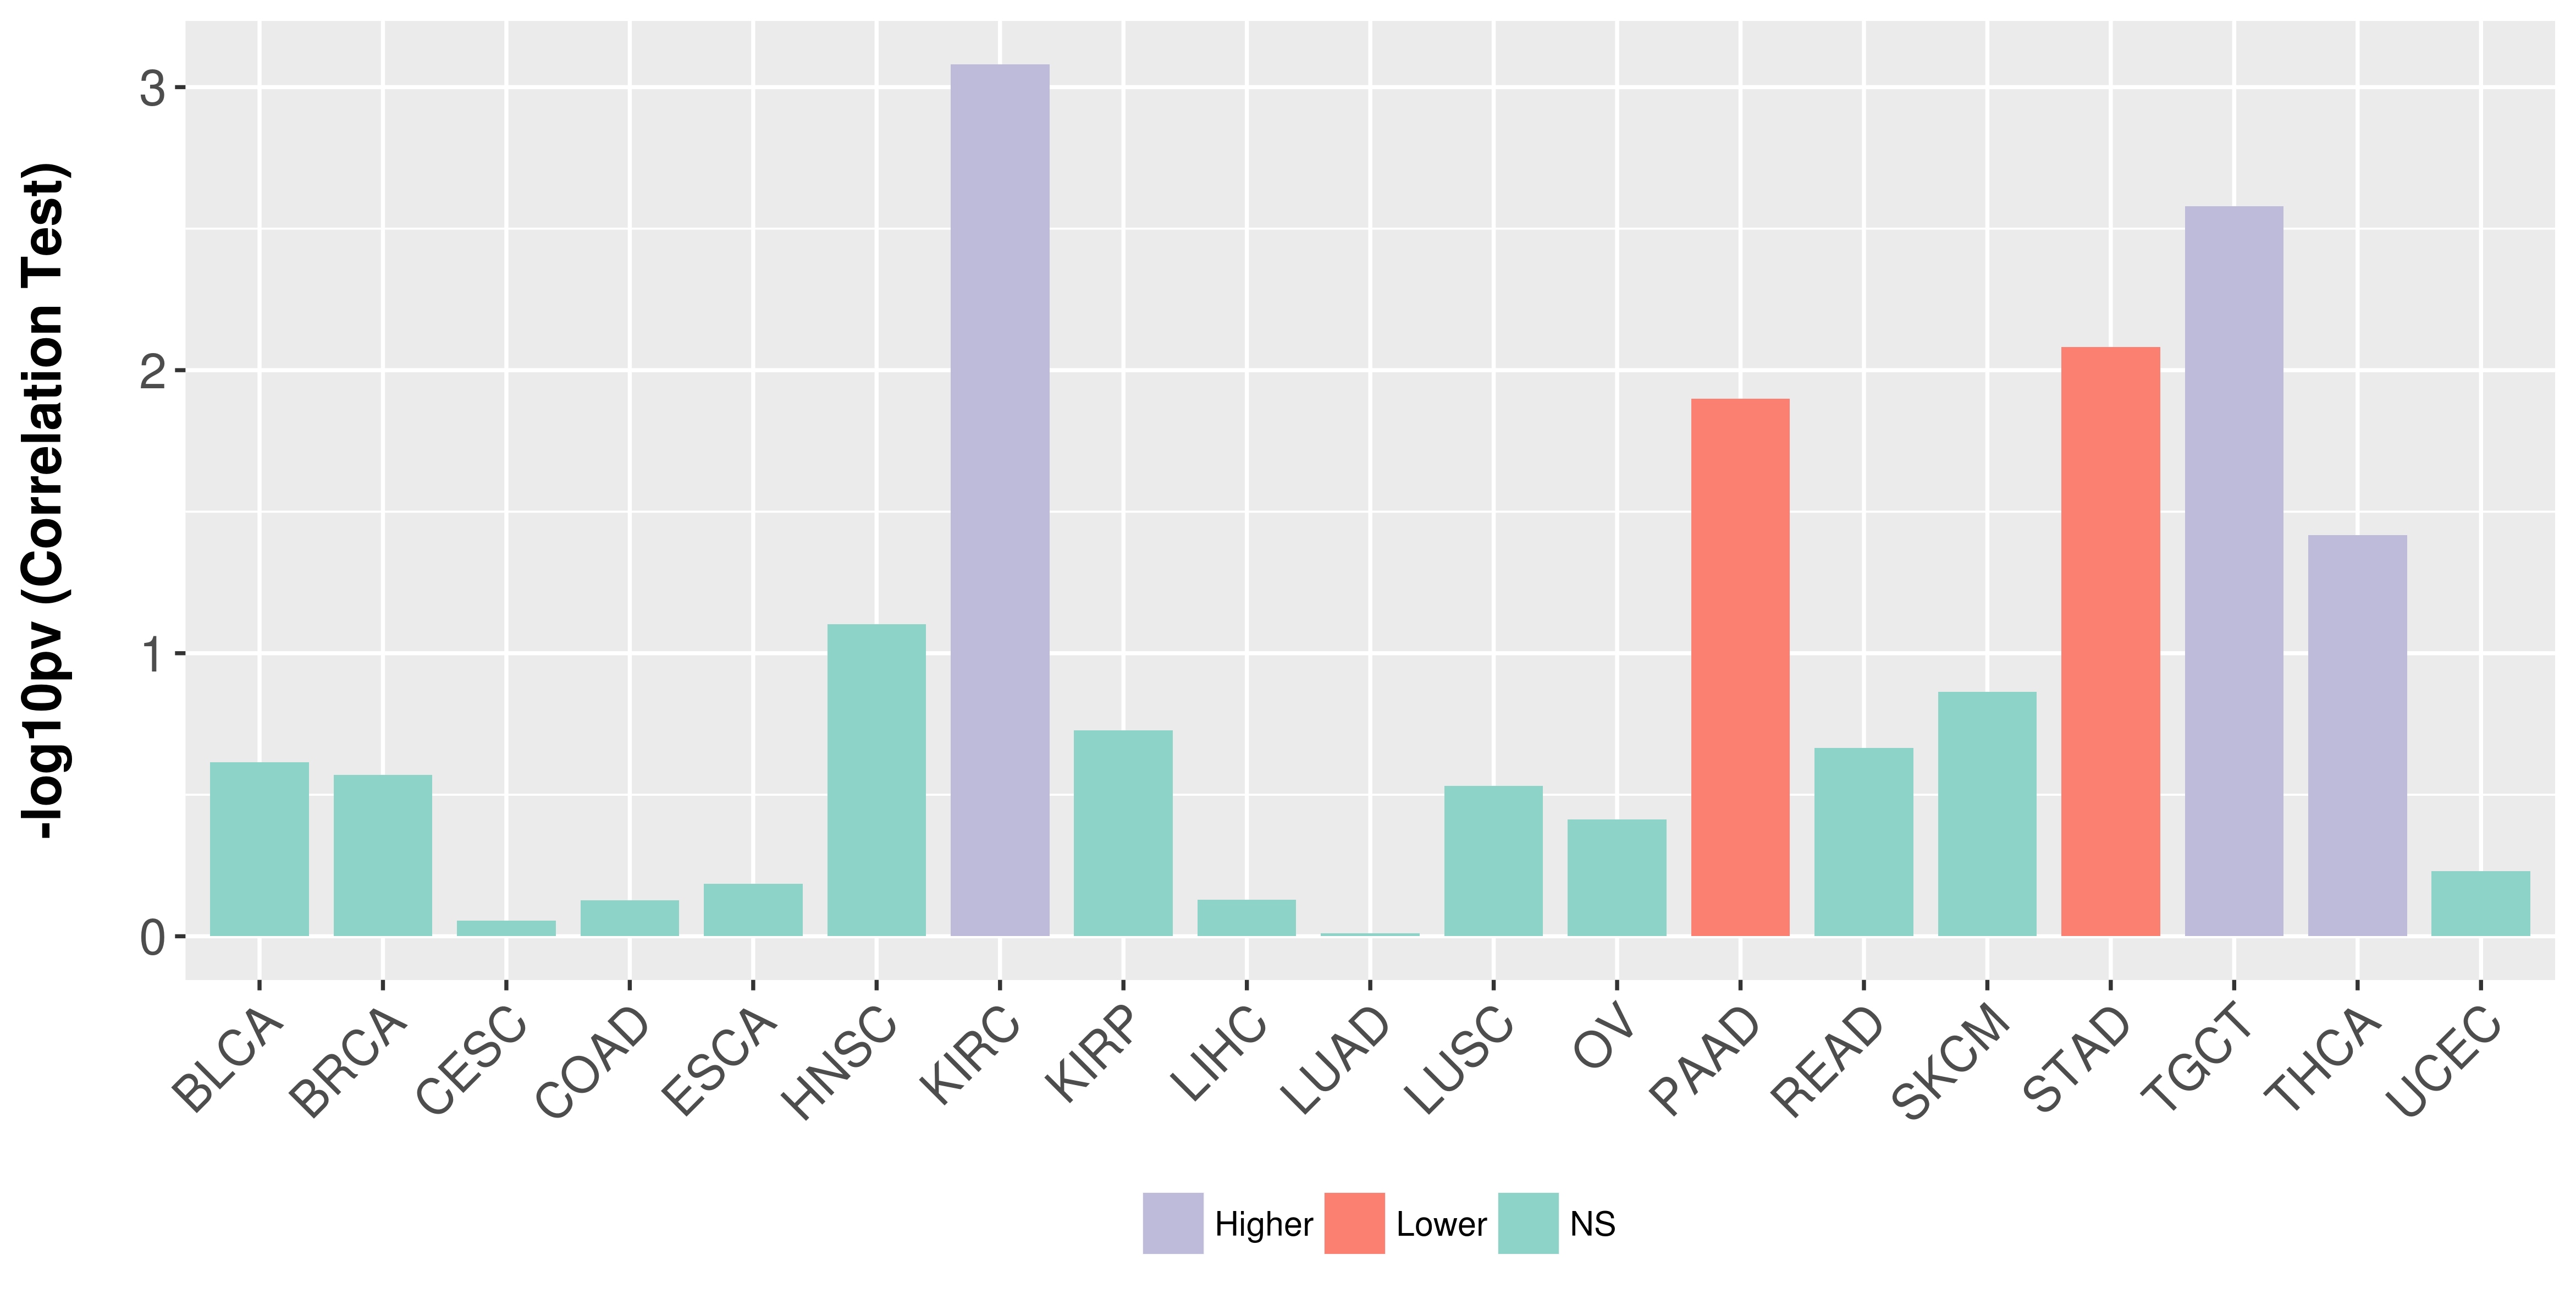
  Association between expresson and stage.
Cancer Full Name # Patients R Value (Spearman) P Value (Spearman) Association
BLCABladder urothelial carcinoma406 -0.0580.243NS
BRCABreast invasive carcinoma1071 0.0340.269NS
CESCCervical and endocervical cancers167 0.0120.881NS
COADColon adenocarcinoma445 0.0150.747NS
ESCAEsophageal carcinoma162 -0.0360.653NS
HNSCHead and Neck squamous cell carcinoma448 0.0830.079NS
KIRCKidney renal clear cell carcinoma531 0.1450.000832Higher
KIRPKidney renal papillary cell carcinoma260 0.0820.187NS
LIHCLiver hepatocellular carcinoma347 -0.0180.742NS
LUADLung adenocarcinoma507 -0.0010.978NS
LUSCLung squamous cell carcinoma497 0.0470.294NS
OVOvarian serous cystadenocarcinoma302 -0.050.386NS
PAADPancreatic adenocarcinoma176 -0.1880.0126Lower
READRectum adenocarcinoma156 0.10.216NS
SKCMSkin Cutaneous Melanoma410 -0.0740.137NS
STADStomach adenocarcinoma392 -0.1330.0083Lower
TGCTTesticular Germ Cell Tumors81 0.330.00264Higher
THCAThyroid carcinoma499 0.0930.0383Higher
UCECUterine Corpus Endometrial Carcinoma501 -0.0240.589NS
> Grade
 

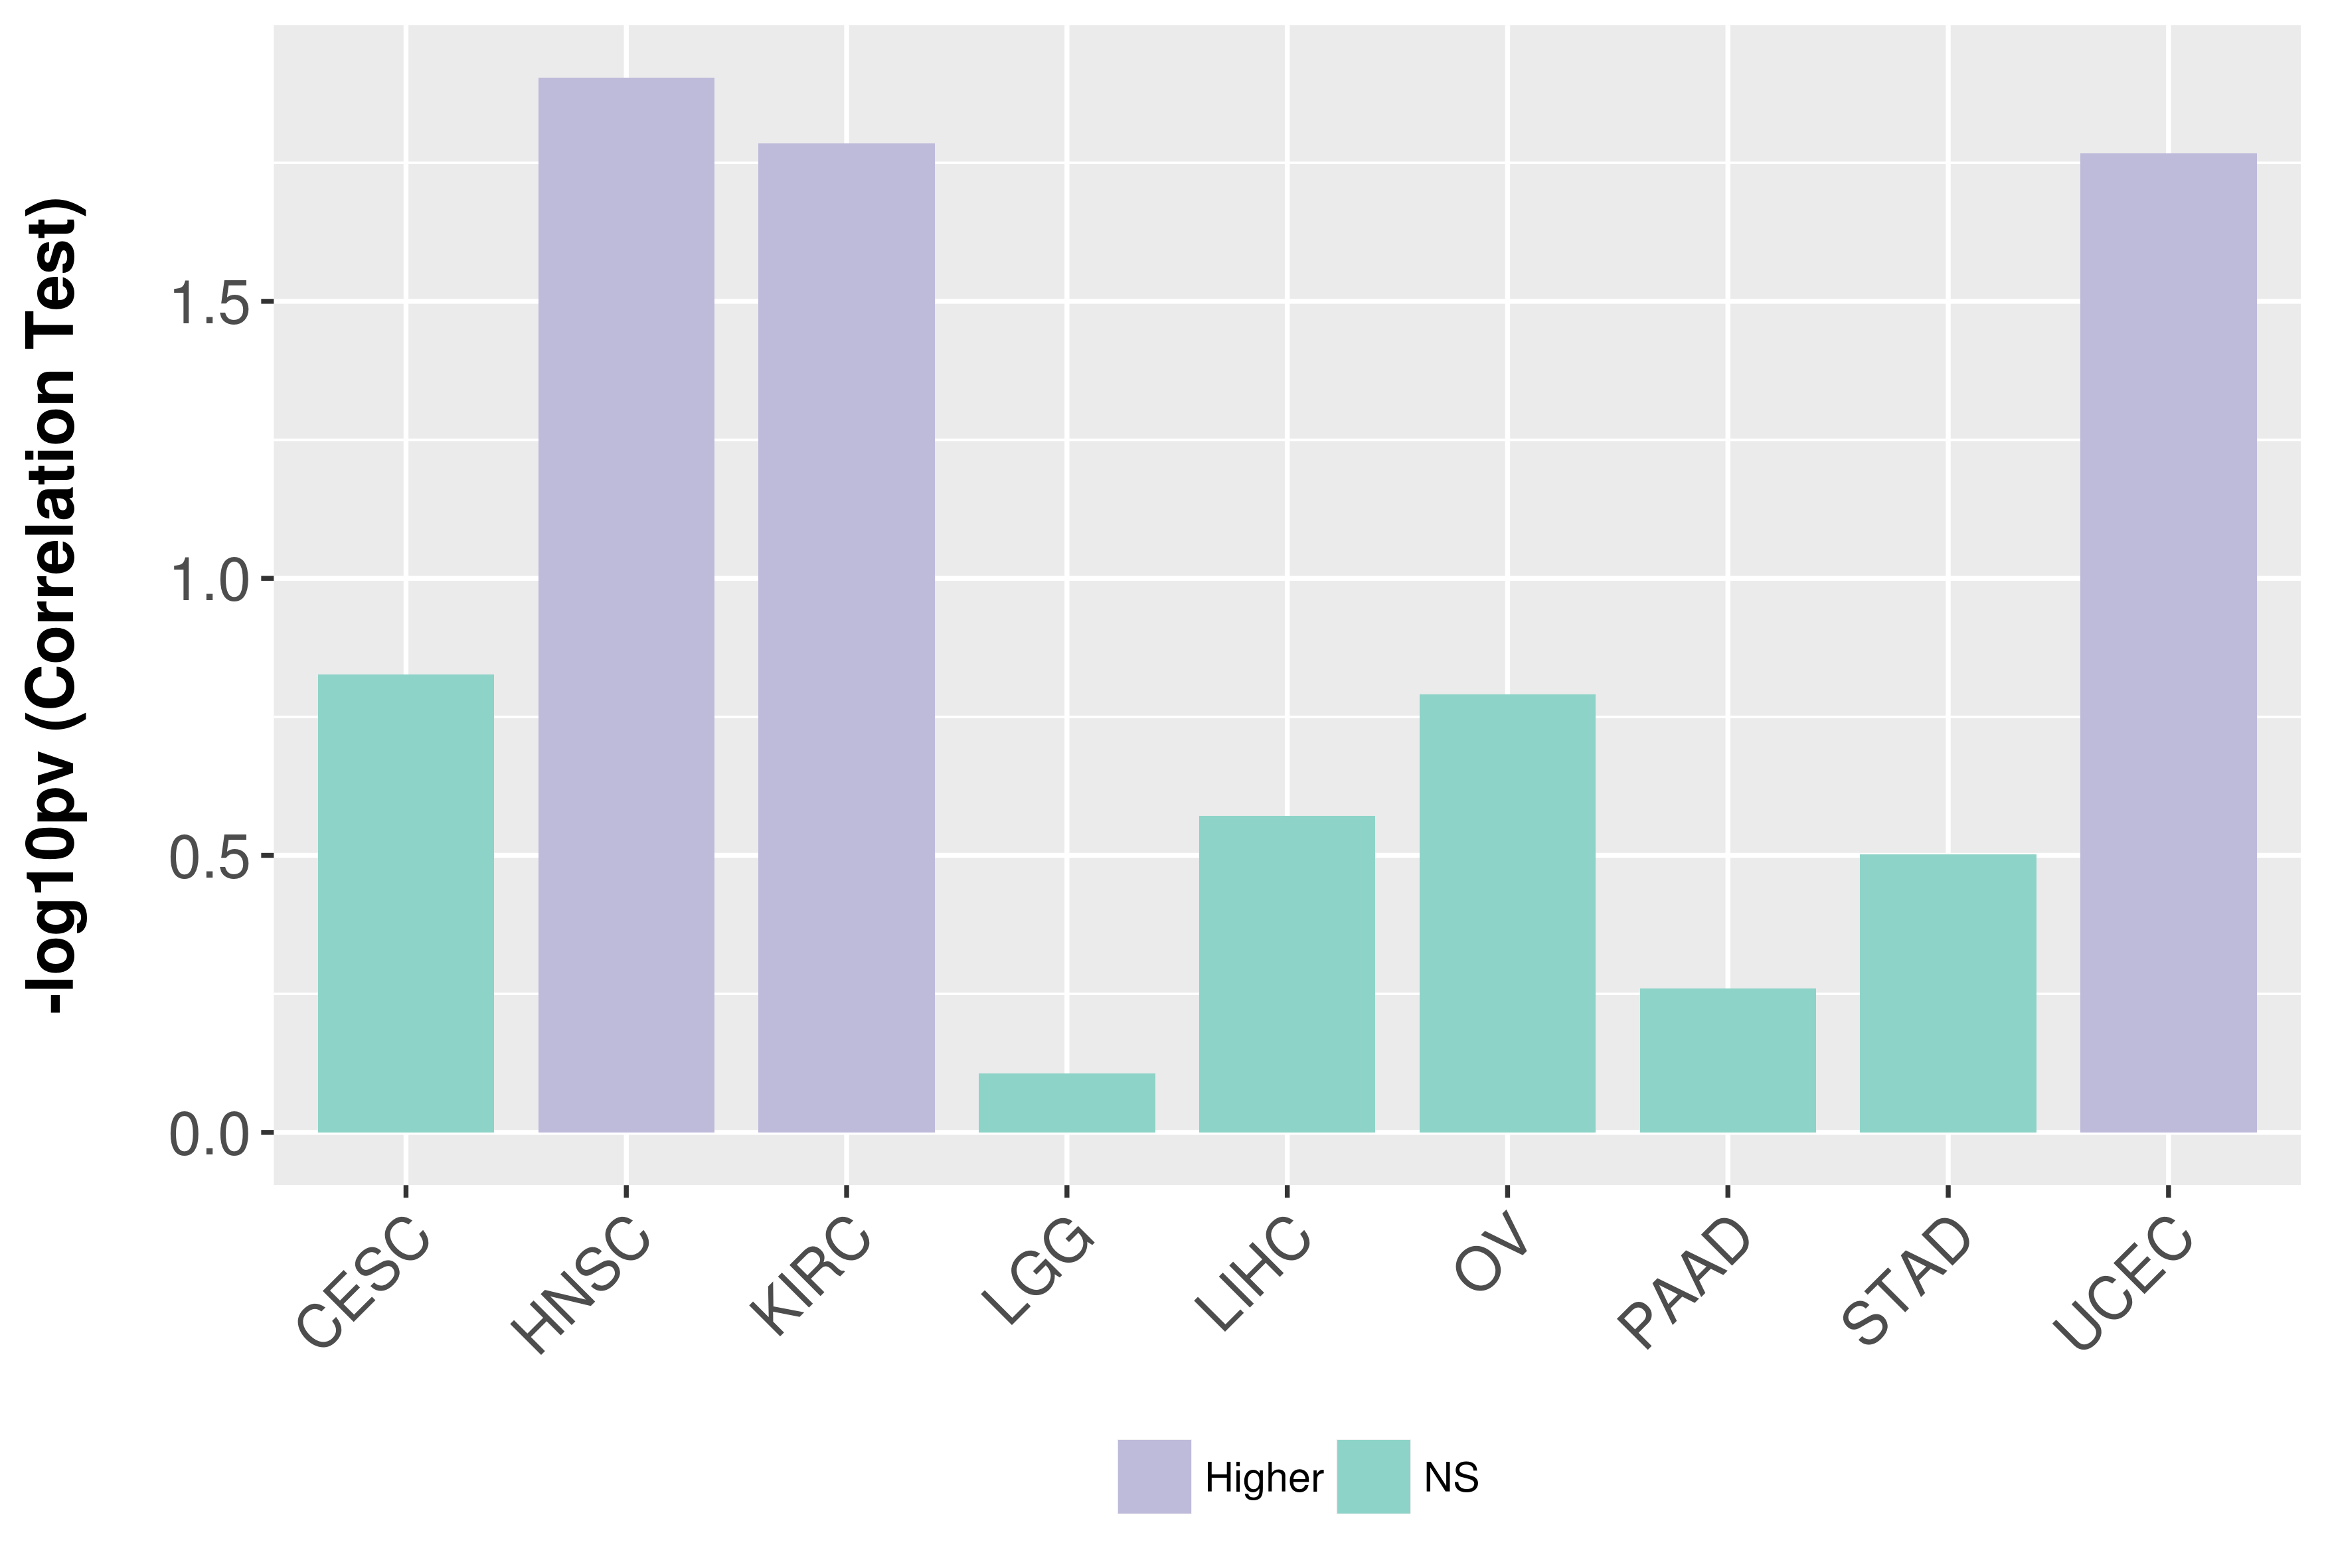
  Association between expresson and grade.
Cancer Full Name # Patients R Value (Spearman) P Value (Spearman) Association
CESCCervical and endocervical cancers272 0.0880.149NS
HNSCHead and Neck squamous cell carcinoma498 0.1120.0125Higher
KIRCKidney renal clear cell carcinoma525 0.1050.0164Higher
LGGBrain Lower Grade Glioma514 0.0120.783NS
LIHCLiver hepatocellular carcinoma366 0.0580.268NS
OVOvarian serous cystadenocarcinoma296 0.0820.162NS
PAADPancreatic adenocarcinoma176 -0.0450.55NS
STADStomach adenocarcinoma406 0.050.315NS
UCECUterine Corpus Endometrial Carcinoma534 0.1030.0171Higher
Summary
SymbolHDGFL2
NameHDGF like 2
Aliases
Location19p13.3
External Links HGNC, NCBI, Ensembl, Uniprot, GeneCards
Cancer Gene Databases ONGene (Oncogene) , TSGene (Tumor suppressor gene) , NCG (Network of Cancer Genes)
Content > Targets inferred by reverse engineering method
> Targets identified by ChIP-seq data
> Targets inferred by reverse engineering method
 
> Targets identified by ChIP-seq data
 
Summary
SymbolHDGFL2
NameHDGF like 2
Aliases
Location19p13.3
External Links HGNC, NCBI, Ensembl, Uniprot, GeneCards
Cancer Gene Databases ONGene (Oncogene) , TSGene (Tumor suppressor gene) , NCG (Network of Cancer Genes)
Content > Drugs from DrugBank database
> Drugs from DrugBank database
 
There is no record for HDGFL2.
Summary
SymbolHDGFL2
NameHDGF like 2
Aliases
Location19p13.3
External Links HGNC, NCBI, Ensembl, Uniprot, GeneCards
Cancer Gene Databases ONGene (Oncogene) , TSGene (Tumor suppressor gene) , NCG (Network of Cancer Genes)
Content > Protein-Protein Interaction Network
> miRNA Regulatory Relationship
> Interactions from Text Mining
> Protein-Protein Interaction Network
 
> miRNA Regulatory Relationship
 
There is no record for HDGFL2.
> Interactions from Text Mining
 
There is no record for HDGFL2.