This regulatory network was inferred from the input dataset. The miRNAs and mRNAs are
presented as round and rectangle nodes respectively. The numerical value popped up upon mouse over the gene node is the log2 transformed fold-change of the gene expression between the two groups. All of the nodes are clickable, and the detailed information of the miRNAs/mRNAs and related cancer pathway will be displayed in another window. The edges between nodes are supported by both interactions (predicted or experimentally verified) and correlations learnt from cancer dataset. The numerical value popped up upon mouse over the edge is the correlation beat value (effect size) between the two nodes. The experimental evidences of the edges reported in previous cancer studies are highlighted by red/orange color. All of these information can be accessed by the "mouse-over" action. This network shows a full map of the miRNA-mRNA regulation of the input gene list(s), and the hub miRNAs (with the high network degree/betweenness centrality) would be the potential cancer drivers or tumor suppressors. The full result table can be accessed in the "Regulations" tab.
"miRNACancerMAP" is also a network visualization tool for users to draw their regulatory network by personal customization. Users can set the complexity of the network by limiting the number of nodes or edges. And the color of the nodes can be defined by different categories of the mRNAs and miRNAs, such as Gene-Ontology, pathway, and expression status. Users can also select to use network degree or network betweenness centrality to define the node size. And edges can be black or colored by the correlation. Purple edge means negative correlation (mostly found between miRNA and mRNA), and blue edge means positive correlation (found in PPI or miRNA-miRNA sponge effect). We can also add the protein-protein interactions (PPI) into the network. This result will show the cluster of genes regulated by some specific miRNAs. Additionally, miRNA-miRNA edges can be added by the "miRNA sponge" button, presenting some clusters of miRNAs that have the interactions via sponge effect.
miRNA-gene regulations
| Num | microRNA | Gene | miRNA log2FC | miRNA pvalue | Gene log2FC | Gene pvalue | Interaction | Correlation beta | Correlation P-value | PMID | Reported in cancer studies |
|---|---|---|---|---|---|---|---|---|---|---|---|
| 1 | hsa-miR-200c-3p | ACTC1 | 3.5 | 0 | -7.19 | 0 | MirTarget | -1.34 | 0 | NA | |
| 2 | hsa-miR-200c-3p | ADAMTS3 | 3.5 | 0 | -1.18 | 0.00448 | miRNATAP | -0.41 | 0 | NA | |
| 3 | hsa-miR-200c-3p | ADCY2 | 3.5 | 0 | -3.87 | 0 | MirTarget; miRNATAP | -0.44 | 0 | NA | |
| 4 | hsa-miR-200c-3p | AFF3 | 3.5 | 0 | -5 | 0 | MirTarget; miRNATAP | -0.59 | 0 | NA | |
| 5 | hsa-miR-200c-3p | AP1S2 | 3.5 | 0 | -1.31 | 0 | MirTarget; miRNATAP | -0.38 | 0 | NA | |
| 6 | hsa-miR-200c-3p | ARHGAP20 | 3.5 | 0 | -3.52 | 0 | MirTarget; miRNATAP | -0.51 | 0 | NA | |
| 7 | hsa-miR-200c-3p | BACH2 | 3.5 | 0 | -1.52 | 0.00134 | mirMAP | -0.54 | 0 | NA | |
| 8 | hsa-miR-200c-3p | BEND4 | 3.5 | 0 | -1.97 | 7.0E-5 | mirMAP | -0.32 | 0 | NA | |
| 9 | hsa-miR-200c-3p | BNC2 | 3.5 | 0 | -2.95 | 0 | MirTarget | -0.7 | 0 | NA | |
| 10 | hsa-miR-200c-3p | C11orf87 | 3.5 | 0 | -1.55 | 0.01186 | miRNATAP | -0.34 | 0 | NA | |
| 11 | hsa-miR-200c-3p | CACNA1C | 3.5 | 0 | -2.53 | 0 | MirTarget | -0.44 | 0 | NA | |
| 12 | hsa-miR-200c-3p | CDK6 | 3.5 | 0 | -0.77 | 0.06479 | mirMAP | -0.32 | 0 | NA | |
| 13 | hsa-miR-200c-3p | CELF2 | 3.5 | 0 | -3.05 | 0 | mirMAP; miRNATAP | -0.51 | 0 | NA | |
| 14 | hsa-miR-200c-3p | CFL2 | 3.5 | 0 | -2.62 | 0 | MirTarget; miRNATAP | -0.48 | 0 | 23497265 | We characterized one of the target genes of miR-200c CFL2 and demonstrated that CFL2 is overexpressed in aggressive breast cancer cell lines and can be significantly down-regulated by exogenous miR-200c |
| 15 | hsa-miR-200c-3p | CHRDL1 | 3.5 | 0 | -6.15 | 0 | MirTarget | -0.99 | 0 | NA | |
| 16 | hsa-miR-200c-3p | CHST11 | 3.5 | 0 | 0.54 | 0.2311 | mirMAP | -0.4 | 0 | NA | |
| 17 | hsa-miR-200c-3p | CLIC4 | 3.5 | 0 | -1.72 | 0 | MirTarget; miRNATAP | -0.46 | 0 | NA | |
| 18 | hsa-miR-200c-3p | CNTFR | 3.5 | 0 | -3.86 | 0 | miRNATAP | -0.44 | 0 | NA | |
| 19 | hsa-miR-200c-3p | CNTN1 | 3.5 | 0 | -4.98 | 0 | MirTarget; miRNATAP | -0.74 | 0 | NA | |
| 20 | hsa-miR-200c-3p | COL4A3 | 3.5 | 0 | -3.14 | 0 | miRNATAP | -0.32 | 0 | NA | |
| 21 | hsa-miR-200c-3p | CREB5 | 3.5 | 0 | -2.28 | 0 | miRNATAP | -0.47 | 0 | NA | |
| 22 | hsa-miR-200c-3p | CYP1B1 | 3.5 | 0 | -2.82 | 0 | miRNATAP | -0.55 | 0 | 25860934 | Loss of miR 200c up regulates CYP1B1 and confers docetaxel resistance in renal cell carcinoma; Additionally miR-200c which is significantly down-regulated in RCC regulates CYP1B1 expression and activity; An inverse association was also observed between the expression levels of miR-200c and CYP1B1 protein in RCC tissues; Restoration of docetaxel resistance by exogenous expression of CYP1B1 in miR-200c-over-expressing cells indicates that CYP1B1 is a functional target of miR-200c; These results suggest that CYP1B1 up-regulation mediated by low miR-200c is one of the mechanisms underlying resistance of RCC cells to docetaxel; Therefore expression of CYP1B1 and miR-200c in RCC may be useful as a prediction for docetaxel response |
| 23 | hsa-miR-200c-3p | DACT1 | 3.5 | 0 | -1.78 | 2.0E-5 | miRNATAP | -0.47 | 0 | NA | |
| 24 | hsa-miR-200c-3p | DCBLD2 | 3.5 | 0 | -0.13 | 0.73597 | MirTarget | -0.31 | 0 | NA | |
| 25 | hsa-miR-200c-3p | DDIT4L | 3.5 | 0 | -1.9 | 0.00047 | MirTarget | -0.47 | 0 | NA | |
| 26 | hsa-miR-200c-3p | DENND5B | 3.5 | 0 | -1.35 | 0.0001 | MirTarget; miRNATAP | -0.39 | 0 | NA | |
| 27 | hsa-miR-200c-3p | DIXDC1 | 3.5 | 0 | -3.01 | 0 | MirTarget | -0.52 | 0 | NA | |
| 28 | hsa-miR-200c-3p | DMD | 3.5 | 0 | -3.69 | 0 | miRNATAP | -0.53 | 0 | NA | |
| 29 | hsa-miR-200c-3p | DNAJB5 | 3.5 | 0 | -2.65 | 0 | miRNATAP | -0.52 | 0 | NA | |
| 30 | hsa-miR-200c-3p | DRP2 | 3.5 | 0 | -1.35 | 0.00023 | mirMAP | -0.31 | 0 | NA | |
| 31 | hsa-miR-200c-3p | DTNA | 3.5 | 0 | -4.06 | 0 | MirTarget | -0.65 | 0 | NA | |
| 32 | hsa-miR-200c-3p | DUSP1 | 3.5 | 0 | -3.47 | 0 | MirTarget; miRNATAP | -0.32 | 0 | NA | |
| 33 | hsa-miR-200c-3p | DZIP1 | 3.5 | 0 | -1.57 | 2.0E-5 | MirTarget | -0.34 | 0 | NA | |
| 34 | hsa-miR-200c-3p | EDNRA | 3.5 | 0 | -2.19 | 0 | miRNAWalker2 validate; miRNATAP | -0.43 | 0 | NA | |
| 35 | hsa-miR-200c-3p | F2RL2 | 3.5 | 0 | -0.07 | 0.88286 | MirTarget | -0.4 | 0 | NA | |
| 36 | hsa-miR-200c-3p | FBLN5 | 3.5 | 0 | -2.76 | 0 | miRNAWalker2 validate; miRTarBase | -0.4 | 0 | NA | |
| 37 | hsa-miR-200c-3p | FGF2 | 3.5 | 0 | -3.46 | 0 | mirMAP | -0.58 | 0 | NA | |
| 38 | hsa-miR-200c-3p | FHL1 | 3.5 | 0 | -4.79 | 0 | MirTarget | -0.78 | 0 | NA | |
| 39 | hsa-miR-200c-3p | FLI1 | 3.5 | 0 | -1.11 | 7.0E-5 | MirTarget; miRNATAP | -0.32 | 0 | NA | |
| 40 | hsa-miR-200c-3p | FLNA | 3.5 | 0 | -2.63 | 0 | miRNAWalker2 validate | -0.57 | 0 | NA | |
| 41 | hsa-miR-200c-3p | FN1 | 3.5 | 0 | -0.41 | 0.45793 | miRNAWalker2 validate; miRTarBase; MirTarget; miRNATAP | -0.66 | 0 | NA | |
| 42 | hsa-miR-200c-3p | FOXF1 | 3.5 | 0 | -3.6 | 0 | MirTarget | -0.33 | 0 | NA | |
| 43 | hsa-miR-200c-3p | FSTL1 | 3.5 | 0 | -1.2 | 3.0E-5 | MirTarget | -0.36 | 0 | NA | |
| 44 | hsa-miR-200c-3p | FYN | 3.5 | 0 | -1.47 | 0 | miRNATAP | -0.35 | 0 | NA | |
| 45 | hsa-miR-200c-3p | GEM | 3.5 | 0 | -3.69 | 0 | MirTarget; miRNATAP | -0.6 | 0 | NA | |
| 46 | hsa-miR-200c-3p | GFRA1 | 3.5 | 0 | -5 | 0 | mirMAP | -0.33 | 0 | NA | |
| 47 | hsa-miR-200c-3p | GJC1 | 3.5 | 0 | -0.97 | 0.00222 | MirTarget; miRNATAP | -0.31 | 0 | NA | |
| 48 | hsa-miR-200c-3p | GLIS2 | 3.5 | 0 | -0.61 | 0.05279 | miRNATAP | -0.31 | 0 | NA | |
| 49 | hsa-miR-200c-3p | GNG4 | 3.5 | 0 | 0.22 | 0.74468 | mirMAP | -0.42 | 0 | NA | |
| 50 | hsa-miR-200c-3p | GPM6A | 3.5 | 0 | -4.43 | 0 | miRNATAP | -0.61 | 0 | NA | |
| 51 | hsa-miR-200c-3p | GREM1 | 3.5 | 0 | 0.09 | 0.91453 | MirTarget | -0.65 | 0 | NA | |
| 52 | hsa-miR-200c-3p | HLF | 3.5 | 0 | -5.48 | 0 | MirTarget; miRNATAP | -0.6 | 0 | NA | |
| 53 | hsa-miR-200c-3p | HS3ST3A1 | 3.5 | 0 | -0.13 | 0.83157 | MirTarget | -0.63 | 0 | NA | |
| 54 | hsa-miR-200c-3p | IGSF10 | 3.5 | 0 | -5.3 | 0 | MirTarget | -0.54 | 0 | NA | |
| 55 | hsa-miR-200c-3p | IL6ST | 3.5 | 0 | -2.1 | 2.0E-5 | mirMAP | -0.35 | 0 | NA | |
| 56 | hsa-miR-200c-3p | ITGA1 | 3.5 | 0 | -1.43 | 0 | MirTarget | -0.34 | 0 | NA | |
| 57 | hsa-miR-200c-3p | ITPR1 | 3.5 | 0 | -2.58 | 0 | miRNATAP | -0.31 | 0 | NA | |
| 58 | hsa-miR-200c-3p | JAZF1 | 3.5 | 0 | -1.92 | 0 | MirTarget; miRNATAP | -0.42 | 0 | NA | |
| 59 | hsa-miR-200c-3p | KCNK2 | 3.5 | 0 | -3.96 | 0 | miRNATAP | -0.5 | 0 | NA | |
| 60 | hsa-miR-200c-3p | KCNQ4 | 3.5 | 0 | -2.64 | 0 | miRNATAP | -0.36 | 0 | NA | |
| 61 | hsa-miR-200c-3p | KIAA1462 | 3.5 | 0 | -1.72 | 0 | MirTarget | -0.39 | 0 | NA | |
| 62 | hsa-miR-200c-3p | KLF9 | 3.5 | 0 | -2.79 | 0 | miRNAWalker2 validate; miRTarBase; miRNATAP | -0.4 | 0 | NA | |
| 63 | hsa-miR-200c-3p | LHFP | 3.5 | 0 | -1.83 | 0 | MirTarget; miRNATAP | -0.36 | 0 | NA | |
| 64 | hsa-miR-200c-3p | LIX1L | 3.5 | 0 | -1.29 | 0 | MirTarget | -0.34 | 0 | NA | |
| 65 | hsa-miR-200c-3p | MAF | 3.5 | 0 | -1.28 | 0.00016 | miRNATAP | -0.36 | 0 | NA | |
| 66 | hsa-miR-200c-3p | MFAP5 | 3.5 | 0 | -4.35 | 0 | miRNATAP | -0.9 | 0 | NA | |
| 67 | hsa-miR-200c-3p | MITF | 3.5 | 0 | -2.11 | 0 | miRNATAP | -0.37 | 0 | NA | |
| 68 | hsa-miR-200c-3p | MMD | 3.5 | 0 | -0.05 | 0.87055 | miRNATAP | -0.31 | 0 | NA | |
| 69 | hsa-miR-200c-3p | MRVI1 | 3.5 | 0 | -3.2 | 0 | MirTarget | -0.43 | 0 | NA | |
| 70 | hsa-miR-200c-3p | MSN | 3.5 | 0 | -0.86 | 0.01366 | miRNAWalker2 validate; miRTarBase; MirTarget | -0.39 | 0 | NA | |
| 71 | hsa-miR-200c-3p | MSRB3 | 3.5 | 0 | -3.32 | 0 | mirMAP | -0.64 | 0 | NA | |
| 72 | hsa-miR-200c-3p | NCAM1 | 3.5 | 0 | -5.47 | 0 | miRTarBase | -0.87 | 0 | NA | |
| 73 | hsa-miR-200c-3p | NCS1 | 3.5 | 0 | -1.74 | 0 | miRNATAP | -0.3 | 0 | NA | |
| 74 | hsa-miR-200c-3p | NEGR1 | 3.5 | 0 | -4.78 | 0 | miRNATAP | -0.68 | 0 | NA | |
| 75 | hsa-miR-200c-3p | NFASC | 3.5 | 0 | -2.96 | 0 | miRNATAP | -0.3 | 0 | 23185507 | miR 200c targets a NF κB up regulated TrkB/NTF3 autocrine signaling loop to enhance anoikis sensitivity in triple negative breast cancer |
| 76 | hsa-miR-200c-3p | NOG | 3.5 | 0 | -1.05 | 0.08272 | MirTarget; miRNATAP | -0.38 | 0 | NA | |
| 77 | hsa-miR-200c-3p | NOVA1 | 3.5 | 0 | -4.22 | 0 | MirTarget; miRNATAP | -0.42 | 0 | NA | |
| 78 | hsa-miR-200c-3p | NR3C1 | 3.5 | 0 | -1.29 | 4.0E-5 | miRNATAP | -0.31 | 0 | NA | |
| 79 | hsa-miR-200c-3p | NRG1 | 3.5 | 0 | -1.24 | 0.07417 | miRNATAP | -0.39 | 0 | NA | |
| 80 | hsa-miR-200c-3p | NTRK2 | 3.5 | 0 | -3.44 | 0 | miRNAWalker2 validate; miRTarBase | -0.56 | 0 | 23209748; 23074172 | miR 200c sensitizes breast cancer cells to doxorubicin treatment by decreasing TrkB and Bmi1 expression;miR-200c also targets TrkB a mediator of resistance to anoikis |
| 81 | hsa-miR-200c-3p | PALM2-AKAP2 | 3.5 | 0 | -1.62 | 0 | miRNATAP | -0.42 | 0 | NA | |
| 82 | hsa-miR-200c-3p | PCDH10 | 3.5 | 0 | -3.24 | 0 | MirTarget | -0.53 | 0 | NA | |
| 83 | hsa-miR-200c-3p | PCSK2 | 3.5 | 0 | -6.63 | 0 | miRNATAP | -0.39 | 0 | NA | |
| 84 | hsa-miR-200c-3p | PDE5A | 3.5 | 0 | -2.72 | 0 | miRNATAP | -0.3 | 0 | NA | |
| 85 | hsa-miR-200c-3p | PLCL1 | 3.5 | 0 | -2.36 | 0 | MirTarget | -0.41 | 0 | NA | |
| 86 | hsa-miR-200c-3p | PLXNA4 | 3.5 | 0 | -2.25 | 5.0E-5 | miRNATAP | -0.68 | 0 | NA | |
| 87 | hsa-miR-200c-3p | PLXNC1 | 3.5 | 0 | -0.53 | 0.2847 | miRNATAP | -0.43 | 0 | NA | |
| 88 | hsa-miR-200c-3p | PPARGC1A | 3.5 | 0 | -4.12 | 0 | mirMAP | -0.48 | 0 | NA | |
| 89 | hsa-miR-200c-3p | PPP2R2C | 3.5 | 0 | -0.8 | 0.26616 | miRNATAP | -0.31 | 4.0E-5 | NA | |
| 90 | hsa-miR-200c-3p | PRKAA2 | 3.5 | 0 | -3.17 | 0 | MirTarget | -0.32 | 0 | NA | |
| 91 | hsa-miR-200c-3p | PRKCB | 3.5 | 0 | -3.26 | 0 | MirTarget; miRNATAP | -0.49 | 0 | NA | |
| 92 | hsa-miR-200c-3p | PRKG1 | 3.5 | 0 | -3.09 | 0 | miRNATAP | -0.56 | 0 | NA | |
| 93 | hsa-miR-200c-3p | PTHLH | 3.5 | 0 | -0.64 | 0.35954 | MirTarget | -0.32 | 1.0E-5 | NA | |
| 94 | hsa-miR-200c-3p | PTPRD | 3.5 | 0 | -3.63 | 0 | miRNAWalker2 validate | -0.63 | 0 | NA | |
| 95 | hsa-miR-200c-3p | PTPRZ1 | 3.5 | 0 | -3.07 | 0.00082 | MirTarget; miRNATAP | -0.42 | 1.0E-5 | NA | |
| 96 | hsa-miR-200c-3p | PYGO1 | 3.5 | 0 | -2.1 | 4.0E-5 | mirMAP | -0.41 | 0 | NA | |
| 97 | hsa-miR-200c-3p | RASSF8 | 3.5 | 0 | -1.49 | 0 | miRNATAP | -0.31 | 0 | NA | |
| 98 | hsa-miR-200c-3p | RECK | 3.5 | 0 | -2.39 | 0 | miRNATAP | -0.45 | 0 | 27574450; 24647918 | MiR 200c promotes bladder cancer cell migration and invasion by directly targeting RECK; The luciferase reporter assay showed that RECK was a direct target of miR-200c;Finally we demonstrated that expression of miR-200c in H460 cells suppressed cell growth by targeting RECK followed by activation of the JNK signaling pathway and ER stress; Collectively these data show that miR-200c expression sensitizes H460 cells to RESV and this is likely due to RECK expression |
| 99 | hsa-miR-200c-3p | REEP1 | 3.5 | 0 | -4.35 | 0 | MirTarget; miRNATAP | -0.61 | 0 | NA | |
| 100 | hsa-miR-200c-3p | RELN | 3.5 | 0 | -4.7 | 0 | MirTarget | -0.65 | 0 | NA | |
| 101 | hsa-miR-200c-3p | RUSC2 | 3.5 | 0 | -1.6 | 0 | miRNATAP | -0.33 | 0 | NA | |
| 102 | hsa-miR-200c-3p | SCN3A | 3.5 | 0 | -2.33 | 0 | mirMAP | -0.32 | 0 | NA | |
| 103 | hsa-miR-200c-3p | SCUBE3 | 3.5 | 0 | -2.48 | 0 | mirMAP | -0.39 | 0 | NA | |
| 104 | hsa-miR-200c-3p | SDC2 | 3.5 | 0 | -2.01 | 0 | miRNATAP | -0.33 | 0 | NA | |
| 105 | hsa-miR-200c-3p | SFMBT2 | 3.5 | 0 | -1.41 | 0.00042 | mirMAP | -0.35 | 0 | NA | |
| 106 | hsa-miR-200c-3p | SGCD | 3.5 | 0 | -3.55 | 0 | mirMAP | -0.67 | 0 | NA | |
| 107 | hsa-miR-200c-3p | SGIP1 | 3.5 | 0 | -0.44 | 0.23102 | MirTarget | -0.32 | 0 | NA | |
| 108 | hsa-miR-200c-3p | SHE | 3.5 | 0 | -2.12 | 0 | mirMAP | -0.35 | 0 | NA | |
| 109 | hsa-miR-200c-3p | SIRPA | 3.5 | 0 | -0.55 | 0.11927 | MirTarget | -0.38 | 0 | NA | |
| 110 | hsa-miR-200c-3p | SLC16A12 | 3.5 | 0 | -0.98 | 0.04552 | mirMAP; miRNATAP | -0.31 | 0 | NA | |
| 111 | hsa-miR-200c-3p | SLC16A2 | 3.5 | 0 | -1.54 | 0 | miRNATAP | -0.4 | 0 | NA | |
| 112 | hsa-miR-200c-3p | SLC30A4 | 3.5 | 0 | -1.13 | 0.0037 | mirMAP | -0.37 | 0 | NA | |
| 113 | hsa-miR-200c-3p | SLC6A17 | 3.5 | 0 | 0.94 | 0.05681 | mirMAP; miRNATAP | -0.34 | 0 | NA | |
| 114 | hsa-miR-200c-3p | SNAP25 | 3.5 | 0 | -1.15 | 0.03273 | MirTarget; miRNATAP | -0.46 | 0 | NA | |
| 115 | hsa-miR-200c-3p | STARD8 | 3.5 | 0 | -1.76 | 0 | mirMAP | -0.38 | 0 | NA | |
| 116 | hsa-miR-200c-3p | SULF1 | 3.5 | 0 | 0.17 | 0.75761 | MirTarget; miRNATAP | -0.5 | 0 | NA | |
| 117 | hsa-miR-200c-3p | SV2B | 3.5 | 0 | -2.33 | 7.0E-5 | mirMAP | -0.6 | 0 | NA | |
| 118 | hsa-miR-200c-3p | SYDE1 | 3.5 | 0 | -0.81 | 0.00222 | MirTarget; miRNATAP | -0.36 | 0 | NA | |
| 119 | hsa-miR-200c-3p | SYT11 | 3.5 | 0 | -2.12 | 0 | mirMAP | -0.47 | 0 | NA | |
| 120 | hsa-miR-200c-3p | TBX18 | 3.5 | 0 | -2.2 | 0.00125 | MirTarget | -0.48 | 0 | NA | |
| 121 | hsa-miR-200c-3p | TCF4 | 3.5 | 0 | -1.61 | 0 | mirMAP; miRNATAP | -0.32 | 0 | NA | |
| 122 | hsa-miR-200c-3p | TCF7L1 | 3.5 | 0 | -1.3 | 0.00022 | miRNAWalker2 validate | -0.32 | 0 | NA | |
| 123 | hsa-miR-200c-3p | TFEC | 3.5 | 0 | 0.02 | 0.97058 | MirTarget | -0.38 | 0 | NA | |
| 124 | hsa-miR-200c-3p | THEMIS | 3.5 | 0 | -1.31 | 0.01187 | mirMAP | -0.31 | 0 | NA | |
| 125 | hsa-miR-200c-3p | TIMP2 | 3.5 | 0 | -1.75 | 1.0E-5 | miRTarBase | -0.48 | 0 | NA | |
| 126 | hsa-miR-200c-3p | TUBB2A | 3.5 | 0 | -0.68 | 0.0629 | MirTarget; miRNATAP | -0.3 | 0 | NA | |
| 127 | hsa-miR-200c-3p | VAT1L | 3.5 | 0 | -1.21 | 0.00422 | MirTarget; miRNATAP | -0.3 | 0 | NA | |
| 128 | hsa-miR-200c-3p | WIPF1 | 3.5 | 0 | -1.36 | 1.0E-5 | MirTarget; miRNATAP | -0.42 | 0 | NA | |
| 129 | hsa-miR-200c-3p | ZCCHC24 | 3.5 | 0 | -2.71 | 0 | MirTarget; miRNATAP | -0.47 | 0 | NA | |
| 130 | hsa-miR-200c-3p | ZDHHC15 | 3.5 | 0 | -2.82 | 0 | MirTarget | -0.37 | 0 | NA | |
| 131 | hsa-miR-200c-3p | ZEB1 | 3.5 | 0 | -2.59 | 0 | miRNAWalker2 validate; miRTarBase; MirTarget; miRNATAP | -0.49 | 0 | 27666124; 24710933; 23754305; 24615544; 24424572; 24186205; 21682933; 22407310; 27717206; 23626803 | miR 200c regulates crizotinib resistant ALK positive lung cancer cells by reversing epithelial mesenchymal transition via targeting ZEB1;miR-200c has been shown to regulate the epithelial-mesenchymal transition EMT by inhibiting ZEB1 and ZEB2 expression in breast cancer cells; This study further examined the role of miR-200c in the invasion and metastasis of breast cancer that goes beyond the regulation on ZEB1 and ZEB2 expression;Overexpression of miR-200c in SN12-PM6 and 786-0 cells was concurrent with downregulation of ZEB1 and upregulation of E-cadherin mRNA and protein; Thus our study demonstrated that miR-200c decreases the metastatic ability of renal carcinoma cells by upregulating E-cadherin through ZEB1 and that modulating the expression of miR-200c could influence Akt protein levels;MiR 200c suppresses TGF β signaling and counteracts trastuzumab resistance and metastasis by targeting ZNF217 and ZEB1 in breast cancer; MiR-200c which was the most significantly downregulated miRNA in trastuzumab-resistant cells restored trastuzumab sensitivity and suppressed invasion of breast cancer cells by concurrently targeting ZNF217 a transcriptional activator of TGF-β and ZEB1 a known mediator of TGF-β signaling; Given the reported backward inhibition of miR-200c by ZEB1 ZNF217 also exerts a feedback suppression of miR-200c via TGF-β/ZEB1 signaling; Restoration of miR-200c silencing of ZEB1 or ZNF217 or blockade of TGF-β signaling increased trastuzumab sensitivity and suppressed invasiveness of breast cancer cells;Accordingly the enforced expression of miR-200c and mir-141 resulted in a significant upregulation in E-cadherin expression contrary to the significant downregulation in ZEB1 expression in 3 cell lines UTSCC-24A UTSCC-24B and UTSCC-6A cells;Furthermore miR-200c was found to be important in modulating ZEB1 upregulation by ERG;Of this family miR-200c has garnered particular attention as a consequence of its ability to target ZEB1 and ZEB2 mediators of epithelial- mesenchymal transition;miR 200c inhibits invasion and migration in human colon cancer cells SW480/620 by targeting ZEB1; Among those dysregulated microRNAs miR-200c was speculated to inhibit metastasis by targeting ZEB1; Overexpression of miR-200c was concurrent with downregulation of ZEB1 mRNA and protein; Taken together our study demonstrated that miR-200c inhibits metastatic ability by targeting ZEB1 in colon cancer cells SW480/620 and suggested that modulation of miR-200c could serve as therapeutic tool for inhibiting metastasis in colorectal cancer;Epigenetic Silencing of miR 200c in Breast Cancer Is Associated with Aggressiveness and Is Modulated by ZEB1;Concomitant with the increase in miR-200b and miR-200c ZEB1 expression was decreased and cells appeared more epithelial in morphology and were sensitized to TAM and fulvestrant inhibition |
| 132 | hsa-miR-200c-3p | ZEB2 | 3.5 | 0 | -2.26 | 0 | miRNAWalker2 validate; miRTarBase; MirTarget; miRNATAP | -0.51 | 0 | 24710933; 26935975; 21682933; 25052237; 18925646; 24885194 | miR-200c has been shown to regulate the epithelial-mesenchymal transition EMT by inhibiting ZEB1 and ZEB2 expression in breast cancer cells; This study further examined the role of miR-200c in the invasion and metastasis of breast cancer that goes beyond the regulation on ZEB1 and ZEB2 expression;MicroRNA 200c inhibits the metastasis of non small cell lung cancer cells by targeting ZEB2 an epithelial mesenchymal transition regulator;Of this family miR-200c has garnered particular attention as a consequence of its ability to target ZEB1 and ZEB2 mediators of epithelial- mesenchymal transition;miR 200c modulates ovarian cancer cell metastasis potential by targeting zinc finger E box binding homeobox 2 ZEB2 expression; Luciferase reporter assay confirmed the target of miR-200c as ZEB2; Furthermore miR-200c expression inhibited ovarian cancer cell ES-2 migration and invasion capacity by suppression of ZEB2 expression p < 0.01; Thus targeting of miR-200c or ZEB2 may serve as a potential therapeutic strategy for control of ovarian cancer;We established by quantitative RT-PCR that in CCCs in which miR-141 and miR-200c were down-regulated ZFHX1B a transcriptional repressor for CDH1/E-cadherin tended to be up-regulated; On the basis of these findings we suggest that down-regulation of miR-141 and miR-200c in CCCs might be involved in suppression of CDH1/E-cadherin transcription via up-regulation of ZFHX1B;Two gastric cancer cell lines were treated with IGF-I to induce EMT and levels of transcription factor ZEB2 and microRNA-200c miR-200c were measured; Furthermore both Akt/ERK inhibitors and knockdown of Akt/ERK gene reversed IGF-I-induced ZEB2 up-regulation and EMT through up-regulation of miR-200c suggesting the involvement of an Akt/ERK-miR-200c-ZEB2 axis in IGF-I-induced EMT |
| 133 | hsa-miR-200c-3p | ZFHX4 | 3.5 | 0 | -2.72 | 0 | miRNATAP | -0.6 | 0 | NA | |
| 134 | hsa-miR-200c-3p | ZFPM2 | 3.5 | 0 | -3.3 | 0 | miRNAWalker2 validate; miRTarBase; miRNATAP | -0.61 | 0 | NA |
| Num | GO | Overlap | Size | P Value | Adj. P Value |
|---|---|---|---|---|---|
| 1 | REGULATION OF NEURON DIFFERENTIATION | 22 | 554 | 1.798e-11 | 4.183e-08 |
| 2 | REGULATION OF MULTICELLULAR ORGANISMAL DEVELOPMENT | 38 | 1672 | 9.939e-12 | 4.183e-08 |
| 3 | CELL DEVELOPMENT | 34 | 1426 | 4.59e-11 | 5.723e-08 |
| 4 | REGULATION OF CELL DEVELOPMENT | 26 | 836 | 4.919e-11 | 5.723e-08 |
| 5 | REGULATION OF CELL DIFFERENTIATION | 33 | 1492 | 6.631e-10 | 6.171e-07 |
| 6 | REGULATION OF NERVOUS SYSTEM DEVELOPMENT | 23 | 750 | 9.814e-10 | 7.611e-07 |
| 7 | POSITIVE REGULATION OF NEURON DIFFERENTIATION | 15 | 306 | 2.229e-09 | 1.482e-06 |
| 8 | POSITIVE REGULATION OF CELL DEVELOPMENT | 18 | 472 | 2.759e-09 | 1.605e-06 |
| 9 | REGULATION OF NEURON PROJECTION DEVELOPMENT | 16 | 408 | 1.52e-08 | 7.479e-06 |
| 10 | REGULATION OF ANATOMICAL STRUCTURE MORPHOGENESIS | 25 | 1021 | 1.607e-08 | 7.479e-06 |
| 11 | MOVEMENT OF CELL OR SUBCELLULAR COMPONENT | 28 | 1275 | 2.014e-08 | 8.519e-06 |
| 12 | POSITIVE REGULATION OF NERVOUS SYSTEM DEVELOPMENT | 16 | 437 | 3.952e-08 | 1.319e-05 |
| 13 | NEUROGENESIS | 29 | 1402 | 3.969e-08 | 1.319e-05 |
| 14 | POSITIVE REGULATION OF DEVELOPMENTAL PROCESS | 26 | 1142 | 3.459e-08 | 1.319e-05 |
| 15 | EXTRACELLULAR STRUCTURE ORGANIZATION | 13 | 304 | 1.367e-07 | 4.239e-05 |
| 16 | REGULATION OF CELL PROJECTION ORGANIZATION | 17 | 558 | 2.033e-07 | 5.782e-05 |
| 17 | REGULATION OF CELLULAR COMPONENT MOVEMENT | 20 | 771 | 2.113e-07 | 5.782e-05 |
| 18 | POSITIVE REGULATION OF NEURON PROJECTION DEVELOPMENT | 11 | 232 | 4.747e-07 | 0.0001227 |
| 19 | CELLULAR COMPONENT MORPHOGENESIS | 21 | 900 | 5.807e-07 | 0.0001378 |
| 20 | POSITIVE REGULATION OF CELL DIFFERENTIATION | 20 | 823 | 5.921e-07 | 0.0001378 |
| 21 | TISSUE DEVELOPMENT | 28 | 1518 | 7.46e-07 | 0.0001653 |
| 22 | POSITIVE REGULATION OF CELL PROJECTION ORGANIZATION | 12 | 303 | 9.552e-07 | 0.000202 |
| 23 | LOCOMOTION | 23 | 1114 | 1.318e-06 | 0.0002666 |
| 24 | POSITIVE REGULATION OF MULTICELLULAR ORGANISMAL PROCESS | 26 | 1395 | 1.655e-06 | 0.0003209 |
| 25 | REGULATION OF CELL MORPHOGENESIS INVOLVED IN DIFFERENTIATION | 12 | 337 | 2.887e-06 | 0.0005374 |
| 26 | MUSCLE SYSTEM PROCESS | 11 | 282 | 3.197e-06 | 0.0005721 |
| 27 | REGULATION OF CELLULAR RESPONSE TO GROWTH FACTOR STIMULUS | 10 | 229 | 3.363e-06 | 0.0005796 |
| 28 | REGULATION OF CELL MORPHOGENESIS | 15 | 552 | 4.53e-06 | 0.0007528 |
| 29 | FOREBRAIN DEVELOPMENT | 12 | 357 | 5.208e-06 | 0.0008077 |
| 30 | BIOLOGICAL ADHESION | 21 | 1032 | 5.069e-06 | 0.0008077 |
| 31 | RESPONSE TO WOUNDING | 15 | 563 | 5.744e-06 | 0.0008622 |
| 32 | CELL MOTILITY | 18 | 835 | 1.194e-05 | 0.001684 |
| 33 | LOCALIZATION OF CELL | 18 | 835 | 1.194e-05 | 0.001684 |
| 34 | EMBRYONIC MORPHOGENESIS | 14 | 539 | 1.593e-05 | 0.00218 |
| 35 | REGULATION OF CARDIAC MUSCLE TISSUE DEVELOPMENT | 5 | 48 | 1.702e-05 | 0.002214 |
| 36 | NEURON PROJECTION DEVELOPMENT | 14 | 545 | 1.801e-05 | 0.002214 |
| 37 | NEURON PROJECTION MORPHOGENESIS | 12 | 402 | 1.713e-05 | 0.002214 |
| 38 | REGULATION OF CELL PROLIFERATION | 25 | 1496 | 1.808e-05 | 0.002214 |
| 39 | TISSUE MIGRATION | 6 | 84 | 2.141e-05 | 0.002491 |
| 40 | CENTRAL NERVOUS SYSTEM DEVELOPMENT | 18 | 872 | 2.132e-05 | 0.002491 |
| 41 | CELL PART MORPHOGENESIS | 15 | 633 | 2.289e-05 | 0.002598 |
| 42 | REGULATION OF PHOSPHORUS METABOLIC PROCESS | 26 | 1618 | 2.355e-05 | 0.002609 |
| 43 | NEGATIVE REGULATION OF CELL PROLIFERATION | 15 | 643 | 2.743e-05 | 0.002968 |
| 44 | EMBRYO DEVELOPMENT | 18 | 894 | 2.962e-05 | 0.003132 |
| 45 | CIRCULATORY SYSTEM PROCESS | 11 | 366 | 3.662e-05 | 0.003787 |
| 46 | REGULATION OF CARDIAC MUSCLE CELL PROLIFERATION | 4 | 29 | 4.018e-05 | 0.004064 |
| 47 | CELL MORPHOGENESIS INVOLVED IN DIFFERENTIATION | 13 | 513 | 4.188e-05 | 0.004147 |
| 48 | MESENCHYME DEVELOPMENT | 8 | 190 | 4.301e-05 | 0.004169 |
| 49 | REGULATION OF TRANSCRIPTION FROM RNA POLYMERASE II PROMOTER | 27 | 1784 | 4.568e-05 | 0.004338 |
| 50 | SYNAPSE ORGANIZATION | 7 | 145 | 5.548e-05 | 0.005163 |
| 51 | NEURON DEVELOPMENT | 15 | 687 | 5.831e-05 | 0.00532 |
| 52 | POSITIVE REGULATION OF PHOSPHATE METABOLIC PROCESS | 19 | 1036 | 6.197e-05 | 0.005441 |
| 53 | POSITIVE REGULATION OF PHOSPHORUS METABOLIC PROCESS | 19 | 1036 | 6.197e-05 | 0.005441 |
| 54 | REGULATION OF MUSCLE TISSUE DEVELOPMENT | 6 | 103 | 6.789e-05 | 0.00585 |
| 55 | NEGATIVE REGULATION OF LOCOMOTION | 9 | 263 | 7.158e-05 | 0.006041 |
| 56 | WOUND HEALING | 12 | 470 | 7.79e-05 | 0.006041 |
| 57 | NEGATIVE REGULATION OF CELL DEATH | 17 | 872 | 7.467e-05 | 0.006041 |
| 58 | NEURON DIFFERENTIATION | 17 | 874 | 7.679e-05 | 0.006041 |
| 59 | CARDIOVASCULAR SYSTEM DEVELOPMENT | 16 | 788 | 7.697e-05 | 0.006041 |
| 60 | CIRCULATORY SYSTEM DEVELOPMENT | 16 | 788 | 7.697e-05 | 0.006041 |
| 61 | POSITIVE REGULATION OF CELLULAR COMPONENT ORGANIZATION | 20 | 1152 | 8.317e-05 | 0.006142 |
| 62 | HEAD DEVELOPMENT | 15 | 709 | 8.299e-05 | 0.006142 |
| 63 | DIVALENT INORGANIC CATION TRANSPORT | 9 | 268 | 8.267e-05 | 0.006142 |
| 64 | ION TRANSPORT | 21 | 1262 | 9.892e-05 | 0.00716 |
| 65 | NEGATIVE REGULATION OF RESPONSE TO STIMULUS | 22 | 1360 | 1e-04 | 0.00716 |
| 66 | POSITIVE REGULATION OF PEPTIDYL TYROSINE PHOSPHORYLATION | 7 | 162 | 0.0001115 | 0.007702 |
| 67 | CELL PROJECTION ORGANIZATION | 17 | 902 | 0.0001126 | 0.007702 |
| 68 | POSITIVE REGULATION OF CELL MORPHOGENESIS INVOLVED IN DIFFERENTIATION | 7 | 162 | 0.0001115 | 0.007702 |
| 69 | REGULATION OF CELL DEATH | 23 | 1472 | 0.0001146 | 0.007731 |
| 70 | SYSTEM PROCESS | 26 | 1785 | 0.0001218 | 0.008004 |
| 71 | SENSORY ORGAN DEVELOPMENT | 12 | 493 | 0.0001221 | 0.008004 |
| 72 | CALCIUM ION TRANSPORT | 8 | 223 | 0.0001317 | 0.008305 |
| 73 | CELLULAR RESPONSE TO KETONE | 5 | 73 | 0.0001306 | 0.008305 |
| 74 | NEGATIVE REGULATION OF CELL COMMUNICATION | 20 | 1192 | 0.0001321 | 0.008305 |
| 75 | TELENCEPHALON DEVELOPMENT | 8 | 228 | 0.0001534 | 0.009517 |
| 76 | MUSCLE STRUCTURE DEVELOPMENT | 11 | 432 | 0.0001599 | 0.009664 |
| 77 | REGULATION OF DENDRITE DEVELOPMENT | 6 | 120 | 0.0001581 | 0.009664 |
| Num | GO | Overlap | Size | P Value | Adj. P Value |
|---|
| Num | GO | Overlap | Size | P Value | Adj. P Value |
|---|---|---|---|---|---|
| 1 | NEURON PART | 25 | 1265 | 9.455e-07 | 0.0002355 |
| 2 | NEURON PROJECTION | 21 | 942 | 1.21e-06 | 0.0002355 |
| 3 | CELL BODY | 15 | 494 | 1.163e-06 | 0.0002355 |
| 4 | SOMATODENDRITIC COMPARTMENT | 17 | 650 | 1.679e-06 | 0.0002452 |
| 5 | SYNAPSE | 17 | 754 | 1.199e-05 | 0.0014 |
| 6 | MEMBRANE REGION | 21 | 1134 | 2.11e-05 | 0.002054 |
| 7 | CELL JUNCTION | 21 | 1151 | 2.628e-05 | 0.002193 |
| 8 | PLASMA MEMBRANE PROTEIN COMPLEX | 13 | 510 | 3.944e-05 | 0.002879 |
| 9 | CELL PROJECTION | 27 | 1786 | 4.658e-05 | 0.003022 |
| 10 | DENDRITE | 12 | 451 | 5.255e-05 | 0.003069 |
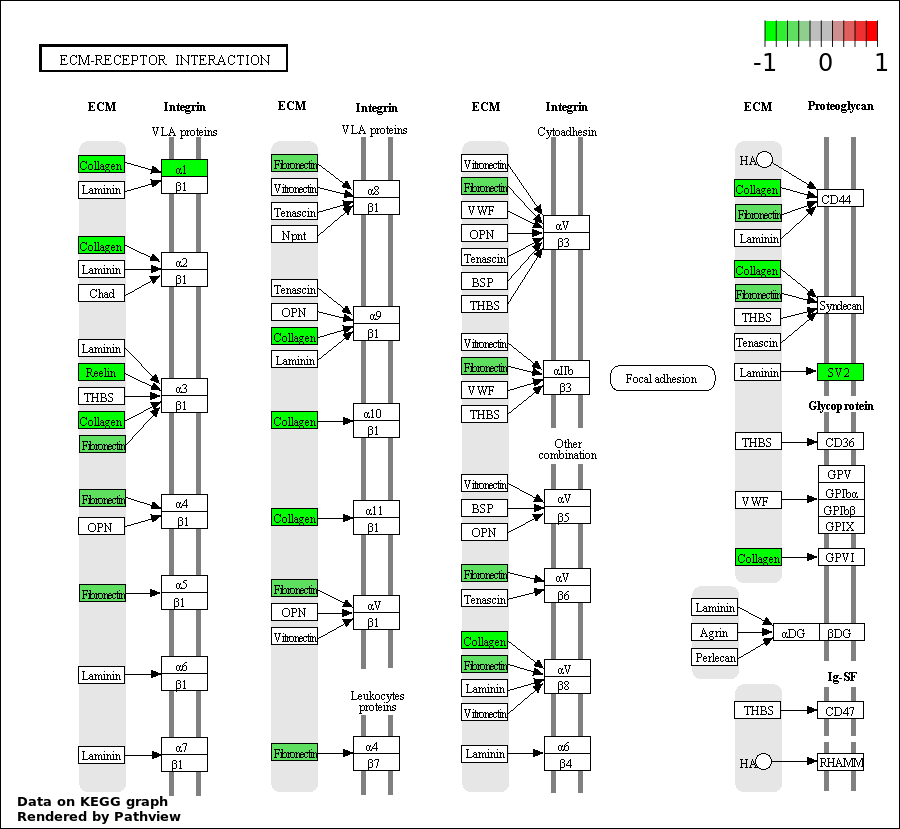
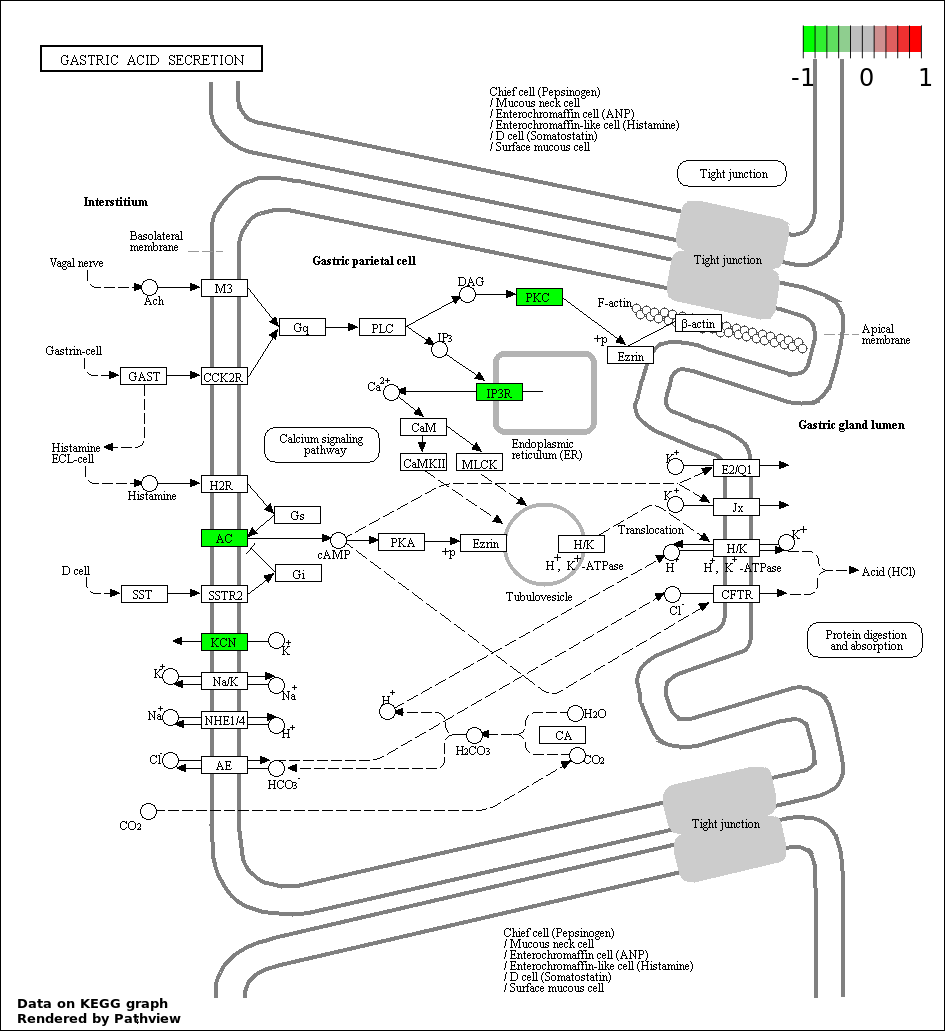
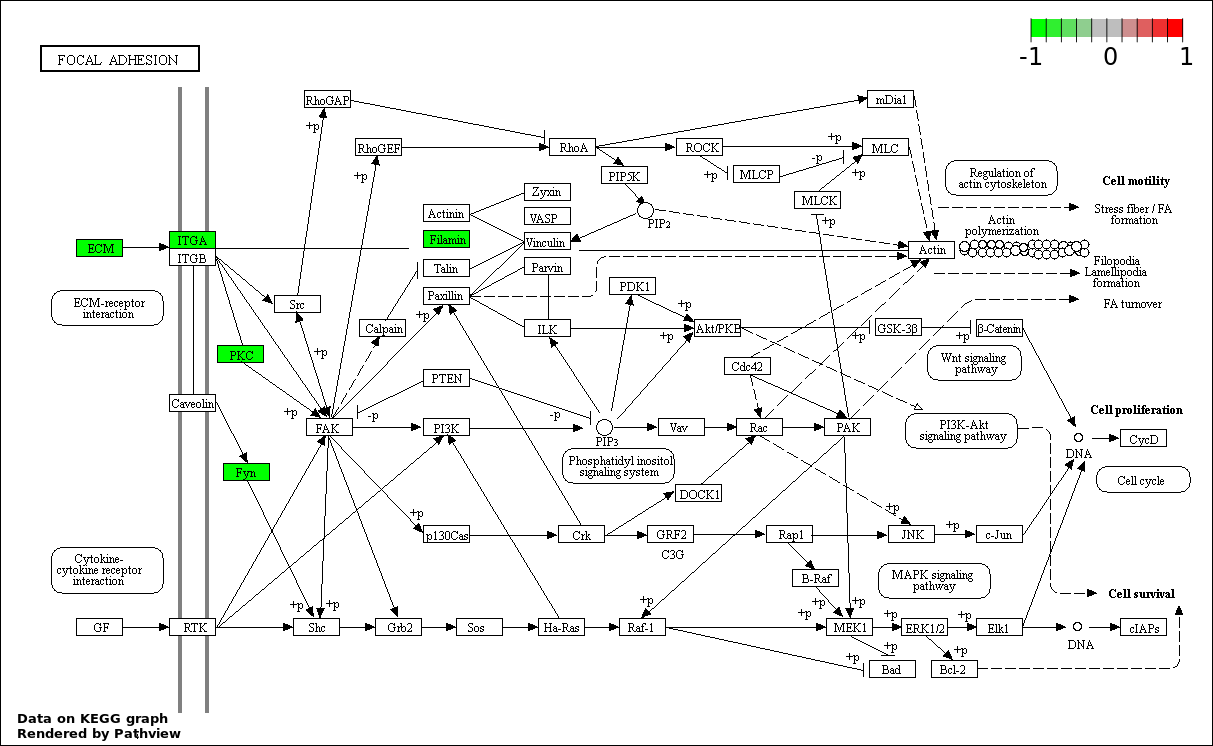
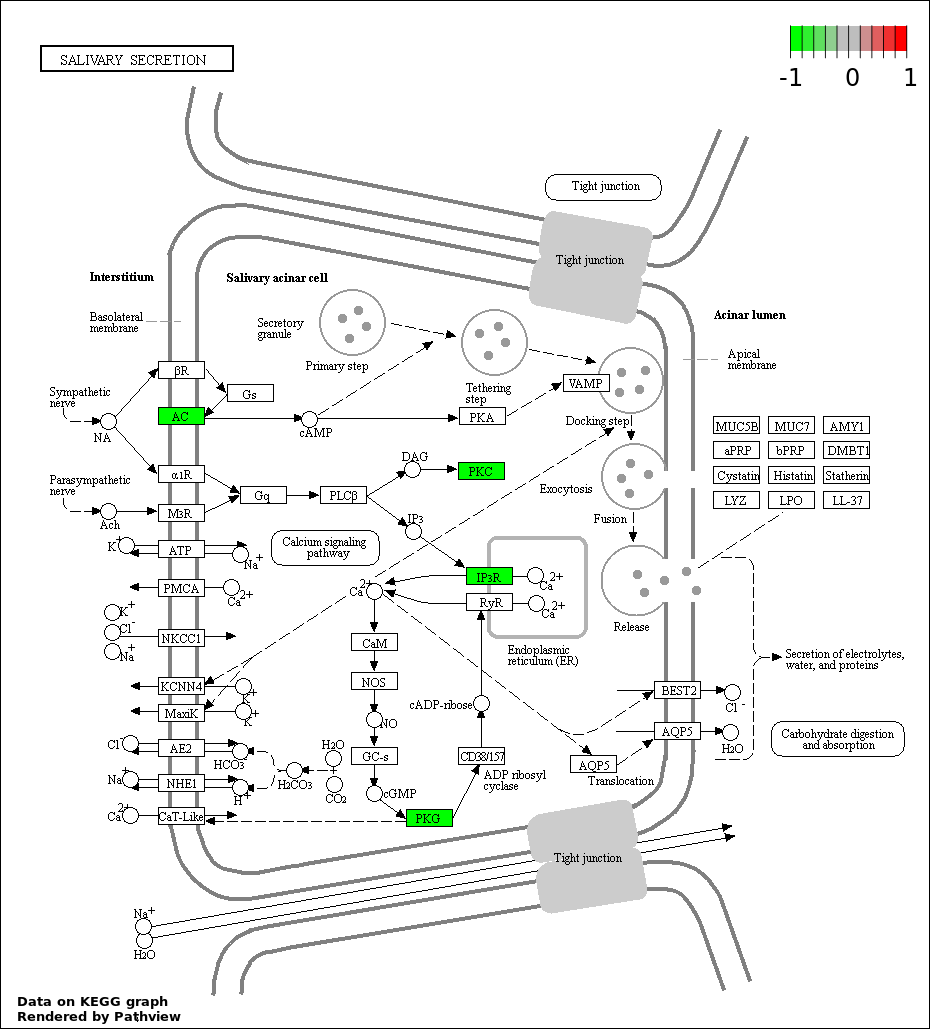
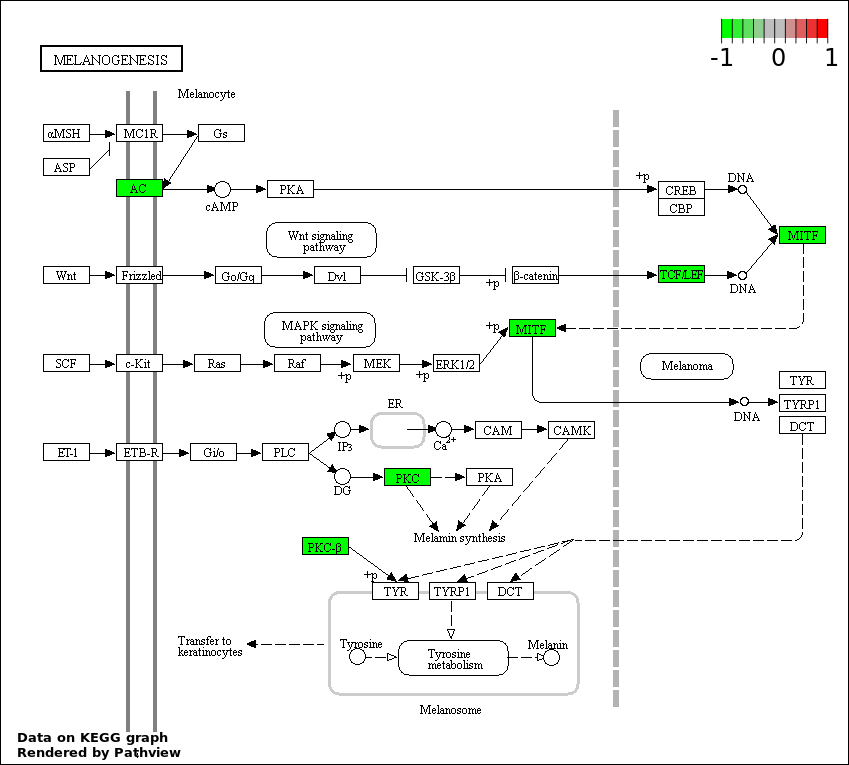
Over-represented Pathway
| Num | Pathway | Pathview | Overlap | Size | P Value | Adj. P Value |
|---|---|---|---|---|---|---|
| 1 | hsa04270_Vascular_smooth_muscle_contraction | 7 | 116 | 1.316e-05 | 0.002329 | |
| 2 | hsa04512_ECM.receptor_interaction | 5 | 85 | 0.0002675 | 0.02059 | |
| 3 | hsa04540_Gap_junction | 5 | 90 | 0.0003489 | 0.02059 | |
| 4 | hsa04971_Gastric_acid_secretion | 4 | 74 | 0.001542 | 0.06812 | |
| 5 | hsa04514_Cell_adhesion_molecules_.CAMs. | 5 | 136 | 0.002237 | 0.06812 | |
| 6 | hsa04510_Focal_adhesion | 6 | 200 | 0.002309 | 0.06812 | |
| 7 | hsa04970_Salivary_secretion | 4 | 89 | 0.00303 | 0.07662 | |
| 8 | hsa04912_GnRH_signaling_pathway | 4 | 101 | 0.004765 | 0.09371 | |
| 9 | hsa04916_Melanogenesis | 4 | 101 | 0.004765 | 0.09371 | |
| 10 | hsa04020_Calcium_signaling_pathway | 5 | 177 | 0.006844 | 0.1211 | |
| 11 | hsa04010_MAPK_signaling_pathway | 6 | 268 | 0.009447 | 0.152 | |
| 12 | hsa04720_Long.term_potentiation | 3 | 70 | 0.01161 | 0.1581 | |
| 13 | hsa04730_Long.term_depression | 3 | 70 | 0.01161 | 0.1581 | |
| 14 | hsa04810_Regulation_of_actin_cytoskeleton | 5 | 214 | 0.0147 | 0.1859 | |
| 15 | hsa04972_Pancreatic_secretion | 3 | 101 | 0.03046 | 0.3595 | |
| 16 | hsa04380_Osteoclast_differentiation | 3 | 128 | 0.05489 | 0.5932 | |
| 17 | hsa04360_Axon_guidance | 3 | 130 | 0.05698 | 0.5932 | |
| 18 | hsa04920_Adipocytokine_signaling_pathway | 2 | 68 | 0.07625 | 0.7498 | |
| 19 | hsa04520_Adherens_junction | 2 | 73 | 0.08611 | 0.7574 | |
| 20 | hsa04260_Cardiac_muscle_contraction | 2 | 77 | 0.09427 | 0.7574 | |
| 21 | hsa04070_Phosphatidylinositol_signaling_system | 2 | 78 | 0.09634 | 0.7574 | |
| 22 | hsa04664_Fc_epsilon_RI_signaling_pathway | 2 | 79 | 0.09842 | 0.7574 | |
| 23 | hsa04012_ErbB_signaling_pathway | 2 | 87 | 0.1155 | 0.8521 | |
| 24 | hsa04666_Fc_gamma_R.mediated_phagocytosis | 2 | 95 | 0.1333 | 0.9017 | |
| 25 | hsa04062_Chemokine_signaling_pathway | 3 | 189 | 0.1338 | 0.9017 | |
| 26 | hsa04114_Oocyte_meiosis | 2 | 114 | 0.1777 | 1 | |
| 27 | hsa04670_Leukocyte_transendothelial_migration | 2 | 117 | 0.1849 | 1 | |
| 28 | hsa04530_Tight_junction | 2 | 133 | 0.224 | 1 | |
| 29 | hsa04650_Natural_killer_cell_mediated_cytotoxicity | 2 | 136 | 0.2314 | 1 | |
| 30 | hsa04910_Insulin_signaling_pathway | 2 | 138 | 0.2363 | 1 | |
| 31 | hsa04310_Wnt_signaling_pathway | 2 | 151 | 0.2686 | 1 | |
| 32 | hsa04630_Jak.STAT_signaling_pathway | 2 | 155 | 0.2785 | 1 | |
| 33 | hsa00230_Purine_metabolism | 2 | 162 | 0.2958 | 1 |