This regulatory network was inferred from the input dataset. The miRNAs and mRNAs are
presented as round and rectangle nodes respectively. The numerical value popped up upon mouse over the gene node is the log2 transformed fold-change of the gene expression between the two groups. All of the nodes are clickable, and the detailed information of the miRNAs/mRNAs and related cancer pathway will be displayed in another window. The edges between nodes are supported by both interactions (predicted or experimentally verified) and correlations learnt from cancer dataset. The numerical value popped up upon mouse over the edge is the correlation beat value (effect size) between the two nodes. The experimental evidences of the edges reported in previous cancer studies are highlighted by red/orange color. All of these information can be accessed by the "mouse-over" action. This network shows a full map of the miRNA-mRNA regulation of the input gene list(s), and the hub miRNAs (with the high network degree/betweenness centrality) would be the potential cancer drivers or tumor suppressors. The full result table can be accessed in the "Regulations" tab.
"miRNACancerMAP" is also a network visualization tool for users to draw their regulatory network by personal customization. Users can set the complexity of the network by limiting the number of nodes or edges. And the color of the nodes can be defined by different categories of the mRNAs and miRNAs, such as Gene-Ontology, pathway, and expression status. Users can also select to use network degree or network betweenness centrality to define the node size. And edges can be black or colored by the correlation. Purple edge means negative correlation (mostly found between miRNA and mRNA), and blue edge means positive correlation (found in PPI or miRNA-miRNA sponge effect). We can also add the protein-protein interactions (PPI) into the network. This result will show the cluster of genes regulated by some specific miRNAs. Additionally, miRNA-miRNA edges can be added by the "miRNA sponge" button, presenting some clusters of miRNAs that have the interactions via sponge effect.
miRNA-gene regulations
| Num | microRNA | Gene | miRNA log2FC | miRNA pvalue | Gene log2FC | Gene pvalue | Interaction | Correlation beta | Correlation P-value | PMID | Reported in cancer studies |
|---|---|---|---|---|---|---|---|---|---|---|---|
| 1 | hsa-miR-155-5p | ABCC4 | -0.39 | 0.78945 | -0.02 | 0.977 | miRNAWalker2 validate | -0.22 | 0.00218 | NA | |
| 2 | hsa-miR-155-5p | ABL2 | -0.39 | 0.78945 | 0.09 | 0.91468 | mirMAP | -0.11 | 0.00074 | NA | |
| 3 | hsa-miR-155-5p | ACSL6 | -0.39 | 0.78945 | 1.05 | 0.17112 | mirMAP | -0.95 | 1.0E-5 | NA | |
| 4 | hsa-miR-155-5p | ADD3 | -0.39 | 0.78945 | 0.14 | 0.91713 | MirTarget; miRNATAP | -0.13 | 0.00221 | NA | |
| 5 | hsa-miR-155-5p | AGTR1 | -0.39 | 0.78945 | 0.22 | 0.75375 | miRNAWalker2 validate; miRTarBase | -0.58 | 0.00073 | 22525818 | MicroRNA-155 miR-155 is one of the micro RNAs miRNA most consistently involved in neoplastic diseases and it is known to repress the angiotensin II type 1 receptor AGTR1; The aim of the present study was to evaluate the expressions of miR-155 and AGTR1 and to clarify the potential efficacy of anti-miR-155 alone and in combination with AGTR1 blocker losartan in endometrial cancers; Expressions of miR-155 and AGTR1 were evaluated using real-time PCR and immunohistochemistry; miR-155 was over-expressed and AGTR1 was underexpressed in endometrial carcinoma tissues; We checked that abolishing the function of miR-155 and AGTR1 by anti-miR-155 or losartan inhibited cell survival of endometrial carcinoma cells respectively and furthermore combined treatment showed synergistic effects; In this study we characterized the expressions of miR-155 and AGTR1 in endometrial tissues; The combined treatment with anti-miR-155 and losartan has a synergistic antiproliferative effect and an improved understanding is required to clarify whether miR-155 and AGTR1 can be used as a novel therapeutic target in endometrial cancer |
| 6 | hsa-miR-155-5p | ALDH5A1 | -0.39 | 0.78945 | 0.04 | 0.96231 | miRNAWalker2 validate | -0.13 | 0.01007 | NA | |
| 7 | hsa-miR-155-5p | AMIGO2 | -0.39 | 0.78945 | 0.19 | 0.80365 | miRNAWalker2 validate | -0.21 | 0.01429 | NA | |
| 8 | hsa-miR-155-5p | ANKH | -0.39 | 0.78945 | 0.21 | 0.86724 | mirMAP | -0.33 | 0 | NA | |
| 9 | hsa-miR-155-5p | ARHGAP18 | -0.39 | 0.78945 | 0.08 | 0.94122 | MirTarget | -0.14 | 0.00064 | NA | |
| 10 | hsa-miR-155-5p | ARL15 | -0.39 | 0.78945 | 0.33 | 0.62789 | miRNAWalker2 validate; miRNATAP | -0.15 | 0.00054 | NA | |
| 11 | hsa-miR-155-5p | ARMC2 | -0.39 | 0.78945 | -0.09 | 0.75269 | miRNAWalker2 validate | -0.22 | 0.00128 | NA | |
| 12 | hsa-miR-155-5p | ASNS | -0.39 | 0.78945 | 0.38 | 0.71317 | miRNAWalker2 validate | -0.16 | 0.00517 | NA | |
| 13 | hsa-miR-155-5p | ATP6V1H | -0.39 | 0.78945 | 0.02 | 0.98634 | miRNAWalker2 validate | -0.13 | 0.00011 | NA | |
| 14 | hsa-miR-155-5p | ATRNL1 | -0.39 | 0.78945 | 0.29 | 0.66607 | MirTarget; mirMAP | -0.47 | 0.00111 | NA | |
| 15 | hsa-miR-155-5p | BCORL1 | -0.39 | 0.78945 | 0.08 | 0.92003 | MirTarget | -0.1 | 0.01555 | NA | |
| 16 | hsa-miR-155-5p | BRPF3 | -0.39 | 0.78945 | 0.07 | 0.95006 | miRNAWalker2 validate; miRTarBase | -0.17 | 0 | NA | |
| 17 | hsa-miR-155-5p | BRWD3 | -0.39 | 0.78945 | 0.13 | 0.84771 | miRNATAP | -0.19 | 0.00012 | NA | |
| 18 | hsa-miR-155-5p | CAB39L | -0.39 | 0.78945 | 0.42 | 0.57664 | miRNAWalker2 validate | -0.57 | 0 | NA | |
| 19 | hsa-miR-155-5p | CACNB4 | -0.39 | 0.78945 | 0.22 | 0.59018 | mirMAP; miRNATAP | -0.32 | 0.00255 | NA | |
| 20 | hsa-miR-155-5p | CADM2 | -0.39 | 0.78945 | 0.76 | 0.4386 | mirMAP | -0.27 | 0.04245 | NA | |
| 21 | hsa-miR-155-5p | CARS2 | -0.39 | 0.78945 | 0.13 | 0.90307 | miRNAWalker2 validate | -0.1 | 0.01453 | NA | |
| 22 | hsa-miR-155-5p | CAT | -0.39 | 0.78945 | 0.09 | 0.94026 | miRNAWalker2 validate | -0.13 | 0.00087 | NA | |
| 23 | hsa-miR-155-5p | CDH13 | -0.39 | 0.78945 | 0.11 | 0.87193 | miRNAWalker2 validate | -0.33 | 0 | NA | |
| 24 | hsa-miR-155-5p | CDH6 | -0.39 | 0.78945 | 0.2 | 0.56314 | miRNAWalker2 validate | -0.28 | 0.00012 | NA | |
| 25 | hsa-miR-155-5p | CDX1 | -0.39 | 0.78945 | 0.02 | 0.99063 | MirTarget | -0.21 | 0.0203 | NA | |
| 26 | hsa-miR-155-5p | CEP68 | -0.39 | 0.78945 | 0.01 | 0.98851 | MirTarget | -0.2 | 0 | NA | |
| 27 | hsa-miR-155-5p | CFL2 | -0.39 | 0.78945 | -0.06 | 0.92086 | miRNAWalker2 validate | -0.13 | 0.0473 | NA | |
| 28 | hsa-miR-155-5p | CHD9 | -0.39 | 0.78945 | -0.03 | 0.975 | miRNAWalker2 validate | -0.1 | 0.00688 | NA | |
| 29 | hsa-miR-155-5p | CLDN1 | -0.39 | 0.78945 | 0.5 | 0.67614 | miRNAWalker2 validate; miRTarBase | -0.24 | 0.00592 | 23523916; 23588589 | MicroRNA 155 is a novel suppressor of ovarian cancer initiating cells that targets CLDN1; Here we show that the downregulation of miR-155 in OCICs correlates with CLDN1 overexpression and the suppression of OCIC invasion; Luciferase assays indicate that miR-155 targets CLDN1 mRNA on the 3' UTR; Thus overexpression of miR-155 may prevent tumorigenesis in human ovarian cancer through downregulation of CLDN1;Upregulation of microRNA 155 promotes the migration and invasion of colorectal cancer cells through the regulation of claudin 1 expression; Furthermore the overexpression of miR-155 upregulated claudin-1 expression; Thus our data suggest that miR-155 plays an important role in promoting CRC cell migration and invasion at least in part through the regulation of claudin-1 expression and controlling metastasis in CRC |
| 30 | hsa-miR-155-5p | CLIC4 | -0.39 | 0.78945 | 0.22 | 0.85599 | miRNAWalker2 validate | -0.2 | 0.00081 | NA | |
| 31 | hsa-miR-155-5p | CNTN3 | -0.39 | 0.78945 | 1 | 0.10009 | MirTarget | -0.38 | 0.02319 | NA | |
| 32 | hsa-miR-155-5p | COBLL1 | -0.39 | 0.78945 | 0.15 | 0.86329 | mirMAP | -0.24 | 0 | NA | |
| 33 | hsa-miR-155-5p | CSE1L | -0.39 | 0.78945 | 0.12 | 0.92857 | miRNAWalker2 validate | -0.13 | 0.00187 | NA | |
| 34 | hsa-miR-155-5p | CTNNBL1 | -0.39 | 0.78945 | 0.11 | 0.92164 | miRNAWalker2 validate | -0.14 | 0.0013 | NA | |
| 35 | hsa-miR-155-5p | CUL4B | -0.39 | 0.78945 | 0.14 | 0.89837 | miRNAWalker2 validate | -0.15 | 0 | NA | |
| 36 | hsa-miR-155-5p | CUX1 | -0.39 | 0.78945 | 0 | 0.9999 | miRNAWalker2 validate | -0.15 | 7.0E-5 | NA | |
| 37 | hsa-miR-155-5p | DET1 | -0.39 | 0.78945 | 0.03 | 0.94183 | miRNAWalker2 validate; miRTarBase | -0.11 | 0.00073 | NA | |
| 38 | hsa-miR-155-5p | DIXDC1 | -0.39 | 0.78945 | -0.07 | 0.91444 | MirTarget | -0.14 | 0.00694 | NA | |
| 39 | hsa-miR-155-5p | DMD | -0.39 | 0.78945 | 0.06 | 0.92185 | miRNAWalker2 validate | -0.57 | 0 | NA | |
| 40 | hsa-miR-155-5p | DYNC1I1 | -0.39 | 0.78945 | 0.56 | 0.24386 | MirTarget; miRNATAP | -0.42 | 0.00094 | NA | |
| 41 | hsa-miR-155-5p | EEF1A2 | -0.39 | 0.78945 | 0.55 | 0.35456 | miRNAWalker2 validate | -0.35 | 0.03563 | NA | |
| 42 | hsa-miR-155-5p | EIF3E | -0.39 | 0.78945 | 0.19 | 0.9046 | miRNAWalker2 validate | -0.19 | 0 | NA | |
| 43 | hsa-miR-155-5p | ELAVL2 | -0.39 | 0.78945 | 1.49 | 0.03805 | miRNATAP | -0.82 | 1.0E-5 | NA | |
| 44 | hsa-miR-155-5p | ETNK2 | -0.39 | 0.78945 | 0.17 | 0.67035 | miRNATAP | -0.56 | 0 | NA | |
| 45 | hsa-miR-155-5p | FAM105A | -0.39 | 0.78945 | 0.26 | 0.81361 | MirTarget | -0.35 | 0 | NA | |
| 46 | hsa-miR-155-5p | FNDC3B | -0.39 | 0.78945 | 0.11 | 0.92577 | miRNAWalker2 validate | -0.11 | 0.00292 | NA | |
| 47 | hsa-miR-155-5p | FOXO3 | -0.39 | 0.78945 | -0.25 | 0.82525 | miRNAWalker2 validate; miRTarBase | -0.14 | 0.00074 | 27596294; 25480585; 20371610; 26398931; 22027557; 27107135 | MiR-155 targets 3´UTR region of multiple components of the pro-oncogenic signaling cascades including FOXO3a tumor suppressor and RUNX2 transcription factor regulating metastatic potential in BC;The effect of miRNA155 on FOXO3a expression was examined by Western blotting; FOXO3a was found to be a possible target of miRNA155 as suggested by Targetscan website;MicroRNA 155 regulates cell survival growth and chemosensitivity by targeting FOXO3a in breast cancer; In this study we demonstrate the critical role of miR-155 in regulation of cell survival and chemosensitivity through down-regulation of FOXO3a in breast cancer; Further we identified FOXO3a as a direct target of miR-155; Sustained overexpression of miR-155 resulted in repression of FOXO3a protein without changing mRNA levels and knockdown of miR-155 increases FOXO3a; Finally inverse correlation between miR-155 and FOXO3a levels were observed in a panel of breast cancer cell lines and tumors; In conclusion our study reveals a molecular link between miR-155 and FOXO3a and presents evidence that miR-155 is a critical therapeutic target in breast cancer;In contrast downregulation of miR-155-5p increased sensitivity to bufalin and upregulated the expression of FOXO3A;Here we show that hypoxic conditions induce miR-155 expression in lung cancer cells and trigger a corresponding decrease in a validated target FOXO3A;Our results further revealed that forkhead box O3a FoxO3a was a miR-155 target in the heart; And miR-155 directly repressed FoxO3a whose expression was mitigated in miR-155 agomir and mimic treatment in vivo and in vitro |
| 48 | hsa-miR-155-5p | FOXP4 | -0.39 | 0.78945 | -0.06 | 0.96165 | mirMAP | -0.19 | 0 | NA | |
| 49 | hsa-miR-155-5p | FRYL | -0.39 | 0.78945 | -0.11 | 0.92898 | miRNATAP | -0.16 | 0.00041 | NA | |
| 50 | hsa-miR-155-5p | FSD1L | -0.39 | 0.78945 | 0.19 | 0.70683 | mirMAP | -0.18 | 0.00574 | NA | |
| 51 | hsa-miR-155-5p | GABRB2 | -0.39 | 0.78945 | 0.87 | 0.22364 | mirMAP | -0.58 | 0.003 | NA | |
| 52 | hsa-miR-155-5p | GFPT1 | -0.39 | 0.78945 | -0.09 | 0.95113 | mirMAP | -0.11 | 0.00998 | NA | |
| 53 | hsa-miR-155-5p | GLB1 | -0.39 | 0.78945 | 0.06 | 0.96298 | miRNAWalker2 validate | -0.16 | 0 | NA | |
| 54 | hsa-miR-155-5p | GNAS | -0.39 | 0.78945 | -0.08 | 0.96312 | miRNAWalker2 validate; MirTarget | -0.14 | 0.00083 | NA | |
| 55 | hsa-miR-155-5p | GPM6B | -0.39 | 0.78945 | -0.02 | 0.94382 | miRNAWalker2 validate; MirTarget | -0.26 | 0.00565 | NA | |
| 56 | hsa-miR-155-5p | GRIP1 | -0.39 | 0.78945 | 0.49 | 0.20748 | miRNATAP | -0.47 | 3.0E-5 | NA | |
| 57 | hsa-miR-155-5p | GSK3B | -0.39 | 0.78945 | 0.06 | 0.95674 | miRNAWalker2 validate; miRNATAP | -0.1 | 0 | NA | |
| 58 | hsa-miR-155-5p | GYG1 | -0.39 | 0.78945 | 0.11 | 0.91181 | MirTarget | -0.12 | 3.0E-5 | NA | |
| 59 | hsa-miR-155-5p | H3F3A | -0.39 | 0.78945 | 0.06 | 0.96489 | MirTarget; miRNATAP | -0.11 | 0.00259 | NA | |
| 60 | hsa-miR-155-5p | HBP1 | -0.39 | 0.78945 | 0.01 | 0.99281 | miRNAWalker2 validate; MirTarget; miRNATAP | -0.1 | 0.00108 | 25666090 | miR 155 promotes the growth of osteosarcoma in a HBP1 dependent mechanism; HMG-box transcription factor 1 HBP1 a strong Wnt pathway suppressor was found to be a target of miR-155; Restoration of HBP1 abolished the effect of miR-155 on OS cells |
| 61 | hsa-miR-155-5p | HDAC2 | -0.39 | 0.78945 | -0.02 | 0.98555 | mirMAP | -0.11 | 0.00036 | 21946536 | Mechanistically we found that BRCA1 epigenetically represses miR-155 expression via its association with HDAC2 which deacetylates histones H2A and H3 on the miR-155 promoter |
| 62 | hsa-miR-155-5p | HSD17B12 | -0.39 | 0.78945 | 0.05 | 0.97042 | miRNAWalker2 validate | -0.11 | 0.02313 | NA | |
| 63 | hsa-miR-155-5p | HSDL1 | -0.39 | 0.78945 | 0.16 | 0.84161 | miRNAWalker2 validate | -0.15 | 0 | NA | |
| 64 | hsa-miR-155-5p | HUNK | -0.39 | 0.78945 | 0.4 | 0.65764 | mirMAP | -0.4 | 0.00396 | NA | |
| 65 | hsa-miR-155-5p | IGDCC4 | -0.39 | 0.78945 | -0.14 | 0.72951 | MirTarget | -0.17 | 0.03868 | NA | |
| 66 | hsa-miR-155-5p | IGF1R | -0.39 | 0.78945 | -0.02 | 0.98494 | mirMAP | -0.16 | 0.00074 | NA | |
| 67 | hsa-miR-155-5p | IL17RD | -0.39 | 0.78945 | 0.03 | 0.96742 | mirMAP | -0.4 | 1.0E-5 | NA | |
| 68 | hsa-miR-155-5p | IRF2BP2 | -0.39 | 0.78945 | 0.08 | 0.95705 | MirTarget; miRNATAP | -0.17 | 0 | NA | |
| 69 | hsa-miR-155-5p | JARID2 | -0.39 | 0.78945 | 0.08 | 0.92709 | miRNAWalker2 validate; miRTarBase; MirTarget; miRNATAP | -0.1 | 0.00358 | 23185331 | We furthermore identify Jarid2 a component of Polycomb repressive complex 2 as a novel validated target of miR-K12-11 and confirm its downregulation in miR-K12-11 as well as miR-155 expressing bone marrow cells |
| 70 | hsa-miR-155-5p | JUN | -0.39 | 0.78945 | -0.2 | 0.89168 | miRNAWalker2 validate; miRTarBase | -0.14 | 0.01386 | 23693020 | In the present study we demonstrated for the first time that activation of RAGE by S100P regulates oncogenic microRNA-155 miR-155 expression through Activator Protein-1 AP-1 stimulation in colon cancer cells |
| 71 | hsa-miR-155-5p | KANK2 | -0.39 | 0.78945 | -0.08 | 0.93397 | miRNAWalker2 validate | -0.16 | 0.00332 | NA | |
| 72 | hsa-miR-155-5p | KDELC1 | -0.39 | 0.78945 | 0.38 | 0.43569 | miRNAWalker2 validate | -0.14 | 0.00777 | NA | |
| 73 | hsa-miR-155-5p | KDM5B | -0.39 | 0.78945 | -0.05 | 0.96259 | MirTarget | -0.12 | 0.00435 | NA | |
| 74 | hsa-miR-155-5p | KRT80 | -0.39 | 0.78945 | 0.34 | 0.71365 | miRNAWalker2 validate | -0.19 | 0.02139 | NA | |
| 75 | hsa-miR-155-5p | LCA5 | -0.39 | 0.78945 | 0.04 | 0.88834 | MirTarget | -0.17 | 0.00743 | NA | |
| 76 | hsa-miR-155-5p | LEPROT | -0.39 | 0.78945 | 0.06 | 0.93963 | mirMAP | -0.11 | 0.02022 | NA | |
| 77 | hsa-miR-155-5p | LNX2 | -0.39 | 0.78945 | 0.27 | 0.78712 | miRNAWalker2 validate | -0.22 | 0 | NA | |
| 78 | hsa-miR-155-5p | LONRF2 | -0.39 | 0.78945 | 0.07 | 0.92207 | mirMAP | -0.41 | 0.01981 | NA | |
| 79 | hsa-miR-155-5p | LPP | -0.39 | 0.78945 | -0.16 | 0.81235 | mirMAP; miRNATAP | -0.12 | 0.02933 | NA | |
| 80 | hsa-miR-155-5p | MAP4K3 | -0.39 | 0.78945 | 0.02 | 0.97838 | MirTarget | -0.11 | 0.00021 | NA | |
| 81 | hsa-miR-155-5p | MAVS | -0.39 | 0.78945 | 0.04 | 0.9738 | miRNAWalker2 validate | -0.1 | 0.02041 | NA | |
| 82 | hsa-miR-155-5p | MBLAC2 | -0.39 | 0.78945 | 0.23 | 0.68929 | miRNAWalker2 validate | -0.12 | 0.00202 | NA | |
| 83 | hsa-miR-155-5p | MCAM | -0.39 | 0.78945 | 0.12 | 0.91586 | miRNAWalker2 validate | -0.16 | 0.00586 | NA | |
| 84 | hsa-miR-155-5p | MEST | -0.39 | 0.78945 | -0.03 | 0.98005 | miRNAWalker2 validate | -0.19 | 3.0E-5 | NA | |
| 85 | hsa-miR-155-5p | MLH1 | -0.39 | 0.78945 | -0.01 | 0.99462 | miRNAWalker2 validate; miRTarBase | -0.23 | 0.00447 | 23715647; 21738581 | MLH1 as a direct target of MiR 155 and a potential predictor of favorable prognosis in pancreatic cancer; The regulation of Mut L homologue 1 MLH1 expression by microRNA miR-155 and its prognostic significance in pancreatic cancer PC remain to be elucidated; Then luciferase activity was detected after miR-155 mimics and pRL-TK plasmids containing wild-type and mutant 3'UTRs of MLH1 mRNA were co-transfected; Transfection of miR-155 mimics and inhibitor led to reversely altered protein expressions of miR-155 and MLH1 whereas the corresponding mRNA expressions were similar; MLH1 might serve as a direct target of miR-155 and a potential prognosis predictor in PC;Predicted target mRNAs FGFR1 miR-10 and MLH1 miR-155 were found downregulated |
| 86 | hsa-miR-155-5p | MMP16 | -0.39 | 0.78945 | 0.34 | 0.32953 | mirMAP | -0.27 | 0.00297 | NA | |
| 87 | hsa-miR-155-5p | MPP2 | -0.39 | 0.78945 | 0.24 | 0.35779 | miRNAWalker2 validate | -0.16 | 0.04703 | NA | |
| 88 | hsa-miR-155-5p | MYO10 | -0.39 | 0.78945 | 0.1 | 0.93611 | miRNAWalker2 validate; miRTarBase; MirTarget; miRNATAP | -0.23 | 0 | NA | |
| 89 | hsa-miR-155-5p | MYO1D | -0.39 | 0.78945 | -0.06 | 0.96858 | miRNAWalker2 validate; miRNATAP | -0.16 | 0.00126 | NA | |
| 90 | hsa-miR-155-5p | NES | -0.39 | 0.78945 | -0.04 | 0.96956 | miRNAWalker2 validate | -0.24 | 0.00076 | NA | |
| 91 | hsa-miR-155-5p | NEU1 | -0.39 | 0.78945 | 0.27 | 0.82358 | miRNAWalker2 validate | -0.22 | 6.0E-5 | NA | |
| 92 | hsa-miR-155-5p | NFAT5 | -0.39 | 0.78945 | 0.15 | 0.89465 | mirMAP; miRNATAP | -0.15 | 0.00026 | NA | |
| 93 | hsa-miR-155-5p | NFIA | -0.39 | 0.78945 | 0.02 | 0.98541 | miRNATAP | -0.12 | 0.01424 | NA | |
| 94 | hsa-miR-155-5p | NGEF | -0.39 | 0.78945 | 0.19 | 0.82192 | miRNATAP | -0.19 | 0.0021 | NA | |
| 95 | hsa-miR-155-5p | NUPL2 | -0.39 | 0.78945 | 0.07 | 0.93702 | miRNAWalker2 validate | -0.1 | 0.00474 | NA | |
| 96 | hsa-miR-155-5p | OLFML3 | -0.39 | 0.78945 | 0.23 | 0.76152 | miRNATAP | -0.27 | 0.00221 | NA | |
| 97 | hsa-miR-155-5p | OPHN1 | -0.39 | 0.78945 | 0 | 0.99392 | mirMAP | -0.1 | 0.01552 | NA | |
| 98 | hsa-miR-155-5p | PACSIN3 | -0.39 | 0.78945 | -0.16 | 0.83198 | miRNAWalker2 validate | -0.24 | 0.01036 | NA | |
| 99 | hsa-miR-155-5p | PANK1 | -0.39 | 0.78945 | -0.15 | 0.85501 | miRNATAP | -0.13 | 0.0164 | NA | |
| 100 | hsa-miR-155-5p | PCMTD1 | -0.39 | 0.78945 | 0.18 | 0.85692 | mirMAP | -0.19 | 1.0E-5 | NA | |
| 101 | hsa-miR-155-5p | PCYOX1 | -0.39 | 0.78945 | 0.02 | 0.98777 | miRNAWalker2 validate | -0.1 | 0.00034 | NA | |
| 102 | hsa-miR-155-5p | PDE1A | -0.39 | 0.78945 | 0.32 | 0.38299 | mirMAP | -0.28 | 0.00991 | NA | |
| 103 | hsa-miR-155-5p | PDE3A | -0.39 | 0.78945 | -0.01 | 0.98665 | miRNAWalker2 validate | -0.42 | 0.00086 | NA | |
| 104 | hsa-miR-155-5p | PEG3 | -0.39 | 0.78945 | 0.17 | 0.62677 | miRNATAP | -0.25 | 0.01737 | NA | |
| 105 | hsa-miR-155-5p | PFDN4 | -0.39 | 0.78945 | 0.22 | 0.79662 | miRNAWalker2 validate | -0.19 | 0.00066 | NA | |
| 106 | hsa-miR-155-5p | PGR | -0.39 | 0.78945 | 0.13 | 0.74672 | mirMAP | -0.25 | 0.03036 | 20388420; 19454029; 23162645 | It's indicated that the up-regulation of miR-155 expression was associated with advanced TNM clinical stage median 0.316 0.358 and 0.417 respectively for stage I II and III tumor P = 0.002 lymph node metastasis median 0.383 and 0.355 respectively for cases with positive and negative lymph nodes P = 0.034 higher proliferation index median 0.387 and 0.353 respectively for cases with high proliferation index Ki67 > 10% and low proliferation index Ki67 ≤ 10% P = 0.019 estrogen receptor-positive 0.367 and 0.318 respectively for cases with positive estrogen receptor and negative group P = 0.041 and progesterone receptor-positive 0.398 and 0.335 respectively for cases with positive progesterone receptor and negative group P = 0.029 in patients with breast cancer; The expression of miR-155 is up-regulated in primary breast cancer especially in patients with positive estrogen and progesterone receptor;While the expression of all three miRNAs was similar in samples from healthy women compared to those with breast cancer women with progesterone receptor PR p = 0.016 positive tumors had higher miR-155 expression than tumors that were negative for these receptors;miR 155 and miR 31 are differentially expressed in breast cancer patients and are correlated with the estrogen receptor and progesterone receptor status; The expression levels of miR-155 but not miR-31 were inversely correlated with estrogen receptor ER and progesterone receptor PR expression ER r=-0.353 P=0.003; PR r=-0.357 P=0.003 |
| 107 | hsa-miR-155-5p | PHF14 | -0.39 | 0.78945 | 0.1 | 0.91828 | miRNAWalker2 validate | -0.11 | 0.00037 | NA | |
| 108 | hsa-miR-155-5p | PHGDH | -0.39 | 0.78945 | 0.81 | 0.42989 | miRNAWalker2 validate | -0.44 | 7.0E-5 | NA | |
| 109 | hsa-miR-155-5p | PLAG1 | -0.39 | 0.78945 | 0.56 | 0.16053 | miRNATAP | -0.56 | 0 | NA | |
| 110 | hsa-miR-155-5p | PLEKHA5 | -0.39 | 0.78945 | 0.11 | 0.9059 | miRNAWalker2 validate | -0.14 | 5.0E-5 | NA | |
| 111 | hsa-miR-155-5p | PNPLA4 | -0.39 | 0.78945 | -0.09 | 0.90319 | miRNAWalker2 validate | -0.17 | 0.03407 | NA | |
| 112 | hsa-miR-155-5p | POU2F1 | -0.39 | 0.78945 | -0.13 | 0.68879 | mirMAP | -0.12 | 0.0256 | NA | |
| 113 | hsa-miR-155-5p | PRKG1 | -0.39 | 0.78945 | 0.27 | 0.46388 | miRNATAP | -0.41 | 4.0E-5 | NA | |
| 114 | hsa-miR-155-5p | PROX1 | -0.39 | 0.78945 | -0.09 | 0.89082 | miRNATAP | -0.41 | 2.0E-5 | NA | |
| 115 | hsa-miR-155-5p | PTCHD1 | -0.39 | 0.78945 | -0.66 | 0.40025 | mirMAP | -0.36 | 0.02575 | NA | |
| 116 | hsa-miR-155-5p | PUS7 | -0.39 | 0.78945 | -0.02 | 0.98149 | miRNAWalker2 validate | -0.11 | 0.01015 | NA | |
| 117 | hsa-miR-155-5p | RAB11FIP2 | -0.39 | 0.78945 | 0.16 | 0.82288 | miRNAWalker2 validate; MirTarget; miRNATAP | -0.21 | 0 | NA | |
| 118 | hsa-miR-155-5p | RAB22A | -0.39 | 0.78945 | 0.13 | 0.90978 | mirMAP | -0.11 | 0.00279 | NA | |
| 119 | hsa-miR-155-5p | RAB2A | -0.39 | 0.78945 | -0.15 | 0.8876 | miRNAWalker2 validate | -0.11 | 0.00015 | NA | |
| 120 | hsa-miR-155-5p | RAB6C | -0.39 | 0.78945 | 0.23 | 0.46093 | miRNAWalker2 validate | -0.12 | 0.00131 | NA | |
| 121 | hsa-miR-155-5p | RAP2A | -0.39 | 0.78945 | 0.21 | 0.84247 | mirMAP | -0.12 | 0.00223 | NA | |
| 122 | hsa-miR-155-5p | RAPGEF2 | -0.39 | 0.78945 | 0.09 | 0.92335 | miRNAWalker2 validate; MirTarget | -0.1 | 0.00207 | NA | |
| 123 | hsa-miR-155-5p | RAPGEF4 | -0.39 | 0.78945 | 0.84 | 0.02124 | miRNATAP | -0.35 | 2.0E-5 | NA | |
| 124 | hsa-miR-155-5p | RBP2 | -0.39 | 0.78945 | 0.34 | 0.65414 | MirTarget | -0.83 | 0.00038 | NA | |
| 125 | hsa-miR-155-5p | RCN2 | -0.39 | 0.78945 | 0.09 | 0.93582 | miRNAWalker2 validate; MirTarget | -0.1 | 0.0032 | NA | |
| 126 | hsa-miR-155-5p | REPS2 | -0.39 | 0.78945 | -0.31 | 0.72558 | MirTarget; miRNATAP | -0.2 | 0.00132 | NA | |
| 127 | hsa-miR-155-5p | RHEB | -0.39 | 0.78945 | 0.04 | 0.97071 | miRNAWalker2 validate; miRNATAP | -0.12 | 0.00028 | NA | |
| 128 | hsa-miR-155-5p | RNF2 | -0.39 | 0.78945 | 0.16 | 0.83872 | miRNAWalker2 validate | -0.12 | 0.00029 | NA | |
| 129 | hsa-miR-155-5p | RPGRIP1L | -0.39 | 0.78945 | -0.17 | 0.76832 | mirMAP | -0.12 | 0.00396 | NA | |
| 130 | hsa-miR-155-5p | RPL39 | -0.39 | 0.78945 | 0.21 | 0.82074 | miRNAWalker2 validate | -0.19 | 0.00157 | NA | |
| 131 | hsa-miR-155-5p | SALL1 | -0.39 | 0.78945 | -0.03 | 0.94731 | miRNATAP | -0.38 | 0.00214 | NA | |
| 132 | hsa-miR-155-5p | SATB1 | -0.39 | 0.78945 | 0.62 | 0.46209 | MirTarget; miRNATAP | -0.37 | 2.0E-5 | NA | |
| 133 | hsa-miR-155-5p | SCAMP1 | -0.39 | 0.78945 | 0.15 | 0.88139 | miRNAWalker2 validate | -0.1 | 0.001 | NA | |
| 134 | hsa-miR-155-5p | SCML2 | -0.39 | 0.78945 | 0.34 | 0.45254 | mirMAP | -0.29 | 0.01332 | NA | |
| 135 | hsa-miR-155-5p | SCUBE2 | -0.39 | 0.78945 | 0.24 | 0.57991 | MirTarget | -0.44 | 9.0E-5 | NA | |
| 136 | hsa-miR-155-5p | SECISBP2 | -0.39 | 0.78945 | 0.14 | 0.89354 | miRNAWalker2 validate | -0.1 | 0.0006 | NA | |
| 137 | hsa-miR-155-5p | SEMA5A | -0.39 | 0.78945 | -0.02 | 0.98064 | miRNATAP | -0.42 | 0 | NA | |
| 138 | hsa-miR-155-5p | SERPINA10 | -0.39 | 0.78945 | 0.61 | 0.43294 | MirTarget | -1.43 | 0 | NA | |
| 139 | hsa-miR-155-5p | SH3BP4 | -0.39 | 0.78945 | 0 | 0.9995 | miRNAWalker2 validate | -0.16 | 9.0E-5 | NA | |
| 140 | hsa-miR-155-5p | SIM2 | -0.39 | 0.78945 | 0.29 | 0.67309 | miRNATAP | -0.23 | 0.02853 | NA | |
| 141 | hsa-miR-155-5p | SLC13A3 | -0.39 | 0.78945 | 0.73 | 0.26925 | mirMAP | -0.91 | 0 | NA | |
| 142 | hsa-miR-155-5p | SLC25A36 | -0.39 | 0.78945 | 0.16 | 0.87462 | mirMAP | -0.12 | 4.0E-5 | NA | |
| 143 | hsa-miR-155-5p | SLC30A1 | -0.39 | 0.78945 | 0.12 | 0.87083 | miRNAWalker2 validate | -0.1 | 0.00516 | NA | |
| 144 | hsa-miR-155-5p | SLC35F5 | -0.39 | 0.78945 | 0.03 | 0.97879 | MirTarget | -0.16 | 1.0E-5 | NA | |
| 145 | hsa-miR-155-5p | SLC39A10 | -0.39 | 0.78945 | 0.18 | 0.84429 | miRNAWalker2 validate; miRNATAP | -0.23 | 0 | NA | |
| 146 | hsa-miR-155-5p | SLC7A1 | -0.39 | 0.78945 | 0.27 | 0.83474 | miRNAWalker2 validate | -0.11 | 0.01326 | NA | |
| 147 | hsa-miR-155-5p | SMAD9 | -0.39 | 0.78945 | -0.55 | 0.23355 | mirMAP | -0.61 | 0 | NA | |
| 148 | hsa-miR-155-5p | SORL1 | -0.39 | 0.78945 | 0.12 | 0.92844 | miRNATAP | -0.2 | 0.00048 | NA | |
| 149 | hsa-miR-155-5p | SORT1 | -0.39 | 0.78945 | 0.03 | 0.98121 | MirTarget | -0.16 | 0.00016 | NA | |
| 150 | hsa-miR-155-5p | SOX11 | -0.39 | 0.78945 | 0.41 | 0.30232 | miRNATAP | -0.34 | 0.00222 | NA |
| Num | GO | Overlap | Size | P Value | Adj. P Value |
|---|
| Num | GO | Overlap | Size | P Value | Adj. P Value |
|---|---|---|---|---|---|
| 1 | NUCLEIC ACID BINDING TRANSCRIPTION FACTOR ACTIVITY | 32 | 1199 | 1.936e-07 | 0.0001799 |
| 2 | REGULATORY REGION NUCLEIC ACID BINDING | 23 | 818 | 5.198e-06 | 0.002415 |
| Num | GO | Overlap | Size | P Value | Adj. P Value |
|---|
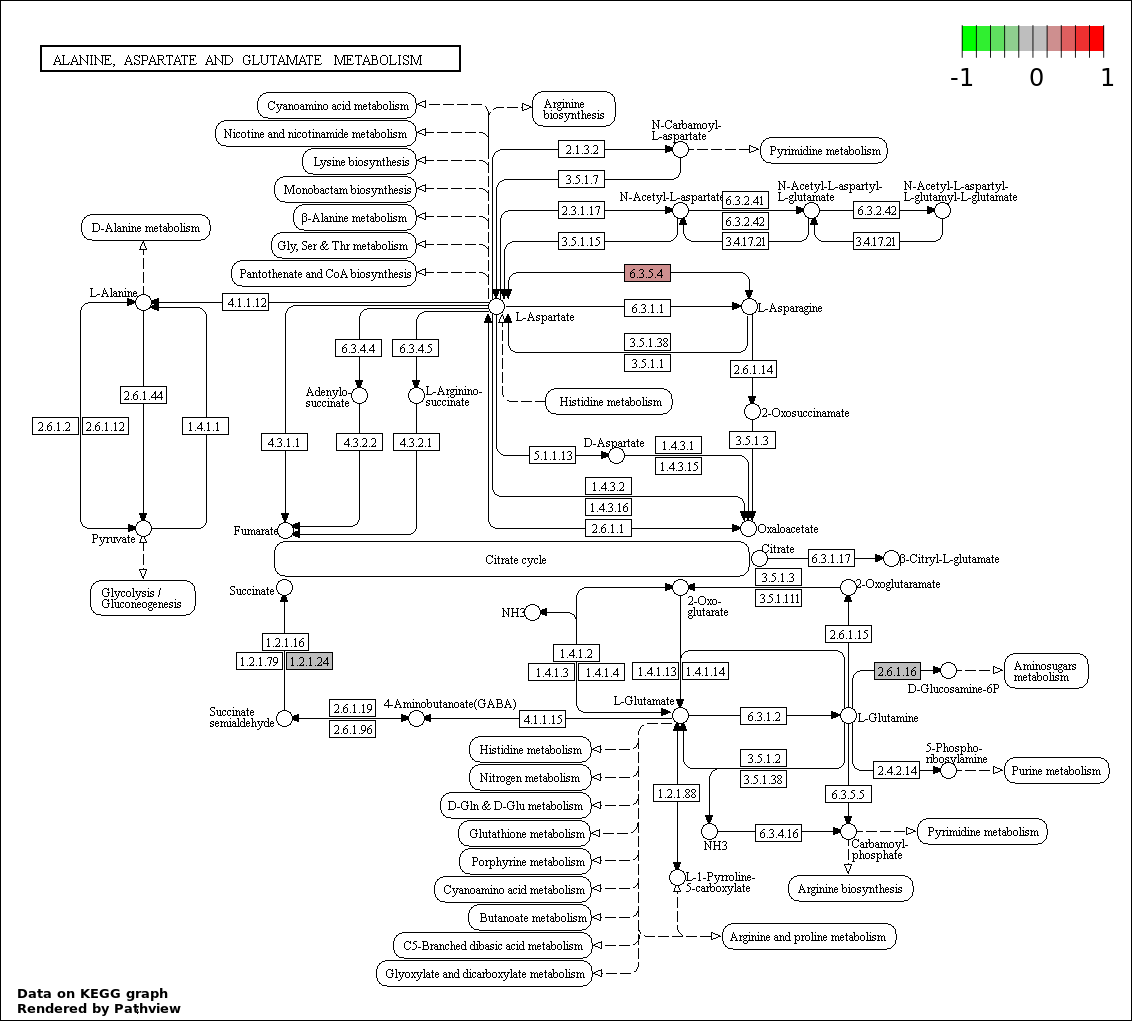
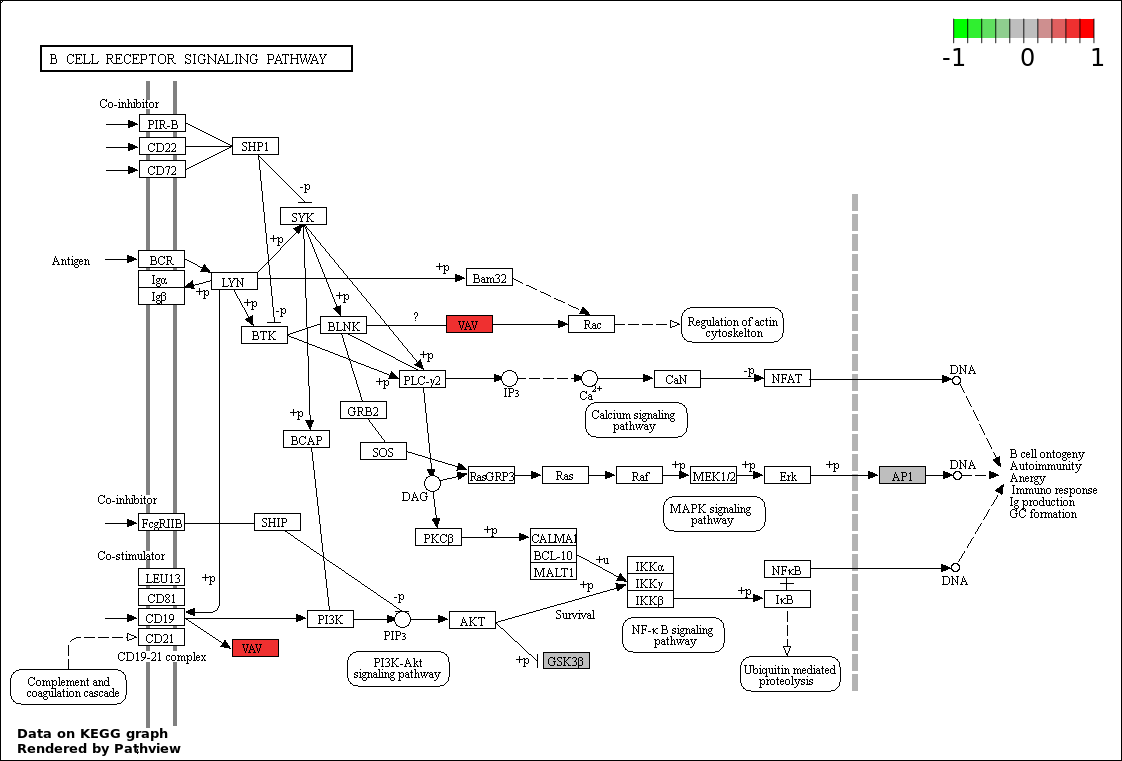
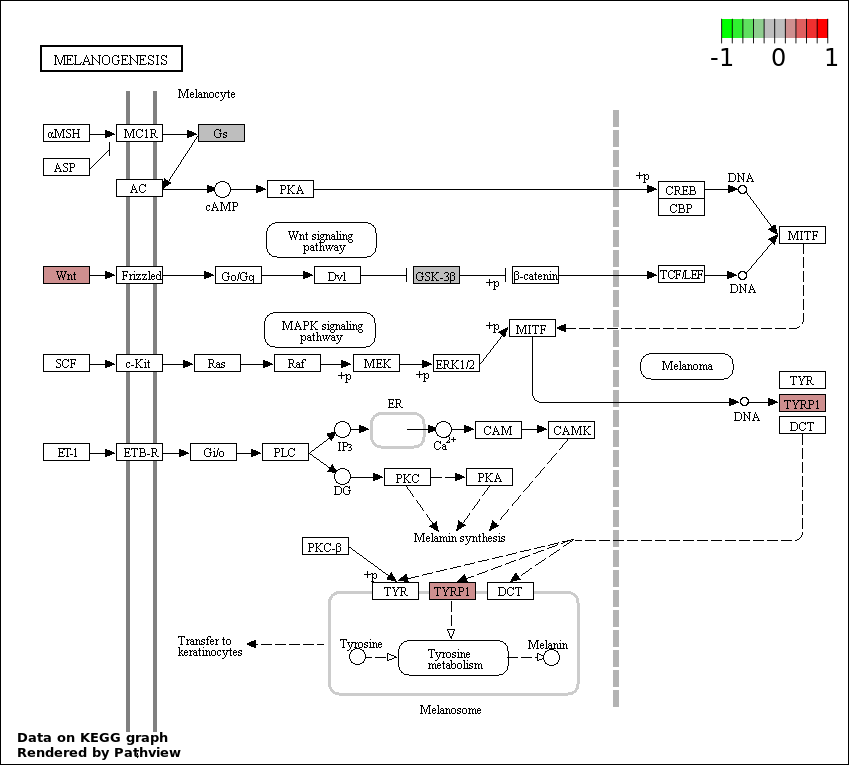
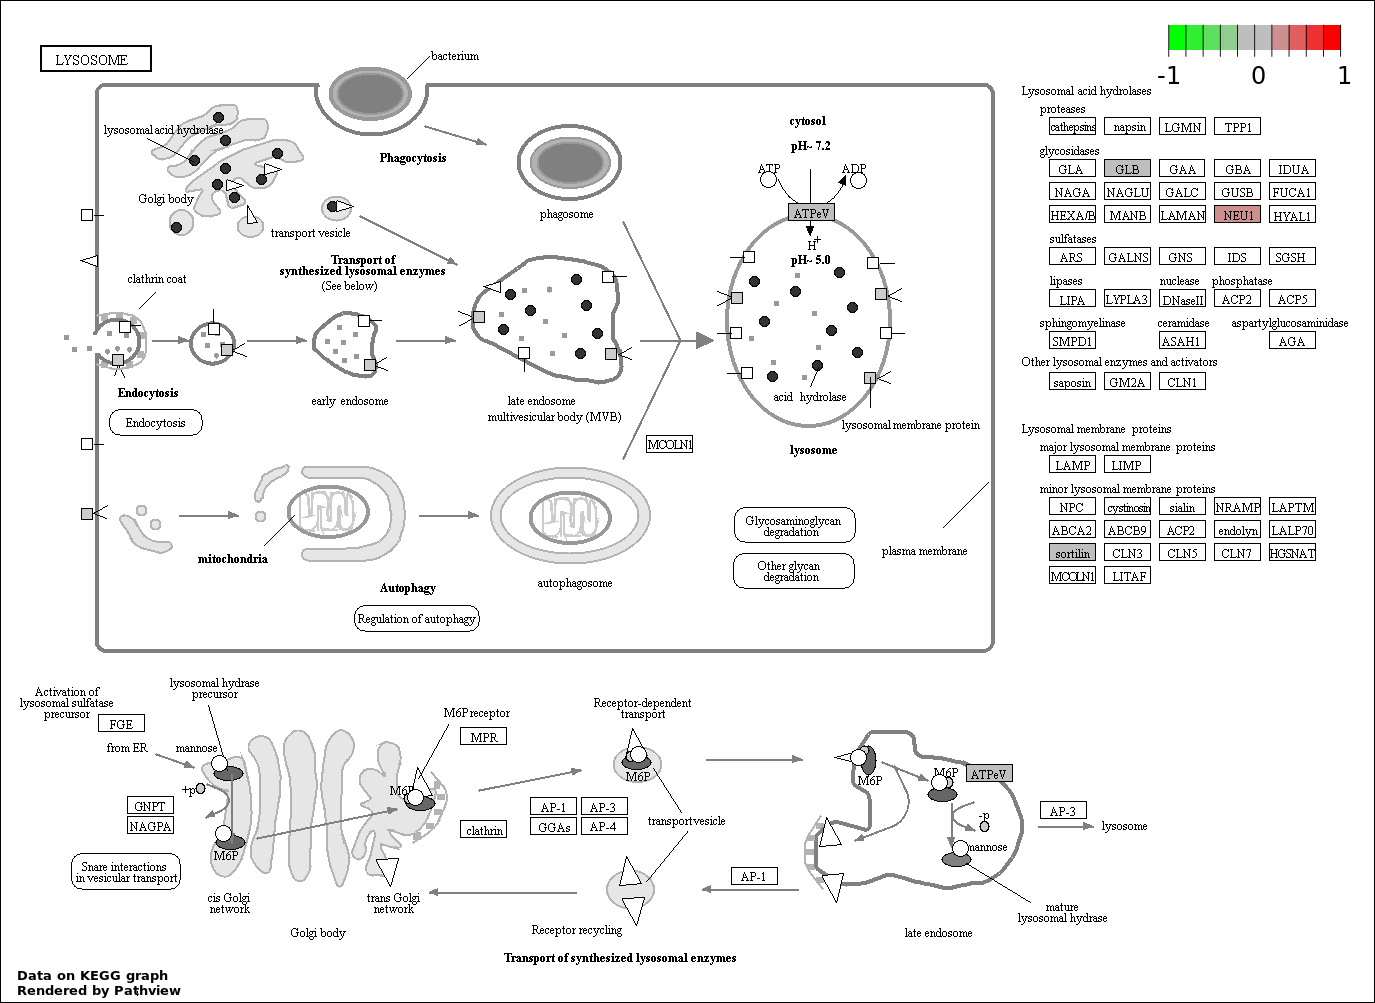
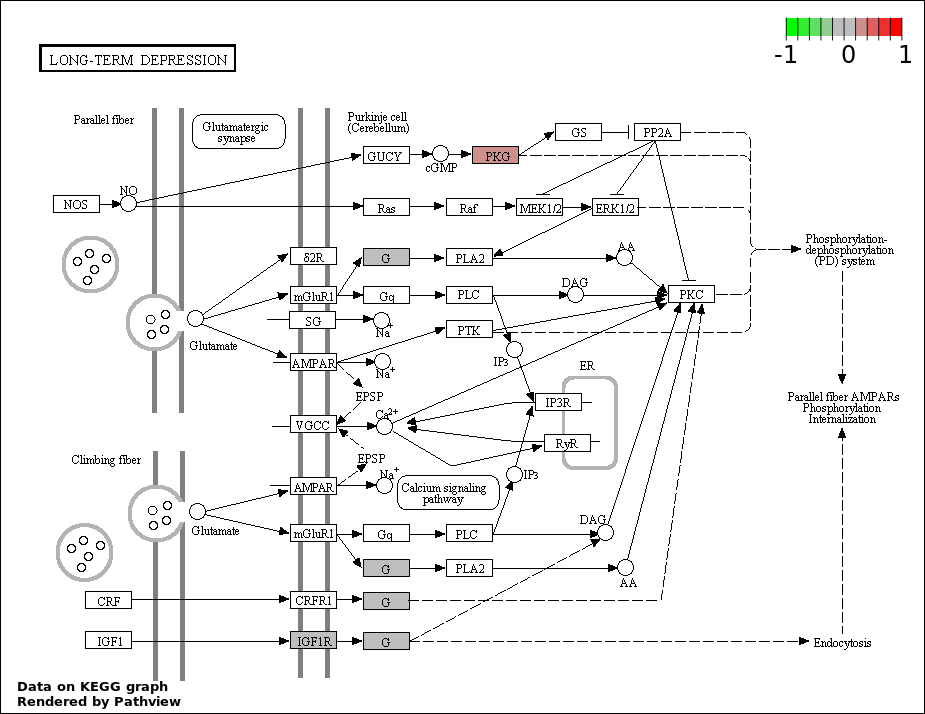
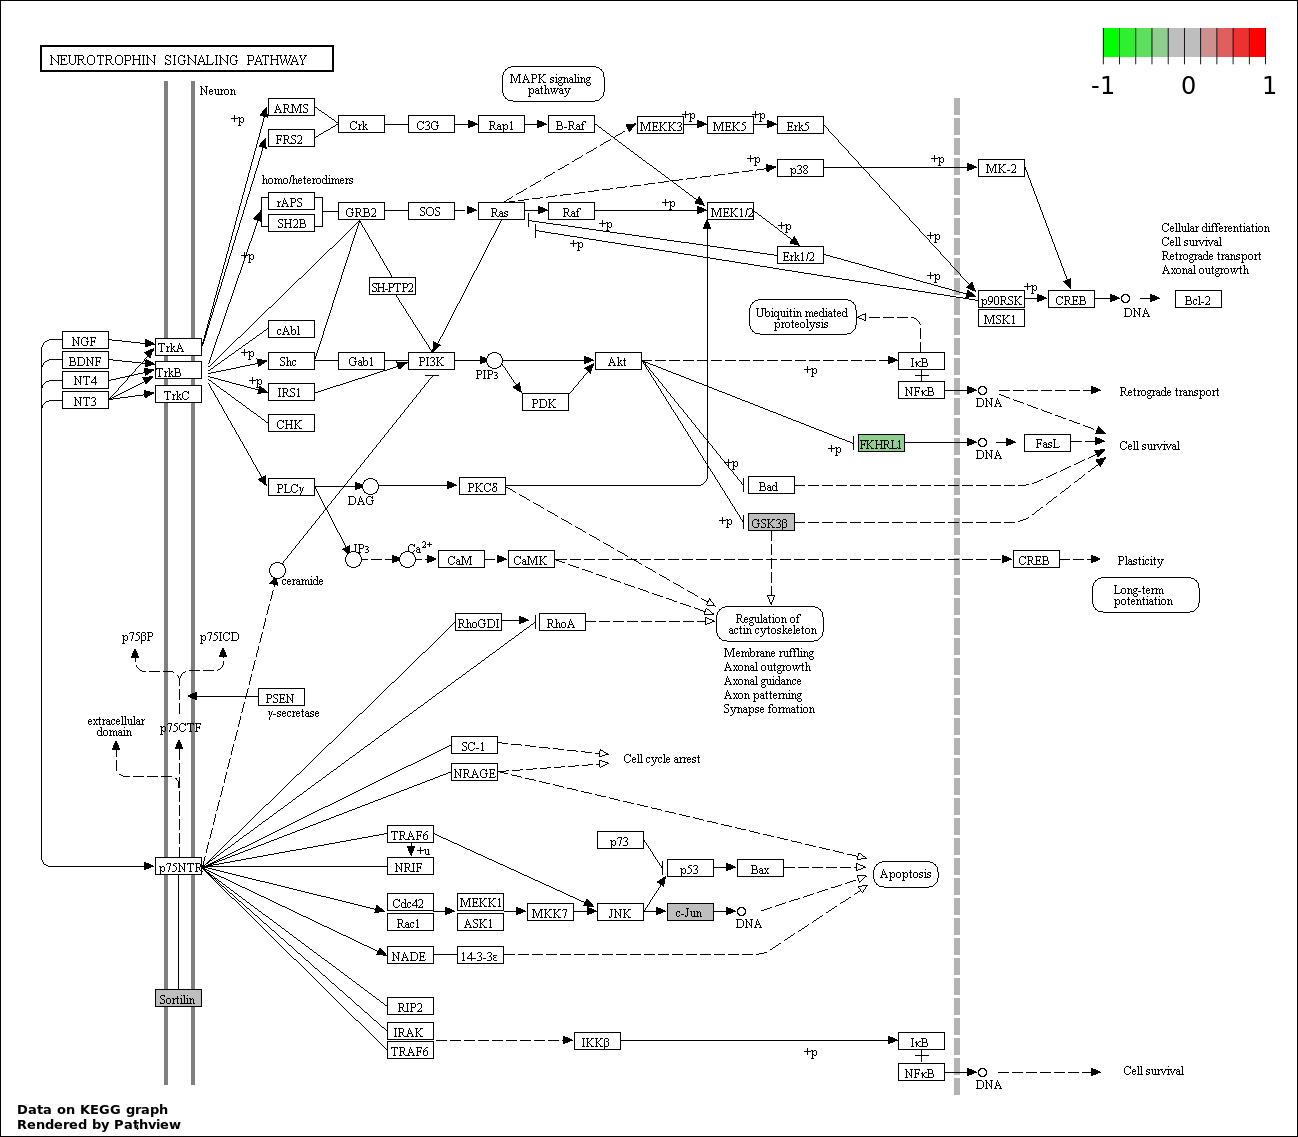
Over-represented Pathway
| Num | Pathway | Pathview | Overlap | Size | P Value | Adj. P Value |
|---|---|---|---|---|---|---|
| 1 | hsa00250_Alanine._aspartate_and_glutamate_metabolism | 3 | 32 | 0.003676 | 0.5257 | |
| 2 | hsa04662_B_cell_receptor_signaling_pathway | 4 | 75 | 0.006214 | 0.5257 | |
| 3 | hsa04360_Axon_guidance | 5 | 130 | 0.008982 | 0.5257 | |
| 4 | hsa00511_Other_glycan_degradation | 2 | 17 | 0.01168 | 0.5257 | |
| 5 | hsa04916_Melanogenesis | 4 | 101 | 0.01719 | 0.6187 | |
| 6 | hsa04660_T_cell_receptor_signaling_pathway | 4 | 108 | 0.02141 | 0.6424 | |
| 7 | hsa04142_Lysosome | 4 | 121 | 0.03083 | 0.6979 | |
| 8 | hsa04730_Long.term_depression | 3 | 70 | 0.03102 | 0.6979 | |
| 9 | hsa04722_Neurotrophin_signaling_pathway | 4 | 127 | 0.03588 | 0.7176 | |
| 10 | hsa04012_ErbB_signaling_pathway | 3 | 87 | 0.05335 | 0.8223 | |
| 11 | hsa04914_Progesterone.mediated_oocyte_maturation | 3 | 87 | 0.05335 | 0.8223 | |
| 12 | hsa00600_Sphingolipid_metabolism | 2 | 40 | 0.05793 | 0.8223 | |
| 13 | hsa04310_Wnt_signaling_pathway | 4 | 151 | 0.06059 | 0.8223 | |
| 14 | hsa04666_Fc_gamma_R.mediated_phagocytosis | 3 | 95 | 0.06592 | 0.8223 | |
| 15 | hsa04962_Vasopressin.regulated_water_reabsorption | 2 | 44 | 0.06853 | 0.8223 | |
| 16 | hsa04150_mTOR_signaling_pathway | 2 | 52 | 0.09139 | 0.9586 | |
| 17 | hsa04742_Taste_transduction | 2 | 52 | 0.09139 | 0.9586 | |
| 18 | hsa04340_Hedgehog_signaling_pathway | 2 | 56 | 0.1035 | 0.9586 | |
| 19 | hsa04270_Vascular_smooth_muscle_contraction | 3 | 116 | 0.1045 | 0.9586 | |
| 20 | hsa04670_Leukocyte_transendothelial_migration | 3 | 117 | 0.1065 | 0.9586 | |
| 21 | hsa04110_Cell_cycle | 3 | 128 | 0.1297 | 0.9867 | |
| 22 | hsa04510_Focal_adhesion | 4 | 200 | 0.1321 | 0.9867 | |
| 23 | hsa04144_Endocytosis | 4 | 203 | 0.1373 | 0.9867 | |
| 24 | hsa04910_Insulin_signaling_pathway | 3 | 138 | 0.1522 | 0.9867 | |
| 25 | hsa04976_Bile_secretion | 2 | 71 | 0.1524 | 0.9867 | |
| 26 | hsa04146_Peroxisome | 2 | 79 | 0.18 | 1 | |
| 27 | hsa03013_RNA_transport | 3 | 152 | 0.1855 | 1 | |
| 28 | hsa04970_Salivary_secretion | 2 | 89 | 0.2154 | 1 | |
| 29 | hsa04540_Gap_junction | 2 | 90 | 0.219 | 1 | |
| 30 | hsa04020_Calcium_signaling_pathway | 3 | 177 | 0.2489 | 1 | |
| 31 | hsa04912_GnRH_signaling_pathway | 2 | 101 | 0.2586 | 1 | |
| 32 | hsa04010_MAPK_signaling_pathway | 4 | 268 | 0.2658 | 1 | |
| 33 | hsa04062_Chemokine_signaling_pathway | 3 | 189 | 0.2804 | 1 | |
| 34 | hsa04114_Oocyte_meiosis | 2 | 114 | 0.3055 | 1 | |
| 35 | hsa04650_Natural_killer_cell_mediated_cytotoxicity | 2 | 136 | 0.3833 | 1 | |
| 36 | hsa04120_Ubiquitin_mediated_proteolysis | 2 | 139 | 0.3937 | 1 | |
| 37 | hsa04390_Hippo_signaling_pathway | 2 | 154 | 0.4441 | 1 | |
| 38 | hsa04151_PI3K_AKT_signaling_pathway | 4 | 351 | 0.4477 | 1 | |
| 39 | hsa04145_Phagosome | 2 | 156 | 0.4507 | 1 | |
| 40 | hsa00230_Purine_metabolism | 2 | 162 | 0.4701 | 1 | |
| 41 | hsa04810_Regulation_of_actin_cytoskeleton | 2 | 214 | 0.6198 | 1 | |
| 42 | hsa04014_Ras_signaling_pathway | 2 | 236 | 0.6726 | 1 |