This regulatory network was inferred from the input dataset. The miRNAs and mRNAs are
presented as round and rectangle nodes respectively. The numerical value popped up upon mouse over the gene node is the log2 transformed fold-change of the gene expression between the two groups. All of the nodes are clickable, and the detailed information of the miRNAs/mRNAs and related cancer pathway will be displayed in another window. The edges between nodes are supported by both interactions (predicted or experimentally verified) and correlations learnt from cancer dataset. The numerical value popped up upon mouse over the edge is the correlation beat value (effect size) between the two nodes. The experimental evidences of the edges reported in previous cancer studies are highlighted by red/orange color. All of these information can be accessed by the "mouse-over" action. This network shows a full map of the miRNA-mRNA regulation of the input gene list(s), and the hub miRNAs (with the high network degree/betweenness centrality) would be the potential cancer drivers or tumor suppressors. The full result table can be accessed in the "Regulations" tab.
"miRNACancerMAP" is also a network visualization tool for users to draw their regulatory network by personal customization. Users can set the complexity of the network by limiting the number of nodes or edges. And the color of the nodes can be defined by different categories of the mRNAs and miRNAs, such as Gene-Ontology, pathway, and expression status. Users can also select to use network degree or network betweenness centrality to define the node size. And edges can be black or colored by the correlation. Purple edge means negative correlation (mostly found between miRNA and mRNA), and blue edge means positive correlation (found in PPI or miRNA-miRNA sponge effect). We can also add the protein-protein interactions (PPI) into the network. This result will show the cluster of genes regulated by some specific miRNAs. Additionally, miRNA-miRNA edges can be added by the "miRNA sponge" button, presenting some clusters of miRNAs that have the interactions via sponge effect.
miRNA-gene regulations
| Num | microRNA | Gene | miRNA log2FC | miRNA pvalue | Gene log2FC | Gene pvalue | Interaction | Correlation beta | Correlation P-value | PMID | Reported in cancer studies |
|---|---|---|---|---|---|---|---|---|---|---|---|
| 1 | hsa-let-7b-5p | AIFM1 | -0.19 | 0.65188 | 0.57 | 0.10576 | miRNATAP | -0.16 | 0.0007 | NA | |
| 2 | hsa-miR-106b-5p | AKT3 | 2.81 | 0 | -3.33 | 1.0E-5 | miRNATAP | -0.41 | 1.0E-5 | NA | |
| 3 | hsa-miR-142-3p | AKT3 | 4.35 | 0 | -3.33 | 1.0E-5 | miRanda | -0.16 | 0.00934 | NA | |
| 4 | hsa-miR-15a-5p | AKT3 | 2.05 | 0 | -3.33 | 1.0E-5 | miRNAWalker2 validate; miRTarBase; miRNATAP | -0.37 | 0.00021 | NA | |
| 5 | hsa-miR-15b-5p | AKT3 | 3.32 | 0 | -3.33 | 1.0E-5 | miRNATAP | -0.25 | 0.00571 | NA | |
| 6 | hsa-miR-16-5p | AKT3 | 2.94 | 0 | -3.33 | 1.0E-5 | miRNAWalker2 validate; miRTarBase; miRNATAP | -0.31 | 0.00086 | NA | |
| 7 | hsa-miR-29b-3p | AKT3 | 0.67 | 0.23406 | -3.33 | 1.0E-5 | miRNATAP | -0.28 | 0.00031 | 26512921 | MicroRNA 29B mir 29b regulates the Warburg effect in ovarian cancer by targeting AKT2 and AKT3 |
| 8 | hsa-miR-3065-5p | AKT3 | 2.14 | 0.06094 | -3.33 | 1.0E-5 | mirMAP | -0.22 | 0 | NA | |
| 9 | hsa-miR-362-3p | AKT3 | 0.68 | 0.22615 | -3.33 | 1.0E-5 | miRanda | -0.25 | 0.00124 | NA | |
| 10 | hsa-miR-501-3p | AKT3 | 1.72 | 0.00759 | -3.33 | 1.0E-5 | miRNATAP | -0.18 | 0.00733 | NA | |
| 11 | hsa-miR-93-5p | AKT3 | 2.66 | 0 | -3.33 | 1.0E-5 | miRNATAP | -0.33 | 0.00021 | NA | |
| 12 | hsa-miR-155-5p | APAF1 | 2.81 | 7.0E-5 | 0.35 | 0.33131 | miRNAWalker2 validate | -0.11 | 0.0002 | 22996741; 26877850 | MiR 155 inhibits the sensitivity of lung cancer cells to cisplatin via negative regulation of Apaf 1 expression; The objective of this study is to verify the hypothesis based on the results of bioinformatics analysis that miR-155 modulates cellular apoptosis and DNA damage through the regulation of Apaf-1 and is thus involved in the development and progression of lung cancer; First we measured the expression of miR-155 and the Apaf-1 protein in lung cancer tissues; The results showed that expression of miR-155 was significantly higher in lung cancer tissues than in paracancerous and normal tissues; whereas Apaf-1 expression was lower in the lung cancerous tissues; The results showed that relative to controls the silencing of miR-155 resulted in elevated expression of the Apaf-1 protein whereas Apaf-1 mRNA levels remained unchanged; Both the silencing of miR-155 and the overexpression Apaf-1 greatly increased the sensitivity of A549 cells to cisplatin treatment as evidenced by elevated rates of apoptosis and DNA damage; Furthermore dual-transfection of A549 cells with miR-155 siRNA and Apaf-1 siRNA resulted in the attenuation of apoptosis and DNA damage;Also increase in the transcript level of APAF-1 and CASP-9 after downregulation of miR-21 and miR-155 might indicate that these genes were targeted by aforementioned miRNAs in T47D cells |
| 13 | hsa-miR-23a-3p | APAF1 | 0.93 | 0.01273 | 0.35 | 0.33131 | miRNATAP | -0.25 | 1.0E-5 | 24992592; 24249161 | Luciferase assay was performed to verify a putative target site of miR-23a in the 3'-UTR of apoptosis protease activating factor 1 APAF1 mRNA; The expression levels of miR-23a and APAF1 in CRC cell lines SW480 and SW620 and clinical samples were assessed using reverse transcription-quantitative real-time PCR RT-qPCR and Western blot; Moreover miR-23a up-regulation was coupled with APAF1 down-regulation in CRC tissue samples;We found that the expression of miR-23a was increased and the level of apoptosis-activating factor-1 APAF-1 was decreased in 5-FU-treated colon cancer cells compared to untreated cells; APAF-1 as a target gene of miR-23a was identified and miR-23a antisense-induced increase in the activation of caspase-9 was observed |
| 14 | hsa-miR-23b-3p | APAF1 | -0.58 | 0.19048 | 0.35 | 0.33131 | miRNATAP | -0.16 | 0.00048 | NA | |
| 15 | hsa-miR-27a-3p | APAF1 | 1.76 | 0.00022 | 0.35 | 0.33131 | miRNATAP | -0.18 | 3.0E-5 | NA | |
| 16 | hsa-miR-27b-3p | APAF1 | -0.09 | 0.85847 | 0.35 | 0.33131 | miRNATAP | -0.16 | 6.0E-5 | NA | |
| 17 | hsa-miR-590-3p | APAF1 | 2.35 | 0 | 0.35 | 0.33131 | PITA; miRanda; mirMAP; miRNATAP | -0.12 | 0.0034 | NA | |
| 18 | hsa-miR-708-3p | APAF1 | 0.78 | 0.29065 | 0.35 | 0.33131 | mirMAP | -0.12 | 2.0E-5 | NA | |
| 19 | hsa-miR-203a-3p | ATM | 6.35 | 0 | -0.66 | 0.11688 | MirTarget | -0.11 | 0 | 24145123; 27542403 | miR 203 induces oxaliplatin resistance in colorectal cancer cells by negatively regulating ATM kinase; In silico analysis identified ataxia telangiectasia mutated ATM a primary mediator of the DNA damage response as a potential target of miR-203; Using TCGA database we identified a significant reverse correlation of miR-203 and ATM expression in CRC tissues; We validated ATM as a bona fide target of miR-203 in CRC cells; Mutation of the putative miR-203 binding site in the 3' untranslated region 3'UTR of the ATM mRNA abolished the inhibitory effect of miR-203 on ATM;MiR 203 inhibits tumor invasion and metastasis in gastric cancer by ATM; Our results showed that miR-203 was significantly downregulated in gastric cancer tissues and cells while ataxia telangiectasia mutated kinase ATM was upregulated in gastric cancer tissues and cells and was directly regulated by miR-203; ATM knockdown phenocopied the effect of miR-203 overexpression |
| 20 | hsa-miR-27a-5p | ATM | 1.45 | 0.03942 | -0.66 | 0.11688 | MirTarget | -0.12 | 0.00046 | NA | |
| 21 | hsa-miR-30e-3p | ATM | -0.04 | 0.93258 | -0.66 | 0.11688 | mirMAP | -0.16 | 0.0051 | NA | |
| 22 | hsa-miR-339-5p | ATM | 1.23 | 0.03075 | -0.66 | 0.11688 | miRanda | -0.16 | 0.00017 | NA | |
| 23 | hsa-miR-590-5p | ATM | 1.51 | 0.00239 | -0.66 | 0.11688 | mirMAP | -0.13 | 0.00485 | NA | |
| 24 | hsa-miR-16-2-3p | BCL2 | 3.8 | 0 | -3.06 | 1.0E-5 | mirMAP | -0.2 | 0.00813 | NA | |
| 25 | hsa-miR-16-5p | BCL2 | 2.94 | 0 | -3.06 | 1.0E-5 | miRNAWalker2 validate; miRTarBase | -0.27 | 0.00125 | 21336967; 24447552; 18449891; 25435430; 24598659; 18931683; 22966344; 25623762 | P glycoprotein enhances radiation induced apoptotic cell death through the regulation of miR 16 and Bcl 2 expressions in hepatocellular carcinoma cells; RHepG2 cells the multidrug resistant subline of human hepatocellular carcinoma HepG2 cells expressed higher levels of Pgp as well as miR-16 and lower level of Bcl-2 than the parental cells; On the other hand ectopic mdr1 expression enhanced radiation-induced apoptosis in HepG2 cells SK-HEP-1 cells MiHa cells and furthermore induced miR-16 and suppressed its target gene Bcl-2 in HepG2 cells; Moreover the enhancement effects of Pgp and miR-16 on radiation-induced apoptosis were counteracted by overexpression of Bcl-2;To study the expression of miR-16 and bcl-2 in T lymphoblastic lymphoma/leukemia T-LBL/ALL and its relationship to prognosis; The relationship of miR-16 and bcl-2 was significantP = 0.042χ2 = 4.147; The relationship of miR-16 and bcl-2 might suggested that gene regulation may be influenced by them;miR 15b and miR 16 modulate multidrug resistance by targeting BCL2 in human gastric cancer cells; The downregulation of miR-15b and miR-16 in SGC7901/VCR cells was concurrent with the upregulation of Bcl-2 protein; Taken together our findings suggest that miR-15b and miR-16 could play a role in the development of MDR in gastric cancer cells at least in part by modulation of apoptosis via targeting BCL2;We demonstrated that anti-apoptotic protein Bcl-2 was directly targeted miR-16 in paclitaxel resistant lung cancer cells; Combined overexpression of miR-16 and miR-17 greatly reduced Beclin-1 and Bcl-2 expressions respectively; miR-17 overexpression reduced cytoprotective autophagy by targeting Beclin-1 whereas overexpression of miR-16 potentiated paclitaxel induced apoptotic cell death by inhibiting anti-apoptotic protein Bcl-2;The miR-16 expression correlated with BCL-2 protein r = 0.51 P < 0.05;MicroRNAs miRNAs are noncoding small RNAs that repress protein translation by targeting specific messenger RNAs miR-15a and miR-16-1 act as putative tumor suppressors by targeting the oncogene BCL2;The overall objective of our investigation was to assess whether miRNA-16 miR-16 is involved in the regulation of critical genes such as BCL2 that control the sensitivity of pancreatic cancer cells to apoptosis; This study showed that the ectopic overexpression of miR-16 may be therapeutically beneficial as is evidenced by impaired cell survival with concomitant attenuation of anti-apoptotic protein Bcl-2; Moreover the luciferase reporter assay suggested that miR-16 post-transcriptionally regulates Bcl-2 expression in pancreatic cancer cells through the target sites of the 3' untranslated region of this gene;miR 15a and miR 16 modulate drug resistance by targeting bcl 2 in human colon cancer cells; To investigate the reversal effect of targeted modulation of bcl-2 expression by miR-15a and miR-16 on drug resistance of human colon cancer cells |
| 26 | hsa-miR-192-5p | BCL2 | 1.78 | 0.11349 | -3.06 | 1.0E-5 | miRNAWalker2 validate | -0.13 | 0.00025 | 26550150 | MicroRNA 192 regulates chemo resistance of lung adenocarcinoma for gemcitabine and cisplatin combined therapy by targeting Bcl 2; In this paper we try to test whether miR-192 regulates chemo-resistance in human carcinoma A549 mice model by targeting Bcl-2; MTT assay real-time RT-PCR western blotting assay were used to investigate miR-192 expression levels cell viability ratio and Bcl-2 protein expression levels; Bcl-2 mRNA and protein expression levels up-regulated in miR-192 inhibitor treated tumor; Bcl-2 is a key regulator for miR-192 related chemotherapy resistance; In this study we demonstrate that miR-192 regulates chemoresistance for gemcitabine and cisplatin combined chemotherapy in human adenocarcinoma lung cancer A549 cells and Bcl-2 is the target of miR-192 |
| 27 | hsa-miR-200a-5p | BCL2 | 6.52 | 0 | -3.06 | 1.0E-5 | mirMAP | -0.2 | 0.00037 | NA | |
| 28 | hsa-miR-200b-5p | BCL2 | 6.82 | 0 | -3.06 | 1.0E-5 | mirMAP | -0.2 | 0.00019 | NA | |
| 29 | hsa-miR-200c-3p | BCL2 | 6.47 | 0 | -3.06 | 1.0E-5 | miRNAWalker2 validate; miRTarBase; mirMAP | -0.2 | 0.00073 | NA | |
| 30 | hsa-miR-21-5p | BCL2 | 2.65 | 0 | -3.06 | 1.0E-5 | miRNAWalker2 validate; miRTarBase | -0.48 | 4.0E-5 | 21468550; 25994220; 25381586; 26555418; 23359184; 22964582; 21376256 | BCL-2 up-regulation could be achieved by miR-21 overexpression which prevented T24 cells from apoptosis induced by doxorubicin; Furthermore the miR-21 induced BCL-2 up-regulation could be cancelled by the PI3K inhibitor LY294002;Meanwhile miR-21 loss reduced STAT3 and Bcl-2 activation causing an increase in the apoptosis of tumour cells in CAC mice;Changes in the sensitivity of osteosarcoma cells to CDDP were examined after transfection with miR-21 mimics or anti-miR-21 or bcl-2 siRNA in combination with CDDP;The expression of Bax Bcl-2 and miR-21 in parental and paclitaxel-resistant cells was detected by RT-PCR and Western blotting;Resveratrol induces apoptosis of pancreatic cancers cells by inhibiting miR 21 regulation of BCL 2 expression; We also used Western blot to measure BCL-2 protein levels after down-regulation of miR-21 expression; Besides down-regulation of miR-21 expression can inhibit BCL-2 expression in PANC-1 CFPAC-1 and MIA Paca-2 cells; Over-expression of miR-21 expression can reverse down-regulation of BCL-2 expression and apoptosis induced by resveratrol; In this study we demonstrated that the effect of resveratrol on apoptosis is due to inhibiting miR-21 regulation of BCL-2 expression;Tumors harvested from these lungs have elevated levels of oncogenic miRNAs miR-21 and miR-155; are deficient for p53-regulated miRNAs; and have heightened expression of miR-34 target genes such as Met and Bcl-2;Bcl 2 upregulation induced by miR 21 via a direct interaction is associated with apoptosis and chemoresistance in MIA PaCa 2 pancreatic cancer cells; However the roles and mechanisms of miRNA miR-21 in regulation of Bcl-2 in pancreatic cancer remain to be elucidated; Then luciferase activity was observed after miR-21 mimics and pRL-TK plasmids containing wild-type and mutant 3'UTRs of Bcl-2 mRNA were co-transfected; Cells transfected with miR-21 inhibitor revealed an opposite trend. There was a significant increase in luciferase activity in the cells transfected with the wild-type pRL-TK plasmid in contrast to those transfected with the mutant one indicating that miR-21 promotes Bcl-2 expression by binding directly to the 3'UTR of Bcl-2 mRNA; Upregulation of Bcl-2 directly induced by miR-21 is associated with apoptosis chemoresistance and proliferation of MIA PaCa-2 pancreatic cancer cells |
| 31 | hsa-miR-215-5p | BCL2 | 3.67 | 0.00295 | -3.06 | 1.0E-5 | miRNAWalker2 validate | -0.14 | 1.0E-5 | NA | |
| 32 | hsa-miR-24-2-5p | BCL2 | 2.07 | 6.0E-5 | -3.06 | 1.0E-5 | miRNAWalker2 validate; miRTarBase | -0.36 | 0 | NA | |
| 33 | hsa-miR-3065-5p | BCL2 | 2.14 | 0.06094 | -3.06 | 1.0E-5 | mirMAP | -0.17 | 0.00011 | NA | |
| 34 | hsa-miR-338-5p | BCL2 | -0.11 | 0.89468 | -3.06 | 1.0E-5 | PITA | -0.15 | 0.00173 | NA | |
| 35 | hsa-miR-33b-5p | BCL2 | 4.78 | 0 | -3.06 | 1.0E-5 | miRTarBase; mirMAP | -0.12 | 0.00899 | NA | |
| 36 | hsa-miR-365a-3p | BCL2 | 0.26 | 0.65432 | -3.06 | 1.0E-5 | miRNAWalker2 validate; miRTarBase | -0.39 | 0 | NA | |
| 37 | hsa-miR-429 | BCL2 | 6.4 | 0 | -3.06 | 1.0E-5 | miRNAWalker2 validate; miRTarBase; PITA; mirMAP | -0.16 | 0.00181 | 23999873; 26513239; 26511969 | MiR 429 up regulation induces apoptosis and suppresses invasion by targeting Bcl 2 and SP 1 in esophageal carcinoma; Subsequent Western blotting and luciferase reporter assays showed that miR-429 can bind to putative binding sites within the Bcl-2 and SP1 mRNA 3' untranslated regions UTRs to reduce their expression; Up-regulation of miR-429 inhibits invasion and promotes apoptosis in EC cells by targeting Bcl-2 and SP1; Our findings suggest that Bcl-2 and SP1 may serve as major targets of miR-429;MiR 429 Induces Gastric Carcinoma Cell Apoptosis Through Bcl 2; Here we studied the levels of miR-429 and anti-apoptotic protein Bcl-2 in GC specimens; We performed bioinformatics analyses and used luciferase-reporter assay to analyze the relationship between miR-429 and Bcl-2 in GC cells; MiR-429 levels were significantly decreased and Bcl-2 levels were significantly increased in GC specimens compared to the paired adjacent non-tumor gastric tissue; Moreover the levels of miR-429 and Bcl-2 inversely correlated in GC specimens; Bioinformatics analyses showed that miR-429 targeted the 3'-UTR of Bcl-2 mRNA to inhibit its translation which was confirmed by luciferase-reporter assay;MiR 429 induces apoptosis of glioblastoma cell through Bcl 2; Here we analyzed the levels of miR-429 and anti-apoptotic protein Bcl-2 in GBM specimens; We combined bioinformatics analyses and luciferase reporter assay to determine the relationship between miR-429 and Bcl-2 in GBM cells; We found that miR-429 levels were significantly decreased and Bcl-2 levels were significantly increased in GBM specimens compared to the paired adjacent non-tumor brain tissue; Moreover the levels of miR-429 and Bcl-2 inversely correlated; MiR-429 targeted the 3'-UTR of Bcl-2 mRNA to inhibit its translation |
| 38 | hsa-miR-582-5p | BCL2 | 0.69 | 0.44776 | -3.06 | 1.0E-5 | PITA | -0.13 | 0.00231 | NA | |
| 39 | hsa-miR-629-5p | BCL2 | 1.57 | 0.01157 | -3.06 | 1.0E-5 | mirMAP | -0.25 | 7.0E-5 | NA | |
| 40 | hsa-miR-7-5p | BCL2 | 3.6 | 0.00068 | -3.06 | 1.0E-5 | miRNAWalker2 validate; miRTarBase; mirMAP | -0.12 | 0.00725 | 26464649; 25862909; 21750649 | Western blotting was used to evaluate the effect of miR-7 on Bcl2 in A549 and H460 cells; Moreover subsequent experiments showed that BCL-2 was downregulated by miR-7 at both transcriptional and translational levels; This study further extends the biological role of miR-7 in NSCLC A549 and H460 cells and identifies BCL-2 as a novel target possibly involved in miR-7-mediated growth suppression and apoptosis induction of NSCLC cells;miR-7 overexpression correlated with diminished BCL2 expression but there was no relationship between miR-7 and EGFR expression neither in tumour samples nor in the cell lines; Of the two postulated miR-7 target genes we examined BCL2 but not EGFR seems to be a possible miR-7 target in OC;Bioinformatics predictions revealed a potential binding site of miR-7 on 3'UTR of BCL-2 and it was further confirmed by luciferase assay; Moreover subsequent experiments showed that BCL-2 was downregulated by miR-7 at both transcriptional and translational levels; These results suggest that miR-7 regulates the expression of BCL-2 through direct 3'UTR interactions |
| 41 | hsa-miR-342-3p | BCL2L1 | 1.31 | 0.02072 | 0.39 | 0.37256 | PITA; miRanda; miRNATAP | -0.13 | 0.00344 | NA | |
| 42 | hsa-miR-24-1-5p | BIRC3 | -0.64 | 0.23613 | 0.15 | 0.88569 | MirTarget | -0.36 | 0.00121 | NA | |
| 43 | hsa-miR-491-5p | CAPN1 | 0.57 | 0.31331 | 1.31 | 0.00019 | miRanda | -0.15 | 5.0E-5 | NA | |
| 44 | hsa-miR-1468-5p | CAPN2 | -1.63 | 0.00779 | 0.65 | 0.13872 | MirTarget | -0.2 | 0 | NA | |
| 45 | hsa-miR-20a-3p | CAPN2 | 1.99 | 0.00062 | 0.65 | 0.13872 | MirTarget | -0.14 | 0.00093 | NA | |
| 46 | hsa-miR-421 | CAPN2 | 1.98 | 0.00092 | 0.65 | 0.13872 | miRanda | -0.11 | 0.00888 | NA | |
| 47 | hsa-miR-125b-5p | CASP10 | -2.01 | 0.00516 | 0.7 | 0.33671 | mirMAP | -0.15 | 0.00696 | NA | |
| 48 | hsa-miR-361-5p | CASP10 | 0.01 | 0.9852 | 0.7 | 0.33671 | miRanda | -0.46 | 0.00011 | NA | |
| 49 | hsa-miR-532-5p | CASP10 | -0.3 | 0.50393 | 0.7 | 0.33671 | mirMAP | -0.47 | 0 | NA | |
| 50 | hsa-miR-589-3p | CASP10 | 1.33 | 0.05263 | 0.7 | 0.33671 | mirMAP | -0.23 | 0.00013 | NA | |
| 51 | hsa-miR-592 | CASP10 | 2.8 | 0.02935 | 0.7 | 0.33671 | miRNATAP | -0.1 | 0.0073 | NA | |
| 52 | hsa-miR-744-3p | CASP10 | 1.08 | 0.13124 | 0.7 | 0.33671 | mirMAP | -0.39 | 0 | NA | |
| 53 | hsa-miR-361-5p | CASP7 | 0.01 | 0.9852 | 0.55 | 0.21498 | PITA; miRanda | -0.2 | 0.00762 | NA | |
| 54 | hsa-miR-125a-5p | CFLAR | -1.32 | 0.00714 | 0.11 | 0.78588 | miRanda | -0.13 | 0.0064 | NA | |
| 55 | hsa-miR-130b-3p | CFLAR | 3.92 | 0 | 0.11 | 0.78588 | mirMAP | -0.14 | 0.00031 | NA | |
| 56 | hsa-miR-301a-3p | CFLAR | 1.99 | 0.00081 | 0.11 | 0.78588 | mirMAP | -0.14 | 0.00017 | NA | |
| 57 | hsa-miR-30b-3p | CFLAR | 0.17 | 0.76608 | 0.11 | 0.78588 | mirMAP | -0.16 | 7.0E-5 | NA | |
| 58 | hsa-miR-582-5p | CHP2 | 0.69 | 0.44776 | 1.48 | 0.50956 | miRNATAP | -0.42 | 0.00313 | NA | |
| 59 | hsa-miR-15b-3p | CSF2RB | 3.58 | 0 | -0.53 | 0.5247 | mirMAP | -0.24 | 0.00379 | NA | |
| 60 | hsa-miR-19b-3p | CSF2RB | 1.68 | 0.00086 | -0.53 | 0.5247 | MirTarget | -0.25 | 0.00793 | NA | |
| 61 | hsa-miR-30b-3p | CSF2RB | 0.17 | 0.76608 | -0.53 | 0.5247 | MirTarget | -0.28 | 0.00087 | NA | |
| 62 | hsa-miR-365a-3p | DFFB | 0.26 | 0.65432 | -0.13 | 0.73678 | MirTarget | -0.1 | 0.00471 | NA | |
| 63 | hsa-miR-130b-3p | ENDOD1 | 3.92 | 0 | -1.15 | 0.01857 | MirTarget | -0.12 | 0.00768 | NA | |
| 64 | hsa-miR-181a-5p | ENDOD1 | 1.26 | 0.00749 | -1.15 | 0.01857 | MirTarget | -0.19 | 0.00156 | NA | |
| 65 | hsa-miR-181c-5p | ENDOD1 | -0.3 | 0.53753 | -1.15 | 0.01857 | MirTarget | -0.19 | 0.00075 | NA | |
| 66 | hsa-miR-19a-3p | ENDOD1 | 2.17 | 0.00122 | -1.15 | 0.01857 | mirMAP | -0.12 | 0.00261 | NA | |
| 67 | hsa-miR-19b-3p | ENDOD1 | 1.68 | 0.00086 | -1.15 | 0.01857 | mirMAP | -0.16 | 0.0036 | NA | |
| 68 | hsa-miR-200b-3p | ENDOD1 | 5.56 | 0 | -1.15 | 0.01857 | TargetScan | -0.13 | 0.00092 | NA | |
| 69 | hsa-miR-26b-3p | ENDOD1 | 0.99 | 0.03514 | -1.15 | 0.01857 | mirMAP | -0.15 | 0.00987 | NA | |
| 70 | hsa-miR-301a-3p | ENDOD1 | 1.99 | 0.00081 | -1.15 | 0.01857 | MirTarget | -0.13 | 0.00488 | NA | |
| 71 | hsa-miR-3613-5p | ENDOD1 | 4.05 | 0 | -1.15 | 0.01857 | MirTarget | -0.2 | 4.0E-5 | NA | |
| 72 | hsa-miR-362-3p | ENDOD1 | 0.68 | 0.22615 | -1.15 | 0.01857 | miRanda | -0.18 | 0.00023 | NA | |
| 73 | hsa-miR-454-3p | ENDOD1 | 1.4 | 0.00366 | -1.15 | 0.01857 | MirTarget | -0.23 | 4.0E-5 | NA | |
| 74 | hsa-miR-589-5p | ENDOD1 | 1.56 | 0.00033 | -1.15 | 0.01857 | MirTarget | -0.18 | 0.0056 | NA | |
| 75 | hsa-miR-590-3p | ENDOD1 | 2.35 | 0 | -1.15 | 0.01857 | miRanda | -0.22 | 7.0E-5 | NA | |
| 76 | hsa-miR-24-3p | EXOG | 1.56 | 0.00052 | -0.06 | 0.85895 | MirTarget | -0.14 | 0.00075 | NA | |
| 77 | hsa-miR-106a-5p | FAS | 3.99 | 0 | -0.34 | 0.58934 | miRNAWalker2 validate; miRTarBase | -0.14 | 0.00128 | 22431000; 27142596 | miR 106a is frequently upregulated in gastric cancer and inhibits the extrinsic apoptotic pathway by targeting FAS; Bioinformatic analysis combining with validation experiments identified FAS as a direct target of miR-106a; Moreover a significant inverse correlation was found between miR-106a and FAS expression not only in gastric cancer cell lines but also in gastric cancer specimens; Taken together these findings suggest that ectopicly overexpressed miR-106a may play an oncogenic role in gastric carcinogenesis and impair extrinsic apoptotic pathway through targeting FAS;Functional experiment ascertained that miR-106a interacted with FAS and mediated caspase3 pathway |
| 78 | hsa-miR-361-5p | FAS | 0.01 | 0.9852 | -0.34 | 0.58934 | miRanda | -0.33 | 0.00172 | NA | |
| 79 | hsa-miR-590-5p | FAS | 1.51 | 0.00239 | -0.34 | 0.58934 | miRanda | -0.2 | 0.00636 | NA | |
| 80 | hsa-miR-199a-5p | FASLG | -1.25 | 0.07478 | 1.93 | 0.09085 | miRanda | -0.4 | 1.0E-5 | NA | |
| 81 | hsa-miR-28-5p | FASLG | -0.82 | 0.02212 | 1.93 | 0.09085 | miRanda | -0.58 | 0.00171 | NA | |
| 82 | hsa-miR-324-5p | FASLG | 1.31 | 0.01168 | 1.93 | 0.09085 | miRanda | -0.33 | 0.00773 | NA | |
| 83 | hsa-miR-92b-3p | FASLG | 1.69 | 0.01035 | 1.93 | 0.09085 | miRNATAP | -0.25 | 0.00986 | NA | |
| 84 | hsa-miR-151a-3p | IKBKB | 0.37 | 0.37692 | 0.1 | 0.71885 | miRNAWalker2 validate | -0.12 | 0.00181 | NA | |
| 85 | hsa-miR-339-5p | IKBKB | 1.23 | 0.03075 | 0.1 | 0.71885 | miRanda | -0.11 | 7.0E-5 | NA | |
| 86 | hsa-miR-542-3p | IKBKB | -0.38 | 0.438 | 0.1 | 0.71885 | miRanda | -0.11 | 0.00095 | NA | |
| 87 | hsa-miR-125a-5p | IKBKG | -1.32 | 0.00714 | 0.22 | 0.54129 | miRanda | -0.11 | 0.00712 | NA | |
| 88 | hsa-miR-338-5p | IKBKG | -0.11 | 0.89468 | 0.22 | 0.54129 | mirMAP | -0.11 | 1.0E-5 | NA | |
| 89 | hsa-miR-181c-5p | IL1A | -0.3 | 0.53753 | 4.32 | 0.01044 | MirTarget | -0.75 | 0.00013 | NA | |
| 90 | hsa-miR-191-5p | IL1A | 1.59 | 0.00074 | 4.32 | 0.01044 | miRNAWalker2 validate | -0.92 | 1.0E-5 | NA | |
| 91 | hsa-miR-200a-3p | IL1A | 6.34 | 0 | 4.32 | 0.01044 | MirTarget | -0.46 | 7.0E-5 | NA | |
| 92 | hsa-miR-30a-5p | IL1A | -0.77 | 0.32049 | 4.32 | 0.01044 | MirTarget | -0.52 | 2.0E-5 | NA | |
| 93 | hsa-miR-532-5p | IL1A | -0.3 | 0.50393 | 4.32 | 0.01044 | MirTarget | -1.5 | 0 | NA | |
| 94 | hsa-miR-17-3p | IL1R1 | 1.25 | 0.00187 | -2.03 | 0.00137 | mirMAP | -0.48 | 0 | NA | |
| 95 | hsa-miR-335-3p | IL1R1 | 1.2 | 0.09389 | -2.03 | 0.00137 | mirMAP | -0.22 | 1.0E-5 | NA | |
| 96 | hsa-miR-106a-5p | IL1RAP | 3.99 | 0 | 1.81 | 0.02672 | MirTarget | -0.22 | 9.0E-5 | NA | |
| 97 | hsa-miR-107 | IL1RAP | 1.49 | 0.00013 | 1.81 | 0.02672 | miRanda | -0.36 | 0.00233 | NA | |
| 98 | hsa-miR-186-5p | IL1RAP | 0.45 | 0.18545 | 1.81 | 0.02672 | mirMAP | -0.72 | 0 | NA | |
| 99 | hsa-miR-192-5p | IL1RAP | 1.78 | 0.11349 | 1.81 | 0.02672 | miRNAWalker2 validate | -0.25 | 0 | NA | |
| 100 | hsa-miR-20b-5p | IL1RAP | 4.57 | 5.0E-5 | 1.81 | 0.02672 | MirTarget | -0.18 | 1.0E-5 | NA | |
| 101 | hsa-miR-215-5p | IL1RAP | 3.67 | 0.00295 | 1.81 | 0.02672 | miRNAWalker2 validate | -0.15 | 3.0E-5 | NA | |
| 102 | hsa-miR-301a-3p | IL1RAP | 1.99 | 0.00081 | 1.81 | 0.02672 | MirTarget | -0.24 | 0.00222 | NA | |
| 103 | hsa-miR-361-5p | IL1RAP | 0.01 | 0.9852 | 1.81 | 0.02672 | miRanda | -0.5 | 0.00019 | NA | |
| 104 | hsa-miR-362-3p | IL1RAP | 0.68 | 0.22615 | 1.81 | 0.02672 | miRanda | -0.27 | 0.00125 | NA | |
| 105 | hsa-miR-375 | IL1RAP | 3.38 | 0.04499 | 1.81 | 0.02672 | miRNAWalker2 validate; miRanda | -0.2 | 0 | NA | |
| 106 | hsa-miR-7-1-3p | IL1RAP | 1.43 | 0.00471 | 1.81 | 0.02672 | MirTarget | -0.26 | 0.00427 | NA | |
| 107 | hsa-miR-93-5p | IL1RAP | 2.66 | 0 | 1.81 | 0.02672 | MirTarget | -0.26 | 0.00654 | NA | |
| 108 | hsa-miR-335-5p | IRAK2 | 0.17 | 0.8039 | 0.54 | 0.48745 | miRNAWalker2 validate | -0.23 | 0.00038 | NA | |
| 109 | hsa-miR-20a-3p | IRAK3 | 1.99 | 0.00062 | -1.59 | 0.06089 | mirMAP | -0.26 | 0.00147 | NA | |
| 110 | hsa-miR-3200-3p | IRAK3 | 2.33 | 0.01403 | -1.59 | 0.06089 | mirMAP | -0.15 | 0.00256 | NA | |
| 111 | hsa-miR-361-5p | IRAK3 | 0.01 | 0.9852 | -1.59 | 0.06089 | miRanda; mirMAP | -0.37 | 0.00952 | NA | |
| 112 | hsa-miR-421 | IRAK3 | 1.98 | 0.00092 | -1.59 | 0.06089 | miRanda; mirMAP | -0.24 | 0.00258 | NA | |
| 113 | hsa-miR-429 | IRAK3 | 6.4 | 0 | -1.59 | 0.06089 | miRanda | -0.18 | 0.00435 | NA | |
| 114 | hsa-miR-501-5p | IRAK3 | 1.04 | 0.07772 | -1.59 | 0.06089 | mirMAP | -0.32 | 7.0E-5 | NA | |
| 115 | hsa-miR-660-5p | IRAK3 | -0.07 | 0.88525 | -1.59 | 0.06089 | mirMAP | -0.33 | 0.0016 | NA | |
| 116 | hsa-miR-9-3p | IRAK3 | 1.69 | 0.12517 | -1.59 | 0.06089 | mirMAP | -0.16 | 0.00036 | NA | |
| 117 | hsa-miR-92a-3p | IRAK3 | 1.88 | 1.0E-5 | -1.59 | 0.06089 | mirMAP | -0.32 | 0.00448 | NA | |
| 118 | hsa-miR-193a-3p | IRAK4 | 0.65 | 0.20713 | 0.28 | 0.30697 | miRanda | -0.1 | 0.00057 | NA | |
| 119 | hsa-miR-17-5p | MAP3K14 | 2.33 | 2.0E-5 | -0.57 | 0.23205 | MirTarget | -0.15 | 0.00157 | NA | |
| 120 | hsa-miR-345-5p | MAP3K14 | 2.77 | 4.0E-5 | -0.57 | 0.23205 | MirTarget | -0.1 | 0.00878 | NA | |
| 121 | hsa-miR-429 | MAP3K14 | 6.4 | 0 | -0.57 | 0.23205 | miRNATAP | -0.12 | 0.00078 | NA | |
| 122 | hsa-miR-93-5p | MAP3K14 | 2.66 | 0 | -0.57 | 0.23205 | MirTarget | -0.23 | 4.0E-5 | NA | |
| 123 | hsa-let-7g-5p | NGF | 0.86 | 0.00648 | -4.95 | 9.0E-5 | MirTarget | -0.75 | 0.00129 | NA | |
| 124 | hsa-miR-429 | NGF | 6.4 | 0 | -4.95 | 9.0E-5 | miRanda | -0.37 | 7.0E-5 | NA | |
| 125 | hsa-miR-148b-3p | PIK3CA | 1.76 | 0 | 0.51 | 0.24893 | miRNAWalker2 validate | -0.24 | 0.00148 | NA | |
| 126 | hsa-miR-186-5p | PIK3CA | 0.45 | 0.18545 | 0.51 | 0.24893 | mirMAP | -0.28 | 0.00023 | NA | |
| 127 | hsa-miR-29b-1-5p | PIK3CA | 0.34 | 0.59809 | 0.51 | 0.24893 | mirMAP | -0.12 | 0.00234 | NA | |
| 128 | hsa-miR-320b | PIK3CA | 0.2 | 0.72722 | 0.51 | 0.24893 | miRanda | -0.12 | 0.00551 | NA | |
| 129 | hsa-miR-335-5p | PIK3CA | 0.17 | 0.8039 | 0.51 | 0.24893 | miRNAWalker2 validate | -0.12 | 0.00088 | NA | |
| 130 | hsa-miR-338-5p | PIK3CA | -0.11 | 0.89468 | 0.51 | 0.24893 | mirMAP | -0.11 | 0.00047 | NA | |
| 131 | hsa-miR-339-5p | PIK3CA | 1.23 | 0.03075 | 0.51 | 0.24893 | miRanda | -0.14 | 0.00178 | NA | |
| 132 | hsa-miR-501-5p | PIK3CA | 1.04 | 0.07772 | 0.51 | 0.24893 | mirMAP | -0.12 | 0.00474 | NA | |
| 133 | hsa-miR-130a-3p | PIK3CB | 0.18 | 0.75775 | 0.9 | 0.01258 | miRNATAP | -0.12 | 0.00106 | NA | |
| 134 | hsa-miR-19b-3p | PIK3CB | 1.68 | 0.00086 | 0.9 | 0.01258 | miRNATAP | -0.11 | 0.00639 | NA | |
| 135 | hsa-miR-1468-5p | PIK3CD | -1.63 | 0.00779 | 0.06 | 0.92656 | MirTarget | -0.15 | 0.0056 | NA | |
| 136 | hsa-miR-199a-5p | PIK3CD | -1.25 | 0.07478 | 0.06 | 0.92656 | MirTarget; PITA; miRanda; miRNATAP | -0.16 | 0.00086 | NA | |
| 137 | hsa-miR-30d-5p | PIK3CD | 0.3 | 0.38019 | 0.06 | 0.92656 | MirTarget; miRNATAP | -0.27 | 0.00723 | NA | |
| 138 | hsa-miR-3913-5p | PIK3CD | 0.15 | 0.73484 | 0.06 | 0.92656 | mirMAP | -0.26 | 0.00117 | NA | |
| 139 | hsa-miR-335-3p | PIK3CG | 1.2 | 0.09389 | -0.16 | 0.84867 | mirMAP | -0.29 | 1.0E-5 | NA | |
| 140 | hsa-miR-16-2-3p | PIK3R1 | 3.8 | 0 | -1.85 | 0.01274 | MirTarget | -0.22 | 0.0055 | NA | |
| 141 | hsa-miR-16-5p | PIK3R1 | 2.94 | 0 | -1.85 | 0.01274 | MirTarget | -0.23 | 0.00941 | NA | |
| 142 | hsa-miR-17-5p | PIK3R1 | 2.33 | 2.0E-5 | -1.85 | 0.01274 | MirTarget; TargetScan; miRNATAP | -0.26 | 0.00056 | NA | |
| 143 | hsa-miR-200c-3p | PIK3R1 | 6.47 | 0 | -1.85 | 0.01274 | mirMAP | -0.21 | 0.00097 | NA | |
| 144 | hsa-miR-29b-3p | PIK3R1 | 0.67 | 0.23406 | -1.85 | 0.01274 | MirTarget; miRNATAP | -0.23 | 0.00248 | NA | |
| 145 | hsa-miR-3065-5p | PIK3R1 | 2.14 | 0.06094 | -1.85 | 0.01274 | MirTarget; mirMAP; miRNATAP | -0.14 | 0.003 | NA | |
| 146 | hsa-miR-320c | PIK3R1 | -0.11 | 0.854 | -1.85 | 0.01274 | miRNATAP | -0.24 | 0.00153 | NA | |
| 147 | hsa-miR-330-3p | PIK3R1 | 2.49 | 0.00013 | -1.85 | 0.01274 | MirTarget; PITA; miRNATAP | -0.22 | 0.00056 | NA | |
| 148 | hsa-miR-335-3p | PIK3R1 | 1.2 | 0.09389 | -1.85 | 0.01274 | mirMAP | -0.19 | 0.00155 | NA | |
| 149 | hsa-miR-338-5p | PIK3R1 | -0.11 | 0.89468 | -1.85 | 0.01274 | PITA | -0.15 | 0.00415 | NA | |
| 150 | hsa-miR-582-5p | PIK3R1 | 0.69 | 0.44776 | -1.85 | 0.01274 | mirMAP | -0.17 | 0.00029 | NA |
| Num | GO | Overlap | Size | P Value | Adj. P Value |
|---|---|---|---|---|---|
| 1 | POSITIVE REGULATION OF RESPONSE TO STIMULUS | 33 | 1929 | 1.687e-22 | 7.848e-19 |
| 2 | EXTRINSIC APOPTOTIC SIGNALING PATHWAY VIA DEATH DOMAIN RECEPTORS | 11 | 39 | 9.089e-21 | 2.115e-17 |
| 3 | CELLULAR RESPONSE TO ORGANIC SUBSTANCE | 31 | 1848 | 1.506e-20 | 2.335e-17 |
| 4 | POSITIVE REGULATION OF INTRACELLULAR SIGNAL TRANSDUCTION | 24 | 876 | 4.076e-20 | 4.742e-17 |
| 5 | EXTRINSIC APOPTOTIC SIGNALING PATHWAY | 13 | 99 | 1.073e-19 | 9.987e-17 |
| 6 | REGULATION OF INTRACELLULAR SIGNAL TRANSDUCTION | 29 | 1656 | 1.836e-19 | 1.068e-16 |
| 7 | APOPTOTIC SIGNALING PATHWAY | 17 | 289 | 1.398e-19 | 1.068e-16 |
| 8 | POSITIVE REGULATION OF PROTEIN METABOLIC PROCESS | 28 | 1492 | 1.806e-19 | 1.068e-16 |
| 9 | INTRACELLULAR SIGNAL TRANSDUCTION | 28 | 1572 | 7.236e-19 | 3.741e-16 |
| 10 | CELL DEATH | 24 | 1001 | 8.909e-19 | 4.145e-16 |
| 11 | POSITIVE REGULATION OF CELL COMMUNICATION | 27 | 1532 | 5.725e-18 | 2.422e-15 |
| 12 | POSITIVE REGULATION OF I KAPPAB KINASE NF KAPPAB SIGNALING | 14 | 179 | 6.498e-18 | 2.52e-15 |
| 13 | POSITIVE REGULATION OF MOLECULAR FUNCTION | 28 | 1791 | 2.258e-17 | 8.081e-15 |
| 14 | REGULATION OF I KAPPAB KINASE NF KAPPAB SIGNALING | 14 | 233 | 2.696e-16 | 8.961e-14 |
| 15 | IMMUNE SYSTEM PROCESS | 28 | 1984 | 3.265e-16 | 1.013e-13 |
| 16 | REGULATION OF CELL DEATH | 25 | 1472 | 4.348e-16 | 1.264e-13 |
| 17 | POSITIVE REGULATION OF CATALYTIC ACTIVITY | 25 | 1518 | 8.919e-16 | 2.441e-13 |
| 18 | POSITIVE REGULATION OF PROTEIN MODIFICATION PROCESS | 22 | 1135 | 3.615e-15 | 9.344e-13 |
| 19 | CYTOKINE MEDIATED SIGNALING PATHWAY | 16 | 452 | 6.016e-15 | 1.473e-12 |
| 20 | RESPONSE TO OXYGEN CONTAINING COMPOUND | 23 | 1381 | 1.708e-14 | 3.973e-12 |
| 21 | ACTIVATION OF CYSTEINE TYPE ENDOPEPTIDASE ACTIVITY | 10 | 95 | 2.536e-14 | 5.619e-12 |
| 22 | RESPONSE TO CYTOKINE | 18 | 714 | 2.943e-14 | 6.225e-12 |
| 23 | NEGATIVE REGULATION OF EXTRINSIC APOPTOTIC SIGNALING PATHWAY | 10 | 98 | 3.496e-14 | 7.072e-12 |
| 24 | REGULATION OF PHOSPHORUS METABOLIC PROCESS | 24 | 1618 | 4.558e-14 | 8.837e-12 |
| 25 | NEGATIVE REGULATION OF CELL DEATH | 19 | 872 | 6.377e-14 | 1.187e-11 |
| 26 | POSITIVE REGULATION OF PHOSPHATE METABOLIC PROCESS | 20 | 1036 | 1.09e-13 | 1.811e-11 |
| 27 | POSITIVE REGULATION OF PHOSPHORUS METABOLIC PROCESS | 20 | 1036 | 1.09e-13 | 1.811e-11 |
| 28 | REGULATION OF CYSTEINE TYPE ENDOPEPTIDASE ACTIVITY | 12 | 213 | 1.018e-13 | 1.811e-11 |
| 29 | ZYMOGEN ACTIVATION | 10 | 112 | 1.378e-13 | 2.211e-11 |
| 30 | REGULATION OF PROTEIN MODIFICATION PROCESS | 24 | 1710 | 1.539e-13 | 2.387e-11 |
| 31 | CELLULAR RESPONSE TO CYTOKINE STIMULUS | 16 | 606 | 5.498e-13 | 8.253e-11 |
| 32 | PROTEIN MATURATION | 12 | 265 | 1.363e-12 | 1.982e-10 |
| 33 | REGULATION OF KINASE ACTIVITY | 17 | 776 | 1.747e-12 | 2.463e-10 |
| 34 | ACTIVATION OF PROTEIN KINASE ACTIVITY | 12 | 279 | 2.5e-12 | 3.421e-10 |
| 35 | REGULATION OF EXTRINSIC APOPTOTIC SIGNALING PATHWAY | 10 | 153 | 3.246e-12 | 4.316e-10 |
| 36 | REGULATION OF TRANSFERASE ACTIVITY | 18 | 946 | 3.451e-12 | 4.358e-10 |
| 37 | POSITIVE REGULATION OF PEPTIDASE ACTIVITY | 10 | 154 | 3.466e-12 | 4.358e-10 |
| 38 | POSITIVE REGULATION OF KINASE ACTIVITY | 14 | 482 | 5.772e-12 | 7.068e-10 |
| 39 | I KAPPAB KINASE NF KAPPAB SIGNALING | 8 | 70 | 5.996e-12 | 7.154e-10 |
| 40 | RESPONSE TO NITROGEN COMPOUND | 17 | 859 | 8.778e-12 | 1.021e-09 |
| 41 | TUMOR NECROSIS FACTOR MEDIATED SIGNALING PATHWAY | 9 | 118 | 1.071e-11 | 1.216e-09 |
| 42 | PHOSPHATIDYLINOSITOL 3 PHOSPHATE BIOSYNTHETIC PROCESS | 7 | 49 | 2.692e-11 | 2.913e-09 |
| 43 | PHOSPHORYLATION | 19 | 1228 | 2.651e-11 | 2.913e-09 |
| 44 | CELLULAR RESPONSE TO OXYGEN CONTAINING COMPOUND | 16 | 799 | 3.535e-11 | 3.738e-09 |
| 45 | PROTEIN PHOSPHORYLATION | 17 | 944 | 3.875e-11 | 4.007e-09 |
| 46 | NEGATIVE REGULATION OF APOPTOTIC SIGNALING PATHWAY | 10 | 200 | 4.672e-11 | 4.726e-09 |
| 47 | REGULATION OF PROTEIN SERINE THREONINE KINASE ACTIVITY | 13 | 470 | 6.871e-11 | 6.802e-09 |
| 48 | ACTIVATION OF CYSTEINE TYPE ENDOPEPTIDASE ACTIVITY INVOLVED IN APOPTOTIC SIGNALING PATHWAY | 5 | 13 | 9.073e-11 | 8.796e-09 |
| 49 | INTRINSIC APOPTOTIC SIGNALING PATHWAY | 9 | 152 | 1.056e-10 | 1.003e-08 |
| 50 | POSITIVE REGULATION OF CELL DEATH | 14 | 605 | 1.178e-10 | 1.096e-08 |
| 51 | REGULATION OF PEPTIDASE ACTIVITY | 12 | 392 | 1.305e-10 | 1.19e-08 |
| 52 | POSITIVE REGULATION OF TRANSFERASE ACTIVITY | 14 | 616 | 1.492e-10 | 1.335e-08 |
| 53 | CELLULAR RESPONSE TO NITROGEN COMPOUND | 13 | 505 | 1.666e-10 | 1.463e-08 |
| 54 | NEGATIVE REGULATION OF EXTRINSIC APOPTOTIC SIGNALING PATHWAY VIA DEATH DOMAIN RECEPTORS | 6 | 34 | 2.011e-10 | 1.733e-08 |
| 55 | NEURON APOPTOTIC PROCESS | 6 | 35 | 2.422e-10 | 2.049e-08 |
| 56 | REGULATION OF IMMUNE SYSTEM PROCESS | 19 | 1403 | 2.603e-10 | 2.163e-08 |
| 57 | ACTIVATION OF IMMUNE RESPONSE | 12 | 427 | 3.475e-10 | 2.837e-08 |
| 58 | IMMUNE RESPONSE | 17 | 1100 | 4.162e-10 | 3.339e-08 |
| 59 | POSITIVE REGULATION OF CYSTEINE TYPE ENDOPEPTIDASE ACTIVITY INVOLVED IN APOPTOTIC SIGNALING PATHWAY | 5 | 17 | 4.331e-10 | 3.415e-08 |
| 60 | PHOSPHATIDYLINOSITOL BIOSYNTHETIC PROCESS | 8 | 120 | 4.871e-10 | 3.777e-08 |
| 61 | POSITIVE REGULATION OF IMMUNE RESPONSE | 13 | 563 | 6.303e-10 | 4.808e-08 |
| 62 | INFLAMMATORY RESPONSE | 12 | 454 | 6.985e-10 | 5.242e-08 |
| 63 | REGULATION OF PROTEOLYSIS | 14 | 711 | 9.665e-10 | 7.027e-08 |
| 64 | REGULATION OF APOPTOTIC SIGNALING PATHWAY | 11 | 363 | 9.519e-10 | 7.027e-08 |
| 65 | REGULATION OF IMMUNE RESPONSE | 15 | 858 | 1.093e-09 | 7.823e-08 |
| 66 | NEURON DEATH | 6 | 47 | 1.567e-09 | 1.105e-07 |
| 67 | PHOSPHATE CONTAINING COMPOUND METABOLIC PROCESS | 21 | 1977 | 1.796e-09 | 1.248e-07 |
| 68 | REGULATION OF CYSTEINE TYPE ENDOPEPTIDASE ACTIVITY INVOLVED IN APOPTOTIC SIGNALING PATHWAY | 5 | 22 | 1.826e-09 | 1.25e-07 |
| 69 | REGULATION OF RESPONSE TO CYTOKINE STIMULUS | 8 | 144 | 2.087e-09 | 1.407e-07 |
| 70 | REGULATION OF TUMOR NECROSIS FACTOR MEDIATED SIGNALING PATHWAY | 6 | 50 | 2.307e-09 | 1.533e-07 |
| 71 | RESPONSE TO ENDOGENOUS STIMULUS | 18 | 1450 | 3.648e-09 | 2.368e-07 |
| 72 | PHOSPHATIDYLINOSITOL 3 KINASE SIGNALING | 5 | 25 | 3.664e-09 | 2.368e-07 |
| 73 | REGULATION OF EXTRINSIC APOPTOTIC SIGNALING PATHWAY VIA DEATH DOMAIN RECEPTORS | 6 | 55 | 4.169e-09 | 2.658e-07 |
| 74 | REGULATION OF RESPONSE TO STRESS | 18 | 1468 | 4.434e-09 | 2.788e-07 |
| 75 | RESPONSE TO TUMOR NECROSIS FACTOR | 9 | 233 | 4.641e-09 | 2.879e-07 |
| 76 | RESPONSE TO WOUNDING | 12 | 563 | 7.864e-09 | 4.815e-07 |
| 77 | HOMEOSTATIC PROCESS | 17 | 1337 | 8.043e-09 | 4.837e-07 |
| 78 | POSITIVE REGULATION OF APOPTOTIC SIGNALING PATHWAY | 8 | 171 | 8.108e-09 | 4.837e-07 |
| 79 | REGULATION OF NEURON DEATH | 9 | 252 | 9.188e-09 | 5.412e-07 |
| 80 | POSITIVE REGULATION OF IMMUNE SYSTEM PROCESS | 14 | 867 | 1.222e-08 | 7.109e-07 |
| 81 | CHEMICAL HOMEOSTASIS | 14 | 874 | 1.353e-08 | 7.772e-07 |
| 82 | WOUND HEALING | 11 | 470 | 1.399e-08 | 7.938e-07 |
| 83 | POSITIVE REGULATION OF PROTEOLYSIS | 10 | 363 | 1.502e-08 | 8.418e-07 |
| 84 | POSITIVE REGULATION OF DEFENSE RESPONSE | 10 | 364 | 1.541e-08 | 8.538e-07 |
| 85 | INTRINSIC APOPTOTIC SIGNALING PATHWAY IN RESPONSE TO DNA DAMAGE | 6 | 71 | 2e-08 | 1.095e-06 |
| 86 | INOSITOL LIPID MEDIATED SIGNALING | 7 | 124 | 2.055e-08 | 1.112e-06 |
| 87 | PHOSPHATIDYLINOSITOL METABOLIC PROCESS | 8 | 193 | 2.091e-08 | 1.118e-06 |
| 88 | INTERLEUKIN 1 MEDIATED SIGNALING PATHWAY | 4 | 13 | 2.236e-08 | 1.183e-06 |
| 89 | POSITIVE REGULATION OF NF KAPPAB TRANSCRIPTION FACTOR ACTIVITY | 7 | 132 | 3.17e-08 | 1.657e-06 |
| 90 | GLYCEROLIPID BIOSYNTHETIC PROCESS | 8 | 211 | 4.181e-08 | 2.161e-06 |
| 91 | REGULATION OF CELL PROLIFERATION | 17 | 1496 | 4.254e-08 | 2.175e-06 |
| 92 | HEMOSTASIS | 9 | 311 | 5.636e-08 | 2.85e-06 |
| 93 | TOLL LIKE RECEPTOR SIGNALING PATHWAY | 6 | 85 | 5.951e-08 | 2.978e-06 |
| 94 | REGULATION OF MAP KINASE ACTIVITY | 9 | 319 | 7.002e-08 | 3.466e-06 |
| 95 | RESPONSE TO MOLECULE OF BACTERIAL ORIGIN | 9 | 321 | 7.385e-08 | 3.582e-06 |
| 96 | ACTIVATION OF PROTEIN KINASE A ACTIVITY | 4 | 17 | 7.391e-08 | 3.582e-06 |
| 97 | POSITIVE REGULATION OF SEQUENCE SPECIFIC DNA BINDING TRANSCRIPTION FACTOR ACTIVITY | 8 | 228 | 7.609e-08 | 3.65e-06 |
| 98 | IMMUNE RESPONSE REGULATING CELL SURFACE RECEPTOR SIGNALING PATHWAY | 9 | 323 | 7.787e-08 | 3.697e-06 |
| 99 | CELLULAR RESPONSE TO ENDOGENOUS STIMULUS | 14 | 1008 | 8.052e-08 | 3.785e-06 |
| 100 | CELLULAR RESPONSE TO STRESS | 17 | 1565 | 8.222e-08 | 3.826e-06 |
| 101 | REGULATION OF EXTRINSIC APOPTOTIC SIGNALING PATHWAY IN ABSENCE OF LIGAND | 5 | 46 | 9.096e-08 | 4.191e-06 |
| 102 | PHOSPHOLIPID BIOSYNTHETIC PROCESS | 8 | 235 | 9.604e-08 | 4.381e-06 |
| 103 | RESPONSE TO ABIOTIC STIMULUS | 14 | 1024 | 9.783e-08 | 4.419e-06 |
| 104 | RESPONSE TO EXTERNAL STIMULUS | 18 | 1821 | 1.253e-07 | 5.605e-06 |
| 105 | RESPONSE TO BIOTIC STIMULUS | 13 | 886 | 1.382e-07 | 6.126e-06 |
| 106 | LIPID PHOSPHORYLATION | 6 | 99 | 1.486e-07 | 6.523e-06 |
| 107 | POSITIVE REGULATION OF MAPK CASCADE | 10 | 470 | 1.688e-07 | 7.341e-06 |
| 108 | RENAL SYSTEM PROCESS | 6 | 102 | 1.776e-07 | 7.651e-06 |
| 109 | REGULATION OF DEFENSE RESPONSE | 12 | 759 | 2.074e-07 | 8.853e-06 |
| 110 | PATTERN RECOGNITION RECEPTOR SIGNALING PATHWAY | 6 | 109 | 2.636e-07 | 1.115e-05 |
| 111 | REGULATION OF HYDROLASE ACTIVITY | 15 | 1327 | 3.619e-07 | 1.517e-05 |
| 112 | REGULATION OF NEURON APOPTOTIC PROCESS | 7 | 192 | 4.114e-07 | 1.709e-05 |
| 113 | REGULATION OF MAPK CASCADE | 11 | 660 | 4.325e-07 | 1.781e-05 |
| 114 | ANTIGEN RECEPTOR MEDIATED SIGNALING PATHWAY | 7 | 195 | 4.568e-07 | 1.865e-05 |
| 115 | GLYCEROPHOSPHOLIPID METABOLIC PROCESS | 8 | 297 | 5.722e-07 | 2.315e-05 |
| 116 | ACTIVATION OF INNATE IMMUNE RESPONSE | 7 | 204 | 6.192e-07 | 2.481e-05 |
| 117 | NEGATIVE REGULATION OF CELL COMMUNICATION | 14 | 1192 | 6.238e-07 | 2.481e-05 |
| 118 | PROTEOLYSIS | 14 | 1208 | 7.322e-07 | 2.887e-05 |
| 119 | DEFENSE RESPONSE | 14 | 1231 | 9.179e-07 | 3.589e-05 |
| 120 | CELL ACTIVATION | 10 | 568 | 9.561e-07 | 3.707e-05 |
| 121 | NEGATIVE REGULATION OF EXTRINSIC APOPTOTIC SIGNALING PATHWAY IN ABSENCE OF LIGAND | 4 | 32 | 1.087e-06 | 4.079e-05 |
| 122 | CELLULAR GLUCOSE HOMEOSTASIS | 5 | 75 | 1.086e-06 | 4.079e-05 |
| 123 | INTRINSIC APOPTOTIC SIGNALING PATHWAY IN RESPONSE TO ENDOPLASMIC RETICULUM STRESS | 4 | 32 | 1.087e-06 | 4.079e-05 |
| 124 | NEGATIVE REGULATION OF SIGNAL TRANSDUCTION IN ABSENCE OF LIGAND | 4 | 32 | 1.087e-06 | 4.079e-05 |
| 125 | SIGNAL TRANSDUCTION IN ABSENCE OF LIGAND | 4 | 33 | 1.235e-06 | 4.559e-05 |
| 126 | EXTRINSIC APOPTOTIC SIGNALING PATHWAY IN ABSENCE OF LIGAND | 4 | 33 | 1.235e-06 | 4.559e-05 |
| 127 | FC EPSILON RECEPTOR SIGNALING PATHWAY | 6 | 142 | 1.253e-06 | 4.591e-05 |
| 128 | POSITIVE REGULATION OF HYDROLASE ACTIVITY | 12 | 905 | 1.343e-06 | 4.883e-05 |
| 129 | RENAL WATER HOMEOSTASIS | 4 | 34 | 1.397e-06 | 5.038e-05 |
| 130 | T CELL RECEPTOR SIGNALING PATHWAY | 6 | 146 | 1.474e-06 | 5.276e-05 |
| 131 | POSITIVE REGULATION OF INNATE IMMUNE RESPONSE | 7 | 246 | 2.163e-06 | 7.683e-05 |
| 132 | GLYCEROLIPID METABOLIC PROCESS | 8 | 356 | 2.223e-06 | 7.777e-05 |
| 133 | CELLULAR RESPONSE TO GLUCAGON STIMULUS | 4 | 38 | 2.207e-06 | 7.777e-05 |
| 134 | REGULATION OF INNATE IMMUNE RESPONSE | 8 | 357 | 2.27e-06 | 7.882e-05 |
| 135 | CELLULAR RESPONSE TO INTERLEUKIN 1 | 5 | 88 | 2.407e-06 | 8.296e-05 |
| 136 | PHOSPHOLIPID METABOLIC PROCESS | 8 | 364 | 2.621e-06 | 8.969e-05 |
| 137 | REGULATION OF SEQUENCE SPECIFIC DNA BINDING TRANSCRIPTION FACTOR ACTIVITY | 8 | 365 | 2.675e-06 | 9.086e-05 |
| 138 | REGULATION OF ENDOTHELIAL CELL DEVELOPMENT | 3 | 12 | 2.994e-06 | 9.949e-05 |
| 139 | REGULATION OF ESTABLISHMENT OF ENDOTHELIAL BARRIER | 3 | 12 | 2.994e-06 | 9.949e-05 |
| 140 | NEGATIVE REGULATION OF RESPONSE TO STIMULUS | 14 | 1360 | 2.989e-06 | 9.949e-05 |
| 141 | LEUKOCYTE MIGRATION | 7 | 259 | 3.042e-06 | 0.0001004 |
| 142 | REGULATION OF BODY FLUID LEVELS | 9 | 506 | 3.303e-06 | 0.0001082 |
| 143 | CELLULAR RESPONSE TO ABIOTIC STIMULUS | 7 | 263 | 3.365e-06 | 0.0001095 |
| 144 | HEPATOCYTE APOPTOTIC PROCESS | 3 | 13 | 3.885e-06 | 0.0001255 |
| 145 | MULTICELLULAR ORGANISMAL HOMEOSTASIS | 7 | 272 | 4.2e-06 | 0.0001348 |
| 146 | CELLULAR RESPONSE TO PEPTIDE | 7 | 274 | 4.408e-06 | 0.0001405 |
| 147 | CELLULAR HOMEOSTASIS | 10 | 676 | 4.542e-06 | 0.0001438 |
| 148 | RESPONSE TO BACTERIUM | 9 | 528 | 4.668e-06 | 0.0001468 |
| 149 | REGULATION OF CAMP DEPENDENT PROTEIN KINASE ACTIVITY | 3 | 14 | 4.936e-06 | 0.0001541 |
| 150 | NEGATIVE REGULATION OF CELLULAR COMPONENT ORGANIZATION | 10 | 684 | 5.039e-06 | 0.0001563 |
| 151 | STRESS ACTIVATED PROTEIN KINASE SIGNALING CASCADE | 5 | 103 | 5.232e-06 | 0.0001612 |
| 152 | RESPONSE TO PEPTIDE | 8 | 404 | 5.652e-06 | 0.000173 |
| 153 | RESPONSE TO GLUCAGON | 4 | 48 | 5.715e-06 | 0.0001738 |
| 154 | POSITIVE REGULATION OF PROTEIN SERINE THREONINE KINASE ACTIVITY | 7 | 289 | 6.251e-06 | 0.0001889 |
| 155 | LEUKOCYTE DIFFERENTIATION | 7 | 292 | 6.688e-06 | 0.0001995 |
| 156 | CELLULAR RESPONSE TO HORMONE STIMULUS | 9 | 552 | 6.685e-06 | 0.0001995 |
| 157 | RESPONSE TO LIPID | 11 | 888 | 7.688e-06 | 0.0002279 |
| 158 | RESPONSE TO AMINO ACID | 5 | 112 | 7.887e-06 | 0.0002323 |
| 159 | RESPONSE TO HORMONE | 11 | 893 | 8.108e-06 | 0.0002373 |
| 160 | CELLULAR RESPONSE TO AMINO ACID STIMULUS | 4 | 53 | 8.523e-06 | 0.0002479 |
| 161 | CELLULAR CHEMICAL HOMEOSTASIS | 9 | 570 | 8.653e-06 | 0.0002501 |
| 162 | RESPONSE TO INTERLEUKIN 1 | 5 | 115 | 8.974e-06 | 0.0002577 |
| 163 | REGULATION OF CATABOLIC PROCESS | 10 | 731 | 9.034e-06 | 0.0002579 |
| 164 | NEGATIVE REGULATION OF ANOIKIS | 3 | 17 | 9.173e-06 | 0.0002603 |
| 165 | NEGATIVE REGULATION OF CATABOLIC PROCESS | 6 | 203 | 9.873e-06 | 0.0002784 |
| 166 | POSITIVE REGULATION OF GENE EXPRESSION | 15 | 1733 | 1.015e-05 | 0.0002844 |
| 167 | FC RECEPTOR SIGNALING PATHWAY | 6 | 206 | 1.073e-05 | 0.0002991 |
| 168 | POSITIVE REGULATION OF MAP KINASE ACTIVITY | 6 | 207 | 1.103e-05 | 0.0003056 |
| 169 | LIPID MODIFICATION | 6 | 210 | 1.197e-05 | 0.0003277 |
| 170 | REGULATION OF EPITHELIAL CELL DIFFERENTIATION | 5 | 122 | 1.197e-05 | 0.0003277 |
| 171 | MULTICELLULAR ORGANISMAL WATER HOMEOSTASIS | 4 | 58 | 1.224e-05 | 0.000333 |
| 172 | ORGANOPHOSPHATE BIOSYNTHETIC PROCESS | 8 | 450 | 1.239e-05 | 0.0003353 |
| 173 | NECROPTOTIC PROCESS | 3 | 21 | 1.782e-05 | 0.0004792 |
| 174 | LYMPHOCYTE ACTIVATION | 7 | 342 | 1.863e-05 | 0.0004983 |
| 175 | REGULATION OF CELL ADHESION | 9 | 629 | 1.896e-05 | 0.0005041 |
| 176 | IMMUNE EFFECTOR PROCESS | 8 | 486 | 2.157e-05 | 0.0005702 |
| 177 | POSITIVE REGULATION OF NEURON DEATH | 4 | 67 | 2.175e-05 | 0.0005719 |
| 178 | PLATELET ACTIVATION | 5 | 142 | 2.493e-05 | 0.0006518 |
| 179 | WATER HOMEOSTASIS | 4 | 70 | 2.588e-05 | 0.0006728 |
| 180 | REGULATION OF ANOIKIS | 3 | 24 | 2.698e-05 | 0.0006935 |
| 181 | REGULATION OF EXECUTION PHASE OF APOPTOSIS | 3 | 24 | 2.698e-05 | 0.0006935 |
| 182 | RESPONSE TO VIRUS | 6 | 247 | 2.993e-05 | 0.0007653 |
| 183 | PEPTIDYL SERINE MODIFICATION | 5 | 148 | 3.042e-05 | 0.0007697 |
| 184 | CELLULAR EXTRAVASATION | 3 | 25 | 3.06e-05 | 0.0007697 |
| 185 | EPITHELIAL CELL APOPTOTIC PROCESS | 3 | 25 | 3.06e-05 | 0.0007697 |
| 186 | REGULATION OF MULTICELLULAR ORGANISMAL DEVELOPMENT | 14 | 1672 | 3.175e-05 | 0.0007941 |
| 187 | CELLULAR RESPONSE TO CARBOHYDRATE STIMULUS | 4 | 74 | 3.225e-05 | 0.0008024 |
| 188 | REGULATION OF NECROTIC CELL DEATH | 3 | 26 | 3.453e-05 | 0.0008547 |
| 189 | LEUKOCYTE CELL CELL ADHESION | 6 | 255 | 3.578e-05 | 0.0008809 |
| 190 | REGULATION OF ENDOTHELIAL CELL DIFFERENTIATION | 3 | 27 | 3.878e-05 | 0.0009498 |
| 191 | CELLULAR RESPONSE TO EXTERNAL STIMULUS | 6 | 264 | 4.342e-05 | 0.001047 |
| 192 | NUCLEOTIDE BINDING DOMAIN LEUCINE RICH REPEAT CONTAINING RECEPTOR SIGNALING PATHWAY | 3 | 28 | 4.336e-05 | 0.001047 |
| 193 | NECROTIC CELL DEATH | 3 | 28 | 4.336e-05 | 0.001047 |
| 194 | CELLULAR RESPONSE TO MECHANICAL STIMULUS | 4 | 80 | 4.385e-05 | 0.001052 |
| 195 | LIPID BIOSYNTHETIC PROCESS | 8 | 539 | 4.503e-05 | 0.001074 |
| 196 | NEGATIVE REGULATION OF MOLECULAR FUNCTION | 11 | 1079 | 4.699e-05 | 0.001116 |
| 197 | JNK CASCADE | 4 | 82 | 4.832e-05 | 0.001141 |
| 198 | MYD88 INDEPENDENT TOLL LIKE RECEPTOR SIGNALING PATHWAY | 3 | 30 | 5.356e-05 | 0.001259 |
| 199 | SIGNAL TRANSDUCTION BY PROTEIN PHOSPHORYLATION | 7 | 404 | 5.385e-05 | 0.001259 |
| 200 | GLUCOSE HOMEOSTASIS | 5 | 170 | 5.895e-05 | 0.001365 |
| 201 | CARBOHYDRATE HOMEOSTASIS | 5 | 170 | 5.895e-05 | 0.001365 |
| 202 | CELLULAR LIPID METABOLIC PROCESS | 10 | 913 | 6.069e-05 | 0.001391 |
| 203 | NEGATIVE REGULATION OF NEURON DEATH | 5 | 171 | 6.061e-05 | 0.001391 |
| 204 | LEUKOCYTE ACTIVATION | 7 | 414 | 6.281e-05 | 0.001426 |
| 205 | REGULATION OF LIPID METABOLIC PROCESS | 6 | 282 | 6.262e-05 | 0.001426 |
| 206 | MYD88 DEPENDENT TOLL LIKE RECEPTOR SIGNALING PATHWAY | 3 | 32 | 6.52e-05 | 0.001473 |
| 207 | CYTOPLASMIC PATTERN RECOGNITION RECEPTOR SIGNALING PATHWAY | 3 | 33 | 7.16e-05 | 0.001609 |
| 208 | IMMUNE SYSTEM DEVELOPMENT | 8 | 582 | 7.716e-05 | 0.001726 |
| 209 | REGULATION OF INFLAMMATORY RESPONSE | 6 | 294 | 7.882e-05 | 0.001755 |
| 210 | ANATOMICAL STRUCTURE FORMATION INVOLVED IN MORPHOGENESIS | 10 | 957 | 8.988e-05 | 0.001992 |
| 211 | REGULATION OF ORGANELLE ORGANIZATION | 11 | 1178 | 0.0001036 | 0.002286 |
| 212 | RESPONSE TO OXYGEN LEVELS | 6 | 311 | 0.0001073 | 0.002356 |
| 213 | SINGLE ORGANISM CELL ADHESION | 7 | 459 | 0.0001196 | 0.002613 |
| 214 | POSITIVE REGULATION OF PROTEIN IMPORT | 4 | 104 | 0.0001221 | 0.002655 |
| 215 | RESPONSE TO ACID CHEMICAL | 6 | 319 | 0.0001233 | 0.002669 |
| 216 | REGULATION OF PHOSPHATIDYLINOSITOL 3 KINASE ACTIVITY | 3 | 40 | 0.0001281 | 0.00276 |
| 217 | RESPONSE TO INORGANIC SUBSTANCE | 7 | 479 | 0.0001557 | 0.003327 |
| 218 | LYMPHOCYTE DIFFERENTIATION | 5 | 209 | 0.0001559 | 0.003327 |
| 219 | NEGATIVE REGULATION OF CATALYTIC ACTIVITY | 9 | 829 | 0.0001598 | 0.00338 |
| 220 | MYELOID LEUKOCYTE MEDIATED IMMUNITY | 3 | 43 | 0.0001592 | 0.00338 |
| 221 | REGULATION OF CELL ACTIVATION | 7 | 484 | 0.0001659 | 0.003493 |
| 222 | CELL PROLIFERATION | 8 | 672 | 0.0002078 | 0.004336 |
| 223 | POSITIVE REGULATION OF NEURON APOPTOTIC PROCESS | 3 | 47 | 0.0002077 | 0.004336 |
| 224 | POSITIVE REGULATION OF NUCLEOCYTOPLASMIC TRANSPORT | 4 | 121 | 0.0002188 | 0.004546 |
| 225 | REGULATION OF LIPID KINASE ACTIVITY | 3 | 48 | 0.0002212 | 0.004574 |
| 226 | RESPONSE TO GAMMA RADIATION | 3 | 50 | 0.0002498 | 0.005143 |
| 227 | NEGATIVE REGULATION OF PROTEIN METABOLIC PROCESS | 10 | 1087 | 0.0002548 | 0.005215 |
| 228 | NEGATIVE REGULATION OF PROTEIN SERINE THREONINE KINASE ACTIVITY | 4 | 126 | 0.0002555 | 0.005215 |
| 229 | RESPONSE TO ENDOPLASMIC RETICULUM STRESS | 5 | 233 | 0.0002582 | 0.005246 |
| 230 | POSITIVE REGULATION OF TRANSCRIPTION FACTOR IMPORT INTO NUCLEUS | 3 | 51 | 0.0002649 | 0.00536 |
| 231 | EMBRYO DEVELOPMENT | 9 | 894 | 0.0002806 | 0.005629 |
| 232 | POSITIVE REGULATION OF PROTEIN LOCALIZATION TO NUCLEUS | 4 | 129 | 0.0002795 | 0.005629 |
| 233 | NEGATIVE REGULATION OF IMMUNE SYSTEM PROCESS | 6 | 372 | 0.0002831 | 0.005654 |
| 234 | POSITIVE REGULATION OF BIOSYNTHETIC PROCESS | 13 | 1805 | 0.0002992 | 0.005949 |
| 235 | B CELL ACTIVATION | 4 | 132 | 0.0003052 | 0.006042 |
| 236 | REGULATION OF CERAMIDE BIOSYNTHETIC PROCESS | 2 | 11 | 0.0003189 | 0.006208 |
| 237 | POSITIVE REGULATION OF HAIR CYCLE | 2 | 11 | 0.0003189 | 0.006208 |
| 238 | REGULATION OF NECROPTOTIC PROCESS | 2 | 11 | 0.0003189 | 0.006208 |
| 239 | POSITIVE REGULATION OF NFAT PROTEIN IMPORT INTO NUCLEUS | 2 | 11 | 0.0003189 | 0.006208 |
| 240 | NEGATIVE REGULATION OF NEURON APOPTOTIC PROCESS | 4 | 135 | 0.0003324 | 0.006391 |
| 241 | EXECUTION PHASE OF APOPTOSIS | 3 | 55 | 0.0003315 | 0.006391 |
| 242 | CELLULAR RESPONSE TO DNA DAMAGE STIMULUS | 8 | 720 | 0.0003311 | 0.006391 |
| 243 | RESPONSE TO ORGANIC CYCLIC COMPOUND | 9 | 917 | 0.0003384 | 0.006481 |
| 244 | REGULATION OF AUTOPHAGY | 5 | 249 | 0.0003504 | 0.006676 |
| 245 | ACTIVATION OF MAPK ACTIVITY | 4 | 137 | 0.0003515 | 0.006676 |
| 246 | REGULATION OF PHOSPHATIDYLINOSITOL 3 KINASE SIGNALING | 4 | 138 | 0.0003614 | 0.006835 |
| 247 | POSITIVE REGULATION OF GLUCOSE IMPORT IN RESPONSE TO INSULIN STIMULUS | 2 | 12 | 0.0003821 | 0.007197 |
| 248 | LIPID METABOLIC PROCESS | 10 | 1158 | 0.0004223 | 0.007923 |
| 249 | REGULATION OF GLUCOSE IMPORT | 3 | 60 | 0.0004287 | 0.008011 |
| 250 | REGULATION OF SPHINGOLIPID BIOSYNTHETIC PROCESS | 2 | 13 | 0.0004508 | 0.008259 |
| 251 | REGULATION OF MEMBRANE LIPID METABOLIC PROCESS | 2 | 13 | 0.0004508 | 0.008259 |
| 252 | REGULATION OF PHOSPHOLIPID METABOLIC PROCESS | 3 | 61 | 0.0004501 | 0.008259 |
| 253 | PROTEIN AUTOPROCESSING | 2 | 13 | 0.0004508 | 0.008259 |
| 254 | REGULATION OF BICELLULAR TIGHT JUNCTION ASSEMBLY | 2 | 13 | 0.0004508 | 0.008259 |
| 255 | REGULATION OF RESPONSE TO WOUNDING | 6 | 413 | 0.0004935 | 0.009005 |
| 256 | TOLL LIKE RECEPTOR 9 SIGNALING PATHWAY | 2 | 14 | 0.0005251 | 0.009471 |
| 257 | REGULATION OF FIBROBLAST APOPTOTIC PROCESS | 2 | 14 | 0.0005251 | 0.009471 |
| 258 | T CELL MIGRATION | 2 | 14 | 0.0005251 | 0.009471 |
| 259 | CELL DEVELOPMENT | 11 | 1426 | 0.0005447 | 0.009786 |
| Num | GO | Overlap | Size | P Value | Adj. P Value |
|---|---|---|---|---|---|
| 1 | KINASE ACTIVITY | 17 | 842 | 6.397e-12 | 2.972e-09 |
| 2 | PHOSPHATIDYLINOSITOL 3 KINASE ACTIVITY | 8 | 70 | 5.996e-12 | 2.972e-09 |
| 3 | X1 PHOSPHATIDYLINOSITOL 3 KINASE ACTIVITY | 7 | 43 | 1.021e-11 | 3.162e-09 |
| 4 | PHOSPHATIDYLINOSITOL KINASE ACTIVITY | 7 | 51 | 3.615e-11 | 8.396e-09 |
| 5 | TRANSFERASE ACTIVITY TRANSFERRING PHOSPHORUS CONTAINING GROUPS | 17 | 992 | 8.407e-11 | 1.562e-08 |
| 6 | CYTOKINE RECEPTOR BINDING | 10 | 271 | 9.123e-10 | 1.413e-07 |
| 7 | TUMOR NECROSIS FACTOR RECEPTOR SUPERFAMILY BINDING | 6 | 47 | 1.567e-09 | 2.08e-07 |
| 8 | PROTEIN SERINE THREONINE KINASE ACTIVITY | 11 | 445 | 7.962e-09 | 9.246e-07 |
| 9 | PROTEIN KINASE ACTIVITY | 12 | 640 | 3.247e-08 | 3.352e-06 |
| 10 | ADENYL NUCLEOTIDE BINDING | 17 | 1514 | 5.069e-08 | 4.709e-06 |
| 11 | PHOSPHATIDYLINOSITOL PHOSPHATE KINASE ACTIVITY | 4 | 16 | 5.662e-08 | 4.782e-06 |
| 12 | KINASE REGULATOR ACTIVITY | 7 | 186 | 3.319e-07 | 2.372e-05 |
| 13 | DEATH RECEPTOR ACTIVITY | 4 | 24 | 3.259e-07 | 2.372e-05 |
| 14 | ENZYME BINDING | 17 | 1737 | 3.692e-07 | 2.45e-05 |
| 15 | TUMOR NECROSIS FACTOR RECEPTOR BINDING | 4 | 30 | 8.314e-07 | 5.149e-05 |
| 16 | RIBONUCLEOTIDE BINDING | 17 | 1860 | 9.713e-07 | 5.64e-05 |
| 17 | PROTEIN HETERODIMERIZATION ACTIVITY | 9 | 468 | 1.743e-06 | 9.526e-05 |
| 18 | CYSTEINE TYPE ENDOPEPTIDASE ACTIVITY | 5 | 86 | 2.148e-06 | 0.00011 |
| 19 | INSULIN RECEPTOR SUBSTRATE BINDING | 3 | 11 | 2.249e-06 | 0.00011 |
| 20 | ENZYME REGULATOR ACTIVITY | 12 | 959 | 2.458e-06 | 0.0001142 |
| 21 | MOLECULAR FUNCTION REGULATOR | 14 | 1353 | 2.813e-06 | 0.0001244 |
| 22 | UBIQUITIN LIKE PROTEIN LIGASE BINDING | 7 | 264 | 3.451e-06 | 0.0001457 |
| 23 | PROTEASE BINDING | 5 | 104 | 5.487e-06 | 0.0002216 |
| 24 | PROTEIN KINASE A CATALYTIC SUBUNIT BINDING | 3 | 15 | 6.159e-06 | 0.0002289 |
| 25 | CYSTEINE TYPE ENDOPEPTIDASE ACTIVITY INVOLVED IN APOPTOTIC PROCESS | 3 | 15 | 6.159e-06 | 0.0002289 |
| 26 | INTERLEUKIN 1 RECEPTOR BINDING | 3 | 16 | 7.568e-06 | 0.0002704 |
| 27 | DEATH RECEPTOR BINDING | 3 | 18 | 1.099e-05 | 0.0003781 |
| 28 | CAMP BINDING | 3 | 23 | 2.365e-05 | 0.0007845 |
| 29 | RECEPTOR BINDING | 13 | 1476 | 3.886e-05 | 0.001245 |
| 30 | PROTEIN SERINE THREONINE KINASE INHIBITOR ACTIVITY | 3 | 30 | 5.356e-05 | 0.001658 |
| 31 | PROTEIN DIMERIZATION ACTIVITY | 11 | 1149 | 8.294e-05 | 0.002485 |
| 32 | CYSTEINE TYPE PEPTIDASE ACTIVITY | 5 | 184 | 8.573e-05 | 0.002489 |
| 33 | CYCLIC NUCLEOTIDE BINDING | 3 | 36 | 9.322e-05 | 0.002624 |
| 34 | KINASE BINDING | 8 | 606 | 0.0001022 | 0.002792 |
| 35 | PROTEIN KINASE A BINDING | 3 | 42 | 0.0001483 | 0.003828 |
| 36 | CYSTEINE TYPE ENDOPEPTIDASE REGULATOR ACTIVITY INVOLVED IN APOPTOTIC PROCESS | 3 | 42 | 0.0001483 | 0.003828 |
| 37 | SIGNAL TRANSDUCER ACTIVITY | 13 | 1731 | 0.0001978 | 0.004965 |
| 38 | GROWTH FACTOR RECEPTOR BINDING | 4 | 129 | 0.0002795 | 0.006834 |
| 39 | ENZYME INHIBITOR ACTIVITY | 6 | 378 | 0.0003084 | 0.007347 |
| Num | GO | Overlap | Size | P Value | Adj. P Value |
|---|---|---|---|---|---|
| 1 | TRANSFERASE COMPLEX TRANSFERRING PHOSPHORUS CONTAINING GROUPS | 13 | 237 | 1.176e-14 | 6.866e-12 |
| 2 | PHOSPHATIDYLINOSITOL 3 KINASE COMPLEX | 7 | 20 | 2.563e-14 | 7.483e-12 |
| 3 | MEMBRANE MICRODOMAIN | 12 | 288 | 3.63e-12 | 7.067e-10 |
| 4 | CATALYTIC COMPLEX | 16 | 1038 | 1.638e-09 | 2.391e-07 |
| 5 | TRANSFERASE COMPLEX | 13 | 703 | 9.148e-09 | 1.068e-06 |
| 6 | PROTEIN KINASE COMPLEX | 6 | 90 | 8.395e-08 | 7.777e-06 |
| 7 | MEMBRANE PROTEIN COMPLEX | 14 | 1020 | 9.321e-08 | 7.777e-06 |
| 8 | CILIARY BASE | 4 | 23 | 2.72e-07 | 1.986e-05 |
| 9 | EXTRINSIC COMPONENT OF MEMBRANE | 7 | 252 | 2.538e-06 | 0.0001647 |
| 10 | MEMBRANE REGION | 12 | 1134 | 1.361e-05 | 0.0007951 |
Over-represented Pathway
| Num | Pathway | Pathview | Overlap | Size | P Value | Adj. P Value |
|---|---|---|---|---|---|---|
| 1 | hsa04210_Apoptosis | 49 | 89 | 3.812e-123 | 6.861e-121 | |
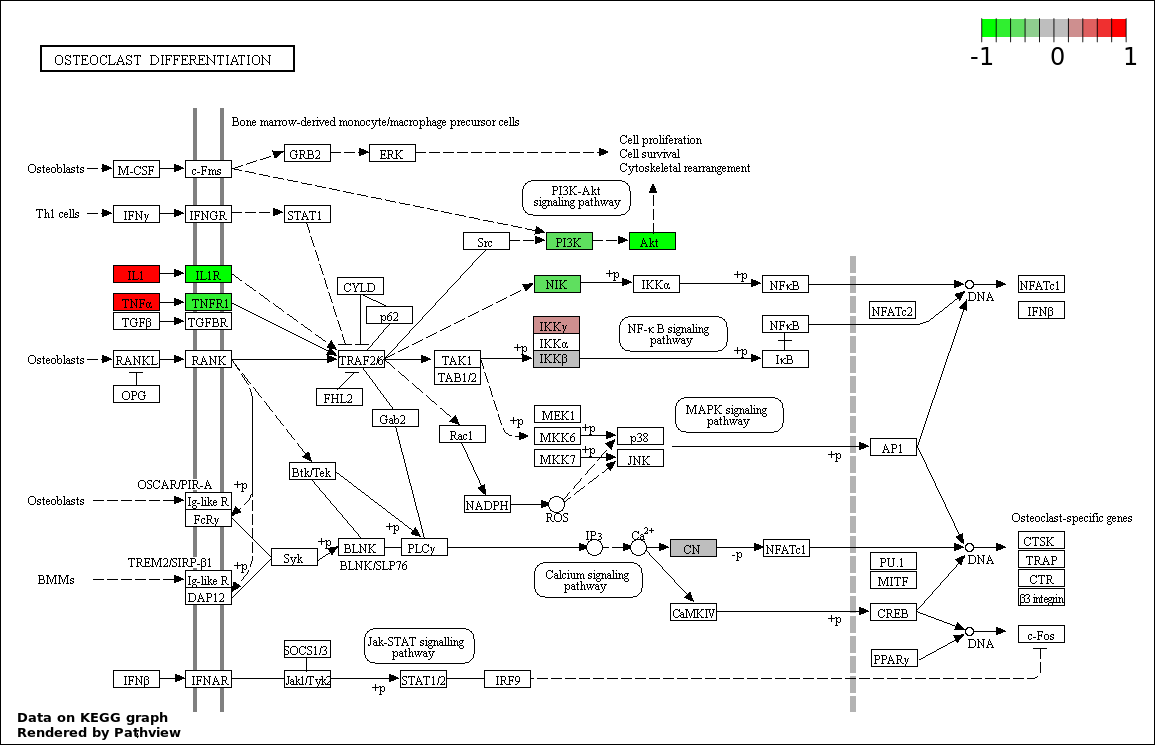
| 2 | hsa04380_Osteoclast_differentiation | 16 | 128 | 8.429e-24 | 7.586e-22 | |
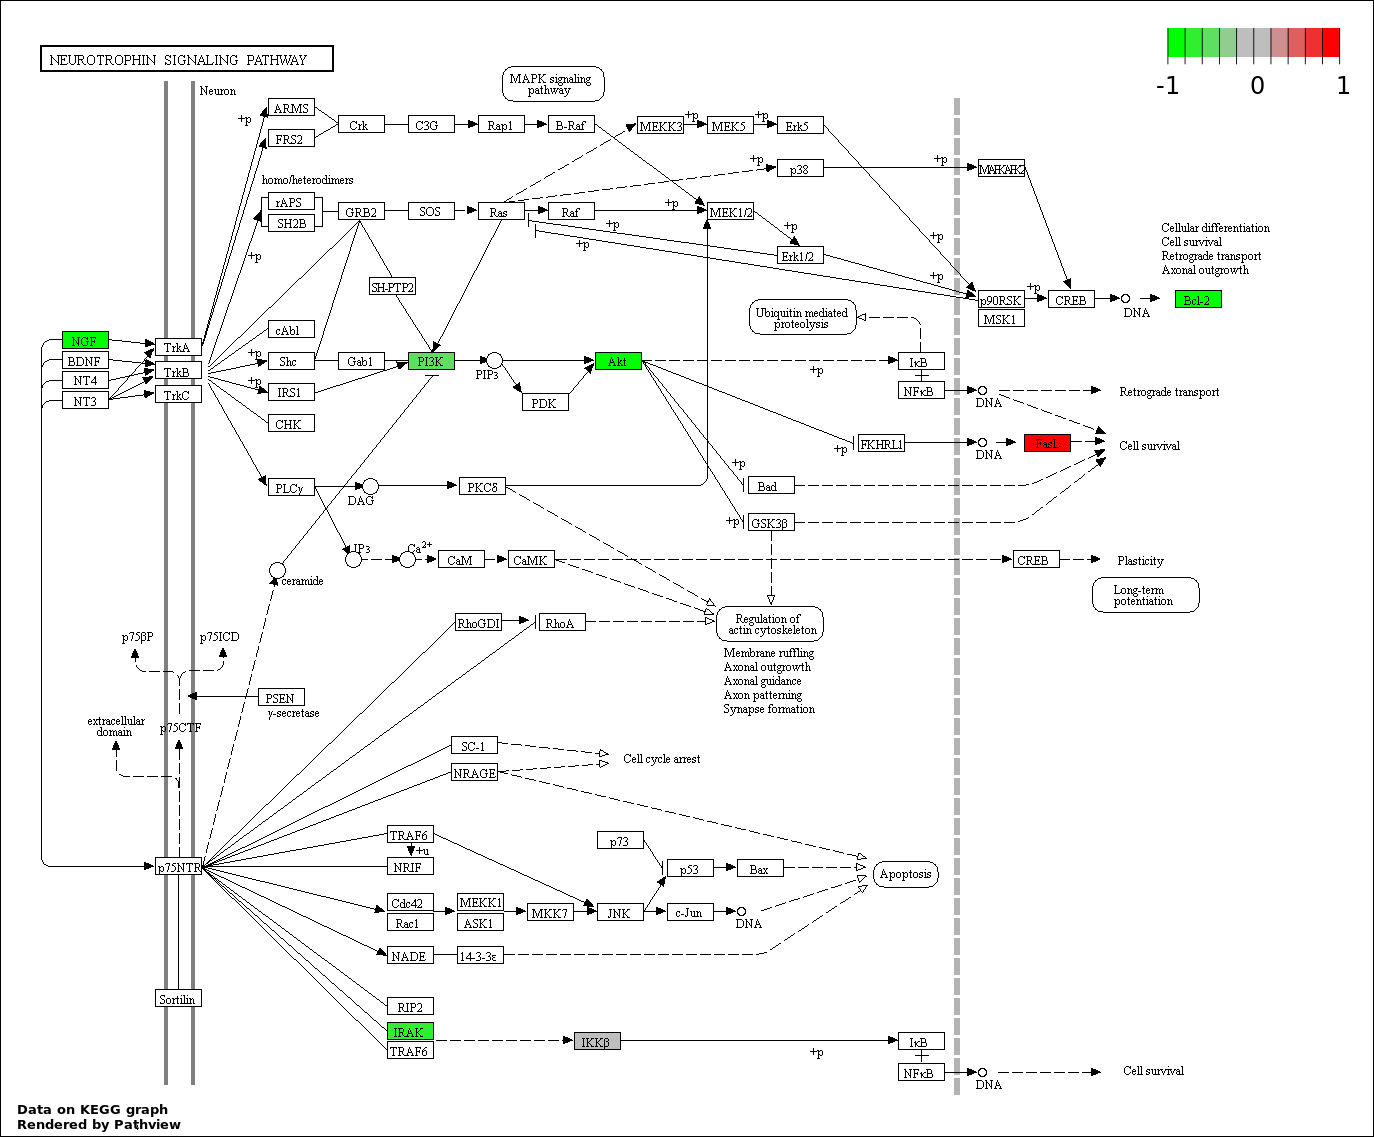
| 3 | hsa04722_Neurotrophin_signaling_pathway | 15 | 127 | 6.165e-22 | 3.699e-20 | |
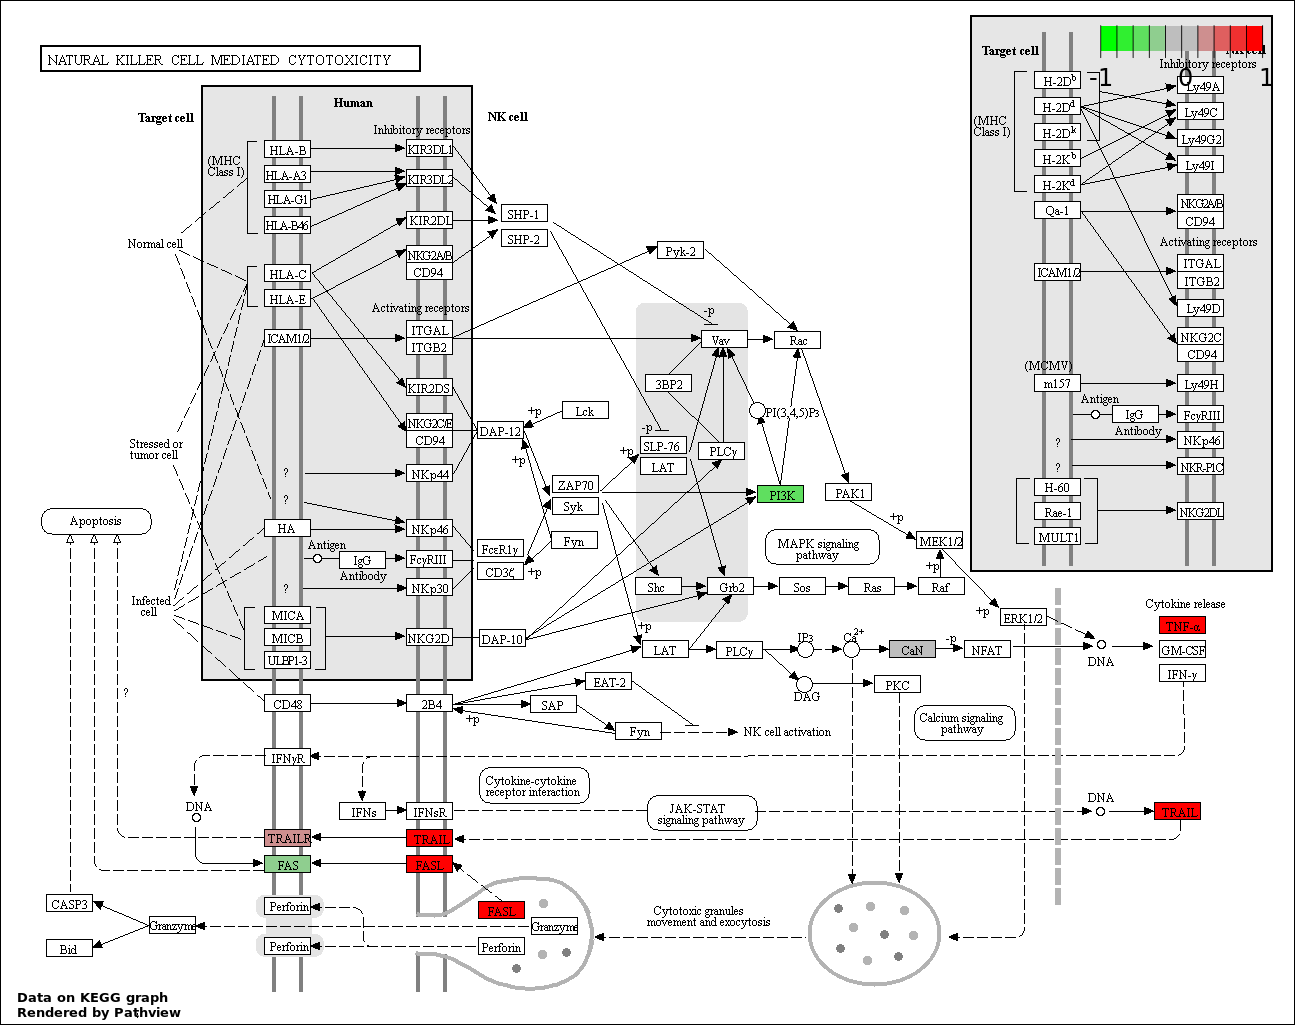
| 4 | hsa04650_Natural_killer_cell_mediated_cytotoxicity | 15 | 136 | 1.8e-21 | 8.102e-20 | |
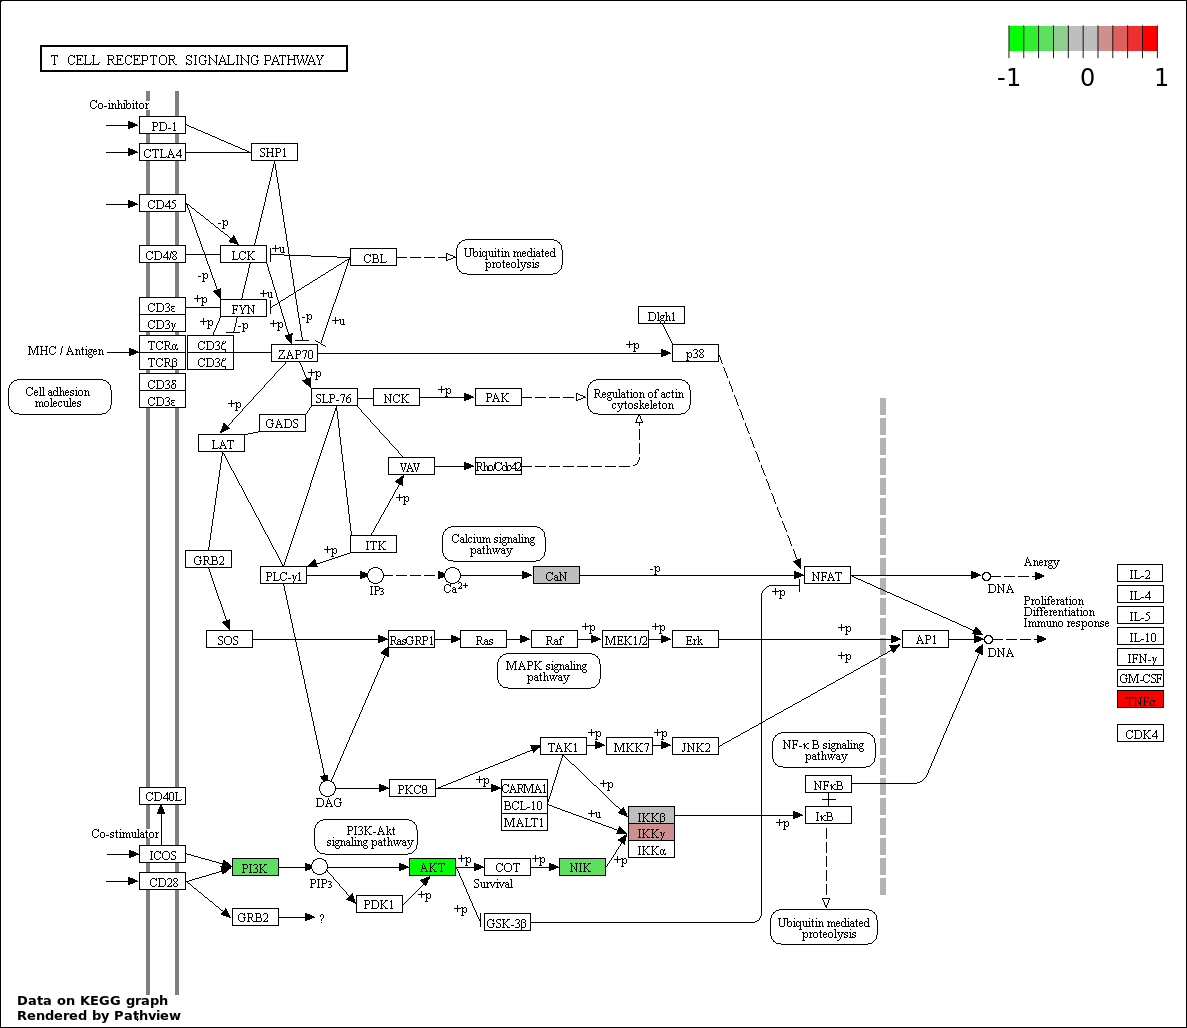
| 5 | hsa04660_T_cell_receptor_signaling_pathway | 14 | 108 | 4.324e-21 | 1.556e-19 | |
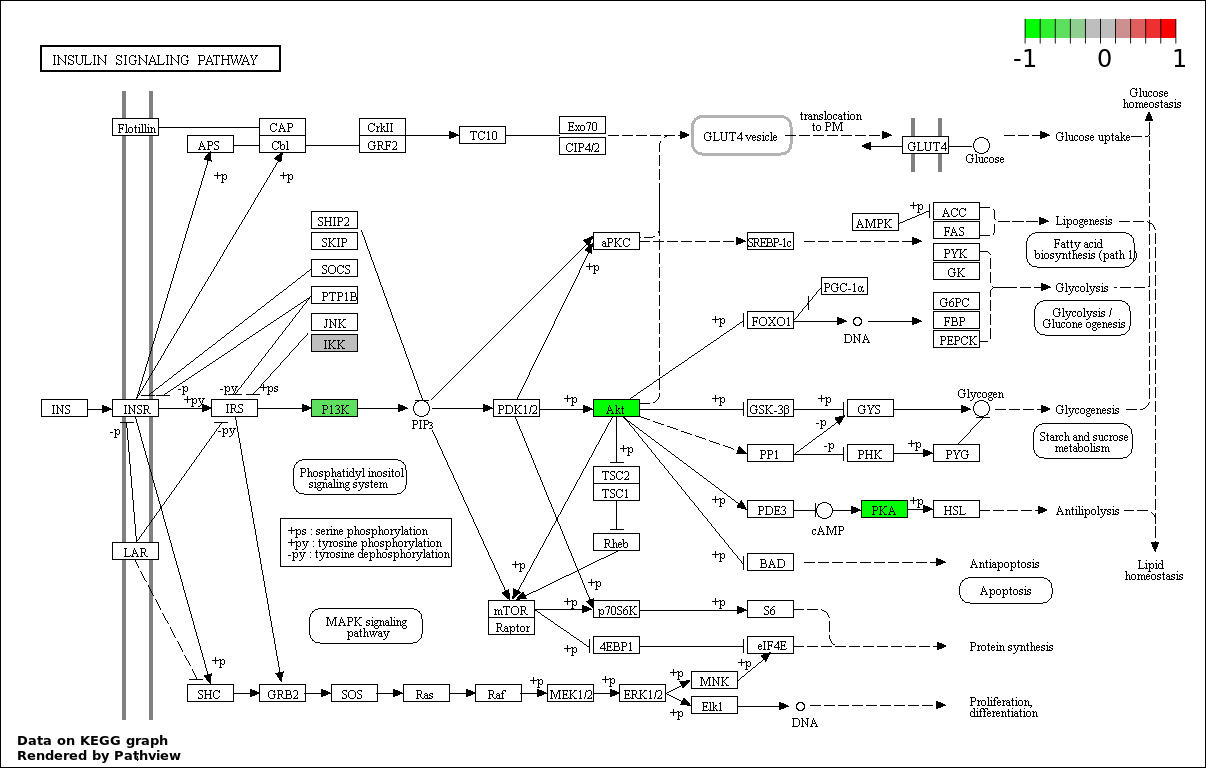
| 6 | hsa04910_Insulin_signaling_pathway | 14 | 138 | 1.552e-19 | 4.655e-18 | |
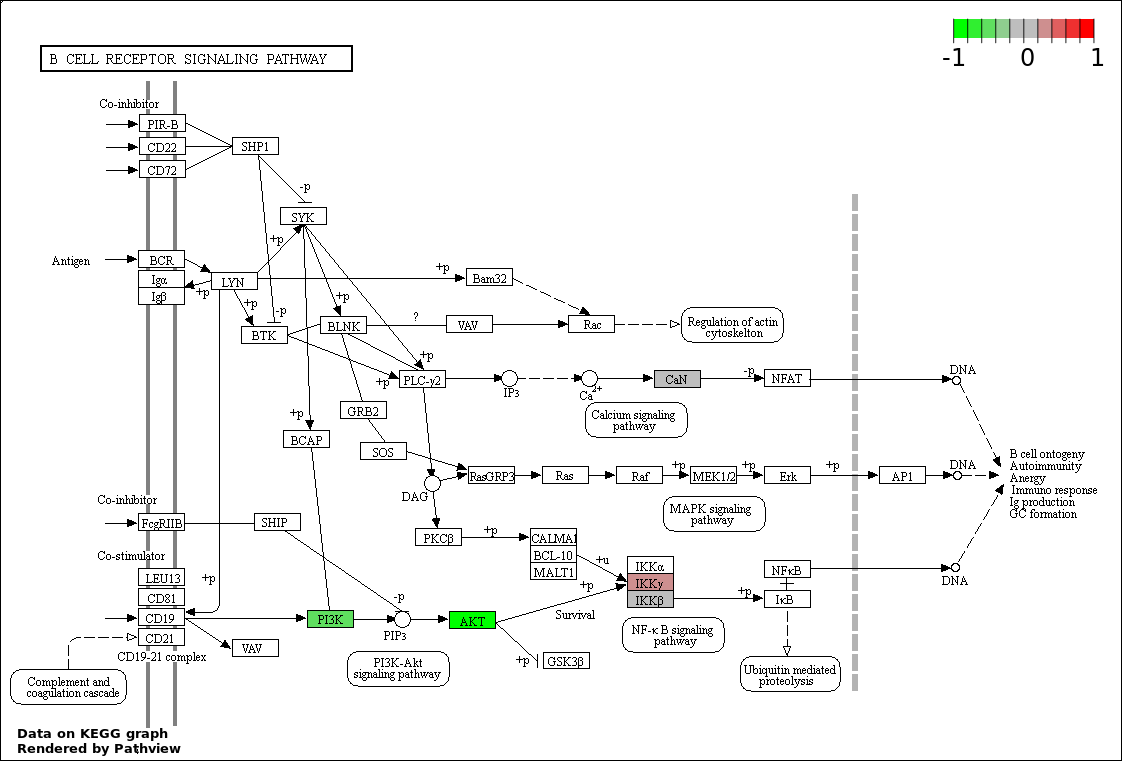
| 7 | hsa04662_B_cell_receptor_signaling_pathway | 12 | 75 | 2.539e-19 | 6.528e-18 | |
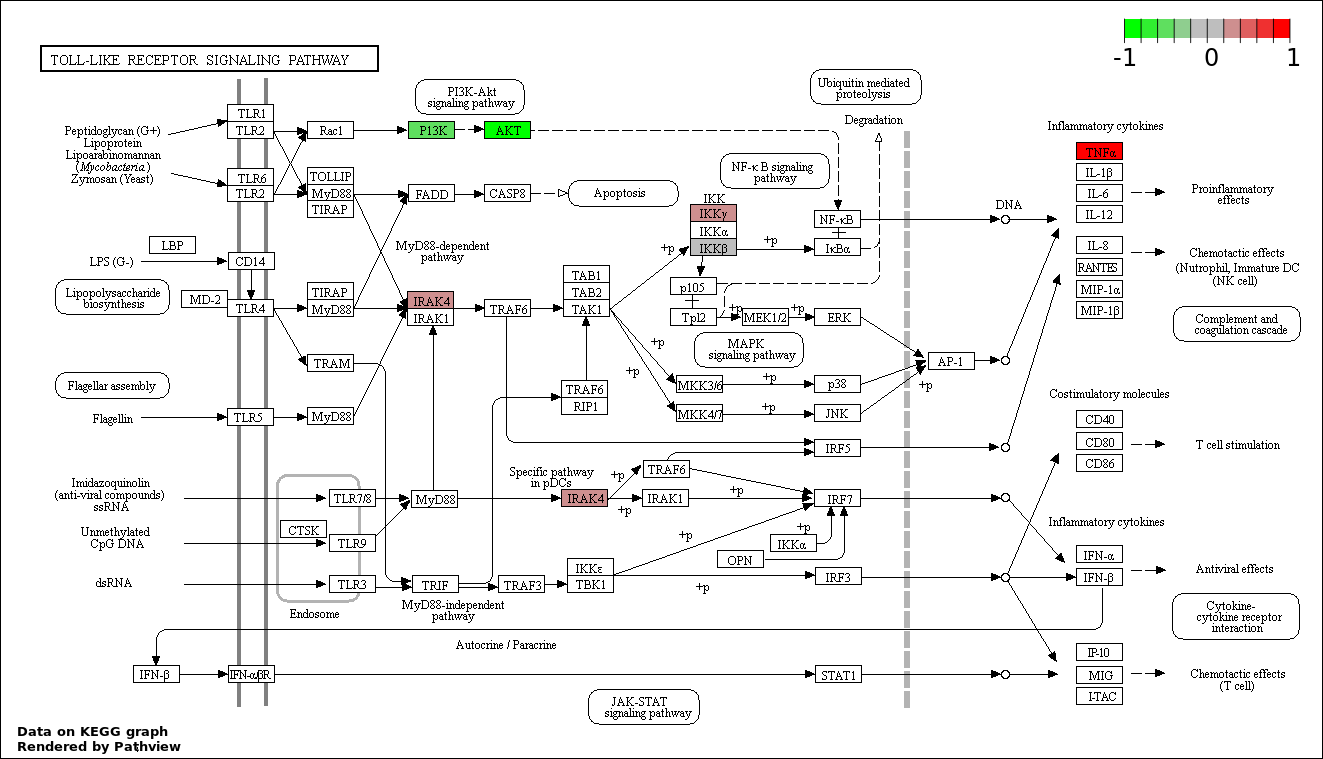
| 8 | hsa04620_Toll.like_receptor_signaling_pathway | 12 | 102 | 1.254e-17 | 2.82e-16 | |
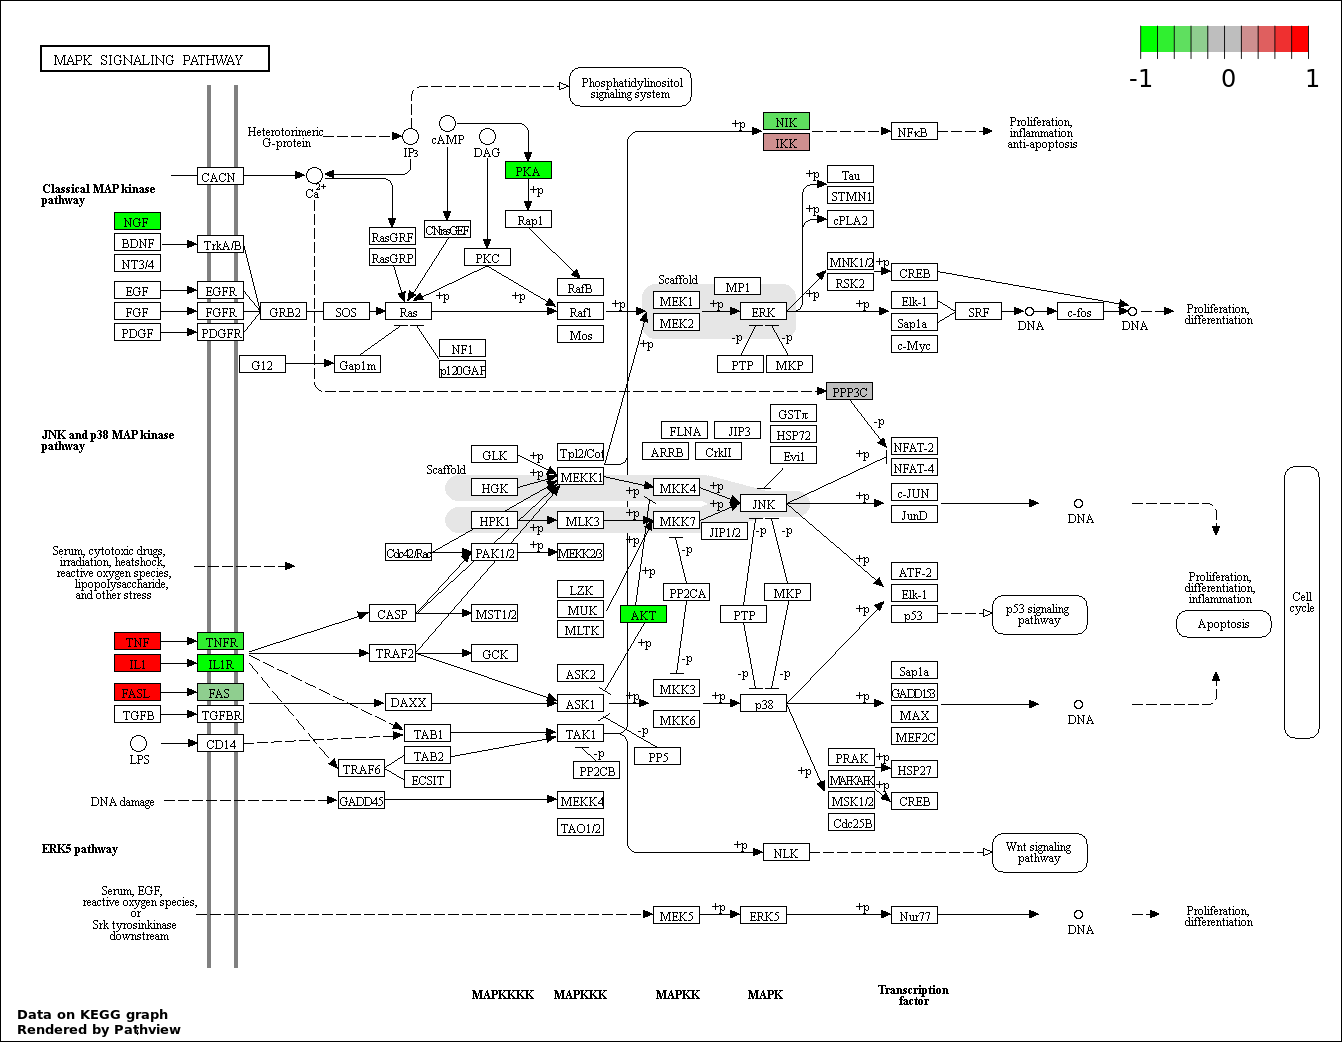
| 9 | hsa04010_MAPK_signaling_pathway | 15 | 268 | 5.711e-17 | 1.142e-15 | |
| 10 | hsa04370_VEGF_signaling_pathway | 10 | 76 | 2.478e-15 | 4.46e-14 | |
| 11 | hsa04914_Progesterone.mediated_oocyte_maturation | 10 | 87 | 1.018e-14 | 1.666e-13 | |
| 12 | hsa04062_Chemokine_signaling_pathway | 12 | 189 | 2.426e-14 | 3.639e-13 | |
| 13 | hsa04510_Focal_adhesion | 12 | 200 | 4.789e-14 | 6.63e-13 | |
| 14 | hsa04151_PI3K_AKT_signaling_pathway | 14 | 351 | 7.875e-14 | 1.012e-12 | |
| 15 | hsa04973_Carbohydrate_digestion_and_absorption | 8 | 44 | 1.18e-13 | 1.417e-12 | |
| 16 | hsa04664_Fc_epsilon_RI_signaling_pathway | 9 | 79 | 2.646e-13 | 2.977e-12 | |
| 17 | hsa04014_Ras_signaling_pathway | 12 | 236 | 3.456e-13 | 3.659e-12 | |
| 18 | hsa04150_mTOR_signaling_pathway | 8 | 52 | 4.94e-13 | 4.94e-12 | |
| 19 | hsa04630_Jak.STAT_signaling_pathway | 10 | 155 | 3.698e-12 | 3.503e-11 | |
| 20 | hsa04960_Aldosterone.regulated_sodium_reabsorption | 7 | 42 | 8.565e-12 | 7.708e-11 | |
| 21 | hsa04012_ErbB_signaling_pathway | 8 | 87 | 3.598e-11 | 3.084e-10 | |
| 22 | hsa04666_Fc_gamma_R.mediated_phagocytosis | 8 | 95 | 7.376e-11 | 6.035e-10 | |
| 23 | hsa04070_Phosphatidylinositol_signaling_system | 7 | 78 | 7.849e-10 | 6.143e-09 | |
| 24 | hsa04670_Leukocyte_transendothelial_migration | 7 | 117 | 1.371e-08 | 1.029e-07 | |
| 25 | hsa04920_Adipocytokine_signaling_pathway | 6 | 68 | 1.537e-08 | 1.107e-07 | |
| 26 | hsa04621_NOD.like_receptor_signaling_pathway | 5 | 59 | 3.244e-07 | 2.246e-06 | |
| 27 | hsa04622_RIG.I.like_receptor_signaling_pathway | 5 | 71 | 8.253e-07 | 5.49e-06 | |
| 28 | hsa04810_Regulation_of_actin_cytoskeleton | 7 | 214 | 8.54e-07 | 5.49e-06 | |
| 29 | hsa00562_Inositol_phosphate_metabolism | 4 | 57 | 1.141e-05 | 7.085e-05 | |
| 30 | hsa04115_p53_signaling_pathway | 4 | 69 | 2.445e-05 | 0.0001467 | |
| 31 | hsa04720_Long.term_potentiation | 4 | 70 | 2.588e-05 | 0.0001503 | |
| 32 | hsa04114_Oocyte_meiosis | 4 | 114 | 0.0001741 | 0.0009791 | |
| 33 | hsa04310_Wnt_signaling_pathway | 4 | 151 | 0.000508 | 0.002771 | |
| 34 | hsa04020_Calcium_signaling_pathway | 4 | 177 | 0.0009209 | 0.004875 | |
| 35 | hsa04640_Hematopoietic_cell_lineage | 3 | 88 | 0.00131 | 0.006738 | |
| 36 | hsa04962_Vasopressin.regulated_water_reabsorption | 2 | 44 | 0.005209 | 0.02605 | |
| 37 | hsa04742_Taste_transduction | 2 | 52 | 0.007212 | 0.03508 | |
| 38 | hsa04141_Protein_processing_in_endoplasmic_reticulum | 3 | 168 | 0.008083 | 0.03746 | |
| 39 | hsa04340_Hedgehog_signaling_pathway | 2 | 56 | 0.008323 | 0.03746 | |
| 40 | hsa04623_Cytosolic_DNA.sensing_pathway | 2 | 56 | 0.008323 | 0.03746 | |
| 41 | hsa04976_Bile_secretion | 2 | 71 | 0.01312 | 0.05761 | |
| 42 | hsa04971_Gastric_acid_secretion | 2 | 74 | 0.0142 | 0.06084 | |
| 43 | hsa04970_Salivary_secretion | 2 | 89 | 0.02011 | 0.08401 | |
| 44 | hsa04540_Gap_junction | 2 | 90 | 0.02054 | 0.08401 | |
| 45 | hsa04912_GnRH_signaling_pathway | 2 | 101 | 0.02546 | 0.09961 | |
| 46 | hsa04916_Melanogenesis | 2 | 101 | 0.02546 | 0.09961 | |
| 47 | hsa04270_Vascular_smooth_muscle_contraction | 2 | 116 | 0.03286 | 0.1258 | |
| 48 | hsa04360_Axon_guidance | 2 | 130 | 0.04042 | 0.1516 | |
| 49 | hsa04120_Ubiquitin_mediated_proteolysis | 2 | 139 | 0.0456 | 0.1675 | |
| 50 | hsa04740_Olfactory_transduction | 2 | 388 | 0.2459 | 0.835 |


lncRNA-mediated sponge
| Num | lncRNA | miRNAs | miRNAs count | Gene | Sponge regulatory network | lncRNA log2FC | lncRNA pvalue | Gene log2FC | Gene pvalue | lncRNA-gene Pearson correlation |
|---|---|---|---|---|---|---|---|---|---|---|
| 1 | RP11-389C8.2 | hsa-let-7a-3p;hsa-miR-141-3p;hsa-miR-16-2-3p;hsa-miR-17-5p;hsa-miR-182-5p;hsa-miR-183-5p;hsa-miR-18a-5p;hsa-miR-193a-3p;hsa-miR-19b-3p;hsa-miR-200a-3p;hsa-miR-200c-3p;hsa-miR-3065-5p;hsa-miR-429;hsa-miR-93-5p | 14 | PRKACB | Sponge network | -3.089 | 2.0E-5 | -1.469 | 0.00691 | 0.394 |
| 2 | RP11-284N8.3 | hsa-miR-141-3p;hsa-miR-17-5p;hsa-miR-182-5p;hsa-miR-183-5p;hsa-miR-18a-5p;hsa-miR-19b-3p;hsa-miR-200a-3p;hsa-miR-3065-5p;hsa-miR-93-5p;hsa-miR-96-5p | 10 | PRKACB | Sponge network | -0.845 | 0.52848 | -1.469 | 0.00691 | 0.371 |
| 3 | MAGI2-AS3 |
hsa-let-7a-3p;hsa-miR-141-3p;hsa-miR-16-2-3p;hsa-miR-17-5p;hsa-miR-182-5p;hsa-miR-183-5p;hsa-miR-18a-5p;hsa-miR-193a-3p;hsa-miR-19a-3p;hsa-miR-19b-3p;hsa-miR-200a-3p;hsa-miR-200c-3p;hsa-miR-3065-5p;hsa-miR-429;hsa-miR-93-5p | 15 | PRKACB | Sponge network | -4.563 | 0 | -1.469 | 0.00691 | 0.359 |
| 4 | HAND2-AS1 |
hsa-miR-16-2-3p;hsa-miR-16-5p;hsa-miR-200a-5p;hsa-miR-200b-5p;hsa-miR-200c-3p;hsa-miR-21-5p;hsa-miR-24-2-5p;hsa-miR-33b-5p;hsa-miR-365a-3p;hsa-miR-429;hsa-miR-629-5p;hsa-miR-7-5p | 12 | BCL2 | Sponge network | -7.871 | 0 | -3.063 | 1.0E-5 | 0.35 |
| 5 | ADAMTS9-AS1 |
hsa-miR-16-2-3p;hsa-miR-16-5p;hsa-miR-200a-5p;hsa-miR-200b-5p;hsa-miR-200c-3p;hsa-miR-21-5p;hsa-miR-24-2-5p;hsa-miR-365a-3p;hsa-miR-429;hsa-miR-629-5p;hsa-miR-7-5p | 11 | BCL2 | Sponge network | -8.573 | 0.00012 | -3.063 | 1.0E-5 | 0.346 |
| 6 | DNM3OS |
hsa-miR-141-3p;hsa-miR-16-2-3p;hsa-miR-17-5p;hsa-miR-182-5p;hsa-miR-183-5p;hsa-miR-18a-5p;hsa-miR-193a-3p;hsa-miR-19a-3p;hsa-miR-19b-3p;hsa-miR-200a-3p;hsa-miR-200c-3p;hsa-miR-3065-5p;hsa-miR-429;hsa-miR-93-5p;hsa-miR-96-5p | 15 | PRKACB | Sponge network | -3.933 | 0.00059 | -1.469 | 0.00691 | 0.336 |
| 7 | HOXA11-AS | hsa-miR-141-3p;hsa-miR-16-2-3p;hsa-miR-17-5p;hsa-miR-182-5p;hsa-miR-183-5p;hsa-miR-18a-5p;hsa-miR-193a-3p;hsa-miR-19a-3p;hsa-miR-19b-3p;hsa-miR-200a-3p;hsa-miR-200c-3p | 11 | PRKACB | Sponge network | -3.349 | 0.00194 | -1.469 | 0.00691 | 0.326 |
| 8 | MIR143HG |
hsa-miR-16-2-3p;hsa-miR-16-5p;hsa-miR-200a-5p;hsa-miR-200b-5p;hsa-miR-200c-3p;hsa-miR-21-5p;hsa-miR-215-5p;hsa-miR-24-2-5p;hsa-miR-3065-5p;hsa-miR-33b-5p;hsa-miR-429;hsa-miR-629-5p;hsa-miR-7-5p | 13 | BCL2 | Sponge network | -6.51 | 0 | -3.063 | 1.0E-5 | 0.304 |
| 9 | LINC00865 | hsa-miR-141-3p;hsa-miR-16-2-3p;hsa-miR-17-5p;hsa-miR-182-5p;hsa-miR-183-5p;hsa-miR-18a-5p;hsa-miR-19a-3p;hsa-miR-19b-3p;hsa-miR-200a-3p;hsa-miR-429 | 10 | PRKACB | Sponge network | -1.585 | 0.19508 | -1.469 | 0.00691 | 0.302 |
| 10 | RP11-166D19.1 | hsa-miR-141-3p;hsa-miR-16-2-3p;hsa-miR-17-5p;hsa-miR-182-5p;hsa-miR-183-5p;hsa-miR-18a-5p;hsa-miR-193a-3p;hsa-miR-19a-3p;hsa-miR-19b-3p;hsa-miR-200a-3p;hsa-miR-200c-3p;hsa-miR-429;hsa-miR-96-5p | 13 | PRKACB | Sponge network | -4.209 | 2.0E-5 | -1.469 | 0.00691 | 0.282 |
| 11 | AC003090.1 | hsa-miR-141-3p;hsa-miR-16-2-3p;hsa-miR-17-5p;hsa-miR-182-5p;hsa-miR-183-5p;hsa-miR-18a-5p;hsa-miR-193a-3p;hsa-miR-19a-3p;hsa-miR-19b-3p;hsa-miR-200c-3p;hsa-miR-93-5p;hsa-miR-96-5p | 12 | PRKACB | Sponge network | -7.817 | 0.00161 | -1.469 | 0.00691 | 0.279 |
| 12 | MAGI2-AS3 |
hsa-miR-16-2-3p;hsa-miR-16-5p;hsa-miR-200a-5p;hsa-miR-200b-5p;hsa-miR-200c-3p;hsa-miR-21-5p;hsa-miR-24-2-5p;hsa-miR-3065-5p;hsa-miR-33b-5p;hsa-miR-429;hsa-miR-629-5p;hsa-miR-7-5p | 12 | BCL2 | Sponge network | -4.563 | 0 | -3.063 | 1.0E-5 | 0.277 |
| 13 | HAND2-AS1 |
hsa-let-7a-3p;hsa-miR-141-3p;hsa-miR-16-2-3p;hsa-miR-17-5p;hsa-miR-182-5p;hsa-miR-183-5p;hsa-miR-18a-5p;hsa-miR-193a-3p;hsa-miR-19a-3p;hsa-miR-19b-3p;hsa-miR-200a-3p;hsa-miR-200c-3p;hsa-miR-429;hsa-miR-93-5p | 14 | PRKACB | Sponge network | -7.871 | 0 | -1.469 | 0.00691 | 0.272 |
| 14 | MIR143HG |
hsa-miR-141-3p;hsa-miR-16-2-3p;hsa-miR-17-5p;hsa-miR-182-5p;hsa-miR-183-5p;hsa-miR-18a-5p;hsa-miR-193a-3p;hsa-miR-19a-3p;hsa-miR-19b-3p;hsa-miR-200a-3p;hsa-miR-200c-3p;hsa-miR-3065-5p;hsa-miR-429;hsa-miR-93-5p | 14 | PRKACB | Sponge network | -6.51 | 0 | -1.469 | 0.00691 | 0.253 |